Cities with the Highest Percentage of Immigrants from South Eastern Asia in Indiana
RELATED REPORTS & OPTIONS
South Eastern Asia
Indiana
Compare Cities
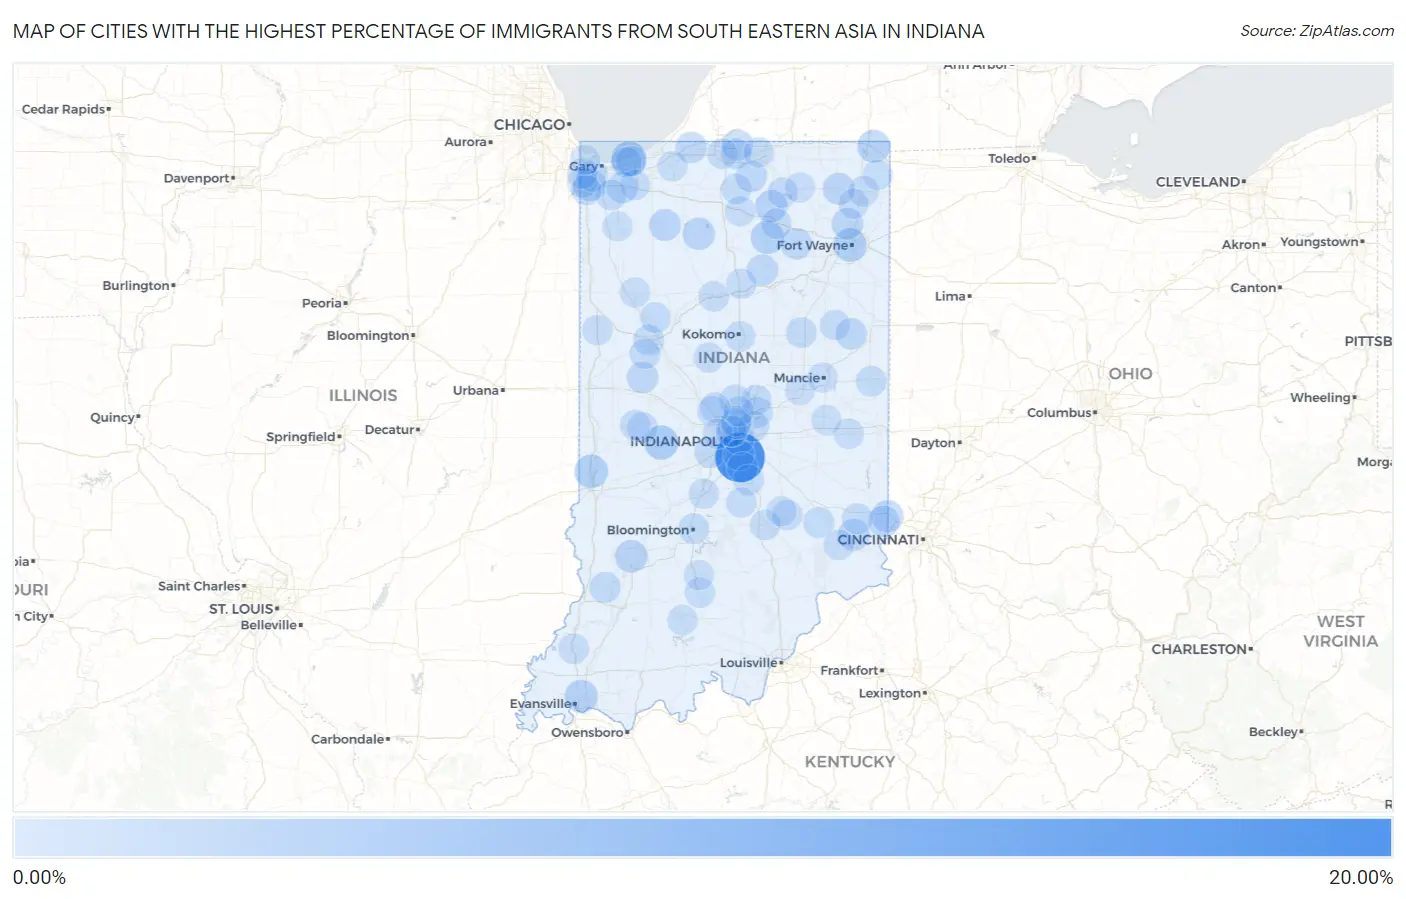
Map of Cities with the Highest Percentage of Immigrants from South Eastern Asia in Indiana
0.00%
20.00%
Cities with the Highest Percentage of Immigrants from South Eastern Asia in Indiana
| City | South Eastern Asia | vs State | vs National | |
| 1. | Southport | 19.40% | 0.67%(+18.7)#-1 | 1.30%(+18.1)#0 |
| 2. | Dune Acres | 4.78% | 0.67%(+4.10)#0 | 1.30%(+3.48)#1 |
| 3. | Everton | 4.57% | 0.67%(+3.89)#1 | 1.30%(+3.27)#2 |
| 4. | Bainbridge | 4.22% | 0.67%(+3.55)#2 | 1.30%(+2.93)#3 |
| 5. | Tecumseh | 3.50% | 0.67%(+2.83)#3 | 1.30%(+2.21)#4 |
| 6. | Fort Wayne | 3.47% | 0.67%(+2.79)#4 | 1.30%(+2.17)#5 |
| 7. | Claypool | 3.44% | 0.67%(+2.76)#5 | 1.30%(+2.14)#6 |
| 8. | Lake Bruce | 3.19% | 0.67%(+2.51)#6 | 1.30%(+1.89)#7 |
| 9. | Melody Hill | 2.96% | 0.67%(+2.28)#7 | 1.30%(+1.66)#8 |
| 10. | Fremont | 2.90% | 0.67%(+2.23)#8 | 1.30%(+1.61)#9 |
| 11. | Lyons | 2.62% | 0.67%(+1.94)#9 | 1.30%(+1.32)#10 |
| 12. | Leesburg | 2.44% | 0.67%(+1.77)#10 | 1.30%(+1.15)#11 |
| 13. | Monterey | 2.40% | 0.67%(+1.72)#11 | 1.30%(+1.10)#12 |
| 14. | Schererville | 2.24% | 0.67%(+1.56)#12 | 1.30%(+0.939)#13 |
| 15. | West Harrison | 2.17% | 0.67%(+1.50)#13 | 1.30%(+0.878)#14 |
| 16. | Milan | 2.17% | 0.67%(+1.50)#14 | 1.30%(+0.874)#15 |
| 17. | North Judson | 2.10% | 0.67%(+1.42)#15 | 1.30%(+0.799)#16 |
| 18. | Kendallville | 2.02% | 0.67%(+1.35)#16 | 1.30%(+0.728)#17 |
| 19. | Huntertown | 1.80% | 0.67%(+1.13)#17 | 1.30%(+0.508)#18 |
| 20. | New Richmond | 1.72% | 0.67%(+1.05)#18 | 1.30%(+0.424)#19 |
| 21. | South Whitley | 1.65% | 0.67%(+0.975)#19 | 1.30%(+0.353)#20 |
| 22. | Wakarusa | 1.65% | 0.67%(+0.974)#20 | 1.30%(+0.352)#21 |
| 23. | Indianapolis | 1.62% | 0.67%(+0.942)#21 | 1.30%(+0.320)#397 |
| 24. | Pennville | 1.61% | 0.67%(+0.936)#22 | 1.30%(+0.314)#398 |
| 25. | Hudson Lake | 1.61% | 0.67%(+0.932)#23 | 1.30%(+0.310)#399 |
| 26. | Shorewood Forest | 1.56% | 0.67%(+0.881)#24 | 1.30%(+0.259)#400 |
| 27. | Roann | 1.49% | 0.67%(+0.811)#25 | 1.30%(+0.189)#401 |
| 28. | Granger | 1.48% | 0.67%(+0.805)#26 | 1.30%(+0.183)#402 |
| 29. | Bright | 1.47% | 0.67%(+0.794)#27 | 1.30%(+0.172)#403 |
| 30. | Spring Hill | 1.39% | 0.67%(+0.715)#28 | 1.30%(+0.093)#404 |
| 31. | Floyds Knobs | 1.36% | 0.67%(+0.681)#29 | 1.30%(+0.059)#405 |
| 32. | Plainfield | 1.34% | 0.67%(+0.666)#30 | 1.30%(+0.044)#406 |
| 33. | Bicknell | 1.31% | 0.67%(+0.639)#31 | 1.30%(+0.017)#407 |
| 34. | Westfield | 1.18% | 0.67%(+0.507)#32 | 1.30%(-0.115)#408 |
| 35. | Griffith | 1.17% | 0.67%(+0.494)#33 | 1.30%(-0.128)#409 |
| 36. | Millhousen | 1.12% | 0.67%(+0.449)#34 | 1.30%(-0.173)#410 |
| 37. | Fishers | 1.10% | 0.67%(+0.423)#35 | 1.30%(-0.199)#411 |
| 38. | Sunman | 1.09% | 0.67%(+0.418)#36 | 1.30%(-0.204)#412 |
| 39. | West Lafayette | 1.09% | 0.67%(+0.414)#37 | 1.30%(-0.209)#413 |
| 40. | Homecroft | 1.09% | 0.67%(+0.411)#38 | 1.30%(-0.211)#414 |
| 41. | Gas City | 1.08% | 0.67%(+0.408)#39 | 1.30%(-0.214)#415 |
| 42. | Franklin | 0.99% | 0.67%(+0.311)#40 | 1.30%(-0.311)#416 |
| 43. | Lawrence | 0.97% | 0.67%(+0.295)#41 | 1.30%(-0.327)#417 |
| 44. | Bloomington | 0.93% | 0.67%(+0.257)#42 | 1.30%(-0.365)#418 |
| 45. | Winchester | 0.92% | 0.67%(+0.250)#43 | 1.30%(-0.372)#419 |
| 46. | Wynnedale | 0.92% | 0.67%(+0.243)#44 | 1.30%(-0.379)#420 |
| 47. | Winfield | 0.89% | 0.67%(+0.212)#45 | 1.30%(-0.410)#421 |
| 48. | Brookston | 0.85% | 0.67%(+0.179)#46 | 1.30%(-0.443)#422 |
| 49. | Greenwood | 0.84% | 0.67%(+0.169)#47 | 1.30%(-0.453)#423 |
| 50. | Mishawaka | 0.82% | 0.67%(+0.143)#48 | 1.30%(-0.479)#424 |
| 51. | Meridian Hills | 0.80% | 0.67%(+0.128)#49 | 1.30%(-0.494)#425 |
| 52. | Waterloo | 0.80% | 0.67%(+0.122)#50 | 1.30%(-0.500)#426 |
| 53. | Columbus | 0.79% | 0.67%(+0.120)#51 | 1.30%(-0.503)#427 |
| 54. | Logansport | 0.79% | 0.67%(+0.118)#52 | 1.30%(-0.504)#428 |
| 55. | Kokomo | 0.79% | 0.67%(+0.117)#53 | 1.30%(-0.505)#429 |
| 56. | Whitestown | 0.78% | 0.67%(+0.106)#54 | 1.30%(-0.516)#430 |
| 57. | Winona Lake | 0.77% | 0.67%(+0.094)#55 | 1.30%(-0.528)#431 |
| 58. | Russellville | 0.77% | 0.67%(+0.093)#56 | 1.30%(-0.529)#432 |
| 59. | Montpelier | 0.75% | 0.67%(+0.074)#57 | 1.30%(-0.548)#433 |
| 60. | Cambridge City | 0.75% | 0.67%(+0.071)#58 | 1.30%(-0.551)#434 |
| 61. | Shadeland | 0.72% | 0.67%(+0.043)#59 | 1.30%(-0.579)#435 |
| 62. | Dyer | 0.71% | 0.67%(+0.039)#60 | 1.30%(-0.583)#436 |
| 63. | Bremen | 0.71% | 0.67%(+0.033)#61 | 1.30%(-0.589)#437 |
| 64. | Burns Harbor | 0.71% | 0.67%(+0.031)#62 | 1.30%(-0.591)#438 |
| 65. | Hartsville | 0.69% | 0.67%(+0.018)#63 | 1.30%(-0.604)#439 |
| 66. | South Bend | 0.69% | 0.67%(+0.015)#64 | 1.30%(-0.608)#440 |
| 67. | Valparaiso | 0.68% | 0.67%(+0.005)#65 | 1.30%(-0.617)#441 |
| 68. | Porter | 0.67% | 0.67%(-0.002)#66 | 1.30%(-0.624)#442 |
| 69. | Williams Creek | 0.67% | 0.67%(-0.008)#67 | 1.30%(-0.630)#443 |
| 70. | Noblesville | 0.66% | 0.67%(-0.011)#68 | 1.30%(-0.633)#444 |
| 71. | Princeton | 0.66% | 0.67%(-0.015)#69 | 1.30%(-0.637)#445 |
| 72. | Versailles | 0.66% | 0.67%(-0.016)#70 | 1.30%(-0.638)#446 |
| 73. | Munster | 0.65% | 0.67%(-0.021)#71 | 1.30%(-0.643)#447 |
| 74. | St John | 0.65% | 0.67%(-0.028)#72 | 1.30%(-0.650)#448 |
| 75. | Mitchell | 0.58% | 0.67%(-0.092)#73 | 1.30%(-0.714)#449 |
| 76. | Boswell | 0.57% | 0.67%(-0.100)#74 | 1.30%(-0.722)#450 |
| 77. | French Lick | 0.57% | 0.67%(-0.103)#75 | 1.30%(-0.726)#451 |
| 78. | Wolcott | 0.55% | 0.67%(-0.121)#76 | 1.30%(-0.743)#452 |
| 79. | Prince S Lakes | 0.55% | 0.67%(-0.126)#77 | 1.30%(-0.748)#453 |
| 80. | Mexico | 0.53% | 0.67%(-0.142)#78 | 1.30%(-0.764)#454 |
| 81. | Michigantown | 0.53% | 0.67%(-0.144)#79 | 1.30%(-0.766)#455 |
| 82. | Martinsville | 0.53% | 0.67%(-0.146)#80 | 1.30%(-0.768)#456 |
| 83. | Carmel | 0.52% | 0.67%(-0.156)#81 | 1.30%(-0.778)#457 |
| 84. | Bourbon | 0.52% | 0.67%(-0.159)#82 | 1.30%(-0.781)#458 |
| 85. | Waveland | 0.51% | 0.67%(-0.160)#83 | 1.30%(-0.782)#459 |
| 86. | Zionsville | 0.50% | 0.67%(-0.172)#84 | 1.30%(-0.794)#460 |
| 87. | Syracuse | 0.49% | 0.67%(-0.187)#85 | 1.30%(-0.809)#461 |
| 88. | Hamilton | 0.47% | 0.67%(-0.202)#86 | 1.30%(-0.824)#462 |
| 89. | La Porte | 0.46% | 0.67%(-0.210)#87 | 1.30%(-0.832)#463 |
| 90. | Chesterfield | 0.46% | 0.67%(-0.211)#88 | 1.30%(-0.833)#464 |
| 91. | Muncie | 0.46% | 0.67%(-0.212)#89 | 1.30%(-0.834)#465 |
| 92. | Garrett | 0.44% | 0.67%(-0.239)#90 | 1.30%(-0.861)#466 |
| 93. | Bedford | 0.43% | 0.67%(-0.240)#91 | 1.30%(-0.862)#467 |
| 94. | Clermont | 0.43% | 0.67%(-0.243)#92 | 1.30%(-0.865)#468 |
| 95. | Hope | 0.42% | 0.67%(-0.254)#93 | 1.30%(-0.876)#469 |
| 96. | Elkhart | 0.41% | 0.67%(-0.260)#94 | 1.30%(-0.882)#470 |
| 97. | Hammond | 0.41% | 0.67%(-0.261)#95 | 1.30%(-0.883)#471 |
| 98. | New Castle | 0.41% | 0.67%(-0.261)#96 | 1.30%(-0.883)#472 |
| 99. | Ligonier | 0.41% | 0.67%(-0.265)#97 | 1.30%(-0.887)#473 |
| 100. | De Motte | 0.41% | 0.67%(-0.268)#98 | 1.30%(-0.890)#474 |
Common Questions
What are the Top 10 Cities with the Highest Percentage of Immigrants from South Eastern Asia in Indiana?
Top 10 Cities with the Highest Percentage of Immigrants from South Eastern Asia in Indiana are:
#1
19.40%
#2
4.78%
#3
4.22%
#4
3.50%
#5
3.47%
#6
3.44%
#7
2.96%
#8
2.90%
#9
2.62%
#10
2.44%
What city has the Highest Percentage of Immigrants from South Eastern Asia in Indiana?
Southport has the Highest Percentage of Immigrants from South Eastern Asia in Indiana with 19.40%.
What is the Percentage of Immigrants from South Eastern Asia in the State of Indiana?
Percentage of Immigrants from South Eastern Asia in Indiana is 0.67%.
What is the Percentage of Immigrants from South Eastern Asia in the United States?
Percentage of Immigrants from South Eastern Asia in the United States is 1.30%.