Cities with the Highest Percentage of Immigrants from Colombia in Illinois
RELATED REPORTS & OPTIONS
Colombia
Illinois
Compare Cities
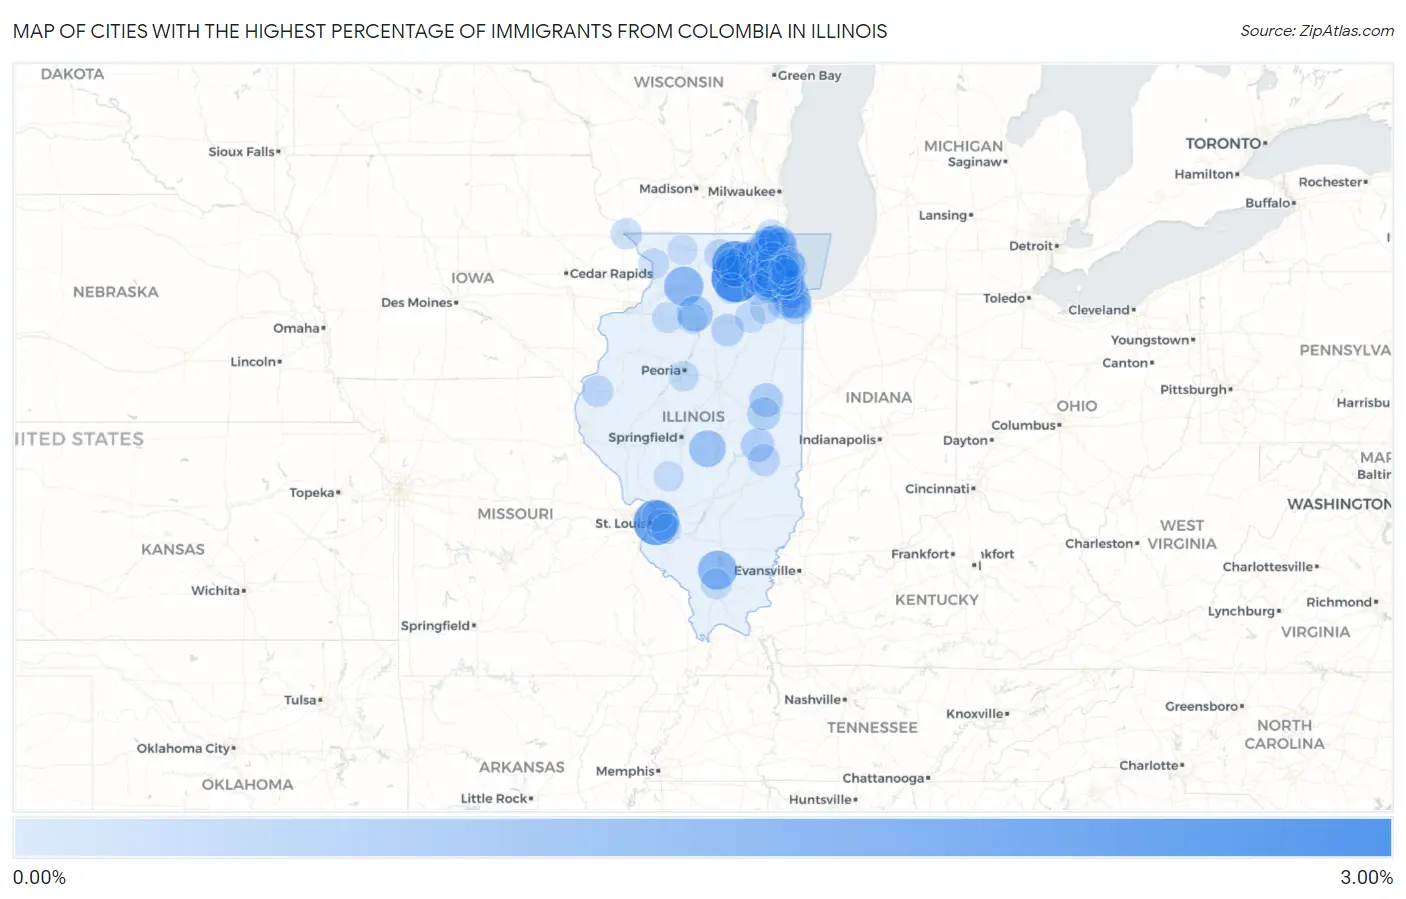
Map of Cities with the Highest Percentage of Immigrants from Colombia in Illinois
0.00%
3.00%
Cities with the Highest Percentage of Immigrants from Colombia in Illinois
| City | Colombia | vs State | vs National | |
| 1. | Cortland | 3.00% | 0.13%(+2.87)#-1 | 0.26%(+2.74)#0 |
| 2. | Genoa | 2.40% | 0.13%(+2.27)#0 | 0.26%(+2.14)#1 |
| 3. | Washington Park | 2.37% | 0.13%(+2.24)#1 | 0.26%(+2.11)#2 |
| 4. | River Grove | 1.79% | 0.13%(+1.66)#2 | 0.26%(+1.53)#3 |
| 5. | Hampshire | 1.68% | 0.13%(+1.55)#3 | 0.26%(+1.42)#4 |
| 6. | Nelson | 1.47% | 0.13%(+1.34)#4 | 0.26%(+1.21)#5 |
| 7. | Buckner | 1.43% | 0.13%(+1.30)#5 | 0.26%(+1.17)#6 |
| 8. | Oakbrook Terrace | 1.26% | 0.13%(+1.13)#6 | 0.26%(+1.00)#7 |
| 9. | Posen | 1.12% | 0.13%(+0.991)#7 | 0.26%(+0.861)#8 |
| 10. | Elmwood Park | 1.11% | 0.13%(+0.982)#85 | 0.26%(+0.852)#2,929 |
| 11. | Stonington | 1.10% | 0.13%(+0.969)#86 | 0.26%(+0.839)#2,930 |
| 12. | Dover | 0.93% | 0.13%(+0.805)#87 | 0.26%(+0.675)#2,931 |
| 13. | Carol Stream | 0.93% | 0.13%(+0.803)#88 | 0.26%(+0.673)#2,932 |
| 14. | Burbank | 0.90% | 0.13%(+0.773)#89 | 0.26%(+0.643)#2,933 |
| 15. | Rosemont | 0.78% | 0.13%(+0.647)#90 | 0.26%(+0.516)#2,934 |
| 16. | Indian Head Park | 0.77% | 0.13%(+0.641)#91 | 0.26%(+0.511)#2,935 |
| 17. | Schiller Park | 0.75% | 0.13%(+0.620)#92 | 0.26%(+0.490)#2,936 |
| 18. | Rantoul | 0.66% | 0.13%(+0.532)#93 | 0.26%(+0.402)#2,937 |
| 19. | Melrose Park | 0.64% | 0.13%(+0.506)#94 | 0.26%(+0.376)#2,938 |
| 20. | Arcola | 0.62% | 0.13%(+0.494)#95 | 0.26%(+0.364)#2,939 |
| 21. | Elk Grove Village | 0.60% | 0.13%(+0.467)#96 | 0.26%(+0.337)#2,940 |
| 22. | Third Lake | 0.58% | 0.13%(+0.447)#97 | 0.26%(+0.317)#2,941 |
| 23. | Orland Hills | 0.57% | 0.13%(+0.440)#98 | 0.26%(+0.310)#2,942 |
| 24. | Urbana | 0.56% | 0.13%(+0.430)#99 | 0.26%(+0.300)#2,943 |
| 25. | Villa Park | 0.51% | 0.13%(+0.380)#100 | 0.26%(+0.250)#2,996 |
| 26. | Grand Ridge | 0.51% | 0.13%(+0.376)#101 | 0.26%(+0.246)#2,997 |
| 27. | West Chicago | 0.49% | 0.13%(+0.362)#102 | 0.26%(+0.232)#2,998 |
| 28. | Glendale Heights | 0.47% | 0.13%(+0.345)#103 | 0.26%(+0.215)#3,178 |
| 29. | Gurnee | 0.47% | 0.13%(+0.340)#104 | 0.26%(+0.210)#3,179 |
| 30. | Lake In The Hills | 0.46% | 0.13%(+0.330)#105 | 0.26%(+0.199)#3,180 |
| 31. | Port Barrington | 0.45% | 0.13%(+0.320)#106 | 0.26%(+0.190)#3,181 |
| 32. | East Dundee | 0.44% | 0.13%(+0.314)#107 | 0.26%(+0.183)#3,182 |
| 33. | Elgin | 0.42% | 0.13%(+0.292)#108 | 0.26%(+0.162)#3,183 |
| 34. | Cicero | 0.42% | 0.13%(+0.291)#109 | 0.26%(+0.161)#3,184 |
| 35. | Evergreen Park | 0.41% | 0.13%(+0.281)#110 | 0.26%(+0.151)#3,185 |
| 36. | Crystal Lake | 0.40% | 0.13%(+0.271)#111 | 0.26%(+0.140)#3,186 |
| 37. | South Elgin | 0.40% | 0.13%(+0.269)#112 | 0.26%(+0.138)#3,187 |
| 38. | La Grange | 0.40% | 0.13%(+0.267)#113 | 0.26%(+0.137)#3,188 |
| 39. | Hinsdale | 0.39% | 0.13%(+0.260)#114 | 0.26%(+0.130)#3,189 |
| 40. | Charleston | 0.39% | 0.13%(+0.258)#115 | 0.26%(+0.128)#3,190 |
| 41. | Bannockburn | 0.38% | 0.13%(+0.246)#116 | 0.26%(+0.116)#3,191 |
| 42. | Sycamore | 0.37% | 0.13%(+0.244)#117 | 0.26%(+0.114)#3,192 |
| 43. | Round Lake | 0.36% | 0.13%(+0.234)#118 | 0.26%(+0.104)#3,193 |
| 44. | Carthage | 0.35% | 0.13%(+0.222)#119 | 0.26%(+0.092)#3,194 |
| 45. | Long Lake | 0.34% | 0.13%(+0.211)#120 | 0.26%(+0.080)#3,195 |
| 46. | St Charles | 0.34% | 0.13%(+0.209)#121 | 0.26%(+0.079)#3,196 |
| 47. | Round Lake Beach | 0.34% | 0.13%(+0.208)#122 | 0.26%(+0.078)#3,197 |
| 48. | Buffalo Grove | 0.32% | 0.13%(+0.192)#123 | 0.26%(+0.061)#3,198 |
| 49. | Streamwood | 0.32% | 0.13%(+0.189)#124 | 0.26%(+0.059)#3,199 |
| 50. | Hainesville | 0.31% | 0.13%(+0.180)#125 | 0.26%(+0.050)#3,200 |
| 51. | East Dubuque | 0.31% | 0.13%(+0.176)#126 | 0.26%(+0.046)#3,201 |
| 52. | Cherry Valley | 0.30% | 0.13%(+0.175)#127 | 0.26%(+0.045)#3,202 |
| 53. | Berwyn | 0.30% | 0.13%(+0.166)#128 | 0.26%(+0.035)#3,203 |
| 54. | Franklin Park | 0.29% | 0.13%(+0.164)#129 | 0.26%(+0.034)#3,204 |
| 55. | Fairview Heights | 0.29% | 0.13%(+0.164)#130 | 0.26%(+0.033)#3,205 |
| 56. | Countryside | 0.28% | 0.13%(+0.155)#131 | 0.26%(+0.025)#3,206 |
| 57. | North Chicago | 0.28% | 0.13%(+0.149)#132 | 0.26%(+0.018)#3,207 |
| 58. | Thornton | 0.28% | 0.13%(+0.147)#133 | 0.26%(+0.017)#3,208 |
| 59. | Des Plaines | 0.27% | 0.13%(+0.145)#134 | 0.26%(+0.015)#3,209 |
| 60. | Chicago Heights | 0.27% | 0.13%(+0.141)#135 | 0.26%(+0.010)#3,210 |
| 61. | Hanover Park | 0.27% | 0.13%(+0.139)#136 | 0.26%(+0.009)#3,211 |
| 62. | Antioch | 0.27% | 0.13%(+0.135)#137 | 0.26%(+0.005)#3,212 |
| 63. | Pontoon Beach | 0.26% | 0.13%(+0.135)#138 | 0.26%(+0.005)#3,213 |
| 64. | Herrin | 0.26% | 0.13%(+0.129)#139 | 0.26%(-0.001)#3,214 |
| 65. | Annawan | 0.25% | 0.13%(+0.123)#140 | 0.26%(-0.007)#3,215 |
| 66. | Savanna | 0.25% | 0.13%(+0.122)#141 | 0.26%(-0.008)#3,216 |
| 67. | Lisle | 0.25% | 0.13%(+0.121)#142 | 0.26%(-0.009)#3,217 |
| 68. | Maywood | 0.25% | 0.13%(+0.118)#143 | 0.26%(-0.012)#3,218 |
| 69. | Tower Lakes | 0.23% | 0.13%(+0.104)#144 | 0.26%(-0.026)#3,219 |
| 70. | Hoffman Estates | 0.23% | 0.13%(+0.102)#145 | 0.26%(-0.028)#3,220 |
| 71. | Oak Park | 0.23% | 0.13%(+0.101)#146 | 0.26%(-0.030)#3,221 |
| 72. | Waukegan | 0.23% | 0.13%(+0.097)#147 | 0.26%(-0.033)#3,222 |
| 73. | Bensenville | 0.22% | 0.13%(+0.095)#148 | 0.26%(-0.035)#3,223 |
| 74. | Morris | 0.22% | 0.13%(+0.091)#149 | 0.26%(-0.039)#3,224 |
| 75. | Kingston | 0.22% | 0.13%(+0.091)#150 | 0.26%(-0.040)#3,225 |
| 76. | Chicago | 0.22% | 0.13%(+0.089)#151 | 0.26%(-0.042)#3,226 |
| 77. | Riverside | 0.22% | 0.13%(+0.087)#152 | 0.26%(-0.043)#3,227 |
| 78. | Palatine | 0.20% | 0.13%(+0.073)#153 | 0.26%(-0.058)#3,228 |
| 79. | Waterman | 0.20% | 0.13%(+0.069)#154 | 0.26%(-0.061)#3,229 |
| 80. | Lakemoor | 0.20% | 0.13%(+0.066)#155 | 0.26%(-0.064)#3,230 |
| 81. | Lindenhurst | 0.19% | 0.13%(+0.065)#156 | 0.26%(-0.066)#3,231 |
| 82. | Princeton | 0.19% | 0.13%(+0.064)#157 | 0.26%(-0.066)#3,232 |
| 83. | Marquette Heights | 0.19% | 0.13%(+0.057)#158 | 0.26%(-0.073)#3,233 |
| 84. | Warrenville | 0.19% | 0.13%(+0.057)#159 | 0.26%(-0.074)#3,234 |
| 85. | River Forest | 0.18% | 0.13%(+0.052)#160 | 0.26%(-0.078)#3,235 |
| 86. | Evanston | 0.18% | 0.13%(+0.049)#161 | 0.26%(-0.081)#3,236 |
| 87. | Joliet | 0.18% | 0.13%(+0.048)#162 | 0.26%(-0.082)#3,237 |
| 88. | Aurora | 0.18% | 0.13%(+0.047)#163 | 0.26%(-0.083)#3,238 |
| 89. | Carlinville | 0.17% | 0.13%(+0.045)#164 | 0.26%(-0.085)#3,239 |
| 90. | Wilmette | 0.17% | 0.13%(+0.043)#165 | 0.26%(-0.087)#3,240 |
| 91. | Wheaton | 0.17% | 0.13%(+0.042)#166 | 0.26%(-0.089)#3,241 |
| 92. | Glenview | 0.17% | 0.13%(+0.041)#167 | 0.26%(-0.089)#3,242 |
| 93. | Niles | 0.17% | 0.13%(+0.040)#168 | 0.26%(-0.090)#3,243 |
| 94. | Kildeer | 0.17% | 0.13%(+0.040)#169 | 0.26%(-0.091)#3,244 |
| 95. | Winnetka | 0.17% | 0.13%(+0.037)#170 | 0.26%(-0.093)#3,245 |
| 96. | Bloomingdale | 0.16% | 0.13%(+0.031)#171 | 0.26%(-0.100)#3,246 |
| 97. | Shiloh | 0.16% | 0.13%(+0.029)#172 | 0.26%(-0.102)#3,247 |
| 98. | Harwood Heights | 0.16% | 0.13%(+0.027)#173 | 0.26%(-0.103)#3,248 |
| 99. | Park Ridge | 0.15% | 0.13%(+0.025)#174 | 0.26%(-0.105)#3,249 |
| 100. | Freeport | 0.15% | 0.13%(+0.025)#175 | 0.26%(-0.105)#3,250 |
Common Questions
What are the Top 10 Cities with the Highest Percentage of Immigrants from Colombia in Illinois?
Top 10 Cities with the Highest Percentage of Immigrants from Colombia in Illinois are:
#1
3.00%
#2
2.40%
#3
2.37%
#4
1.79%
#5
1.68%
#6
1.47%
#7
1.43%
#8
1.26%
#9
1.12%
#10
1.11%
What city has the Highest Percentage of Immigrants from Colombia in Illinois?
Cortland has the Highest Percentage of Immigrants from Colombia in Illinois with 3.00%.
What is the Percentage of Immigrants from Colombia in the State of Illinois?
Percentage of Immigrants from Colombia in Illinois is 0.13%.
What is the Percentage of Immigrants from Colombia in the United States?
Percentage of Immigrants from Colombia in the United States is 0.26%.