Cities with the Highest Percentage of Immigrants from England in Illinois
RELATED REPORTS & OPTIONS
England
Illinois
Compare Cities
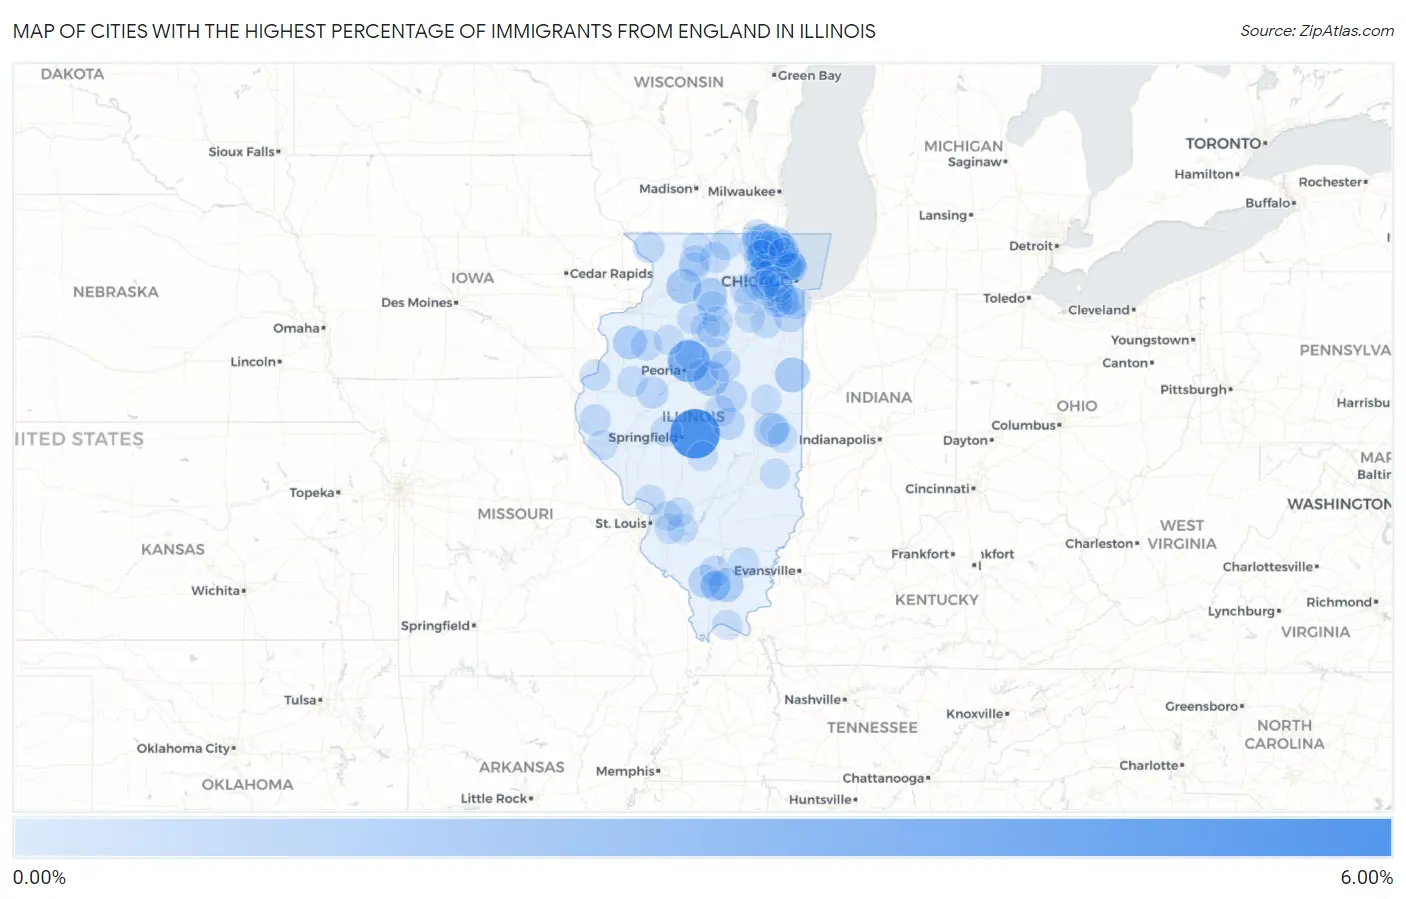
Map of Cities with the Highest Percentage of Immigrants from England in Illinois
0.00%
6.00%
Cities with the Highest Percentage of Immigrants from England in Illinois
| City | England | vs State | vs National | |
| 1. | Buffalo | 5.79% | 0.067%(+5.73)#1 | 0.096%(+5.70)#25 |
| 2. | Bay View Gardens | 3.51% | 0.067%(+3.44)#2 | 0.096%(+3.41)#65 |
| 3. | Tower Lakes | 2.11% | 0.067%(+2.04)#3 | 0.096%(+2.01)#139 |
| 4. | Carlock | 1.54% | 0.067%(+1.47)#4 | 0.096%(+1.44)#229 |
| 5. | Nelson | 1.47% | 0.067%(+1.40)#5 | 0.096%(+1.37)#244 |
| 6. | Milford | 1.44% | 0.067%(+1.38)#6 | 0.096%(+1.35)#247 |
| 7. | West Brooklyn | 1.31% | 0.067%(+1.24)#7 | 0.096%(+1.21)#282 |
| 8. | Forest Lake | 1.26% | 0.067%(+1.20)#8 | 0.096%(+1.17)#294 |
| 9. | Pittsburg | 1.26% | 0.067%(+1.19)#9 | 0.096%(+1.17)#295 |
| 10. | Longview | 1.22% | 0.067%(+1.15)#10 | 0.096%(+1.12)#307 |
| 11. | Alexis | 1.12% | 0.067%(+1.05)#11 | 0.096%(+1.02)#343 |
| 12. | Lake Barrington | 1.06% | 0.067%(+0.993)#12 | 0.096%(+0.964)#369 |
| 13. | De Soto | 0.89% | 0.067%(+0.824)#13 | 0.096%(+0.794)#481 |
| 14. | Green Oaks | 0.88% | 0.067%(+0.812)#14 | 0.096%(+0.783)#488 |
| 15. | Trout Valley | 0.84% | 0.067%(+0.776)#15 | 0.096%(+0.747)#526 |
| 16. | Pistakee Highlands | 0.82% | 0.067%(+0.753)#16 | 0.096%(+0.724)#551 |
| 17. | Long Grove | 0.80% | 0.067%(+0.730)#17 | 0.096%(+0.701)#573 |
| 18. | Palos Park | 0.77% | 0.067%(+0.698)#18 | 0.096%(+0.669)#607 |
| 19. | Westlake | 0.76% | 0.067%(+0.694)#19 | 0.096%(+0.664)#612 |
| 20. | Lewistown | 0.72% | 0.067%(+0.655)#20 | 0.096%(+0.626)#650 |
| 21. | Tonica | 0.72% | 0.067%(+0.649)#21 | 0.096%(+0.620)#655 |
| 22. | Argenta | 0.67% | 0.067%(+0.600)#22 | 0.096%(+0.570)#710 |
| 23. | Mettawa | 0.67% | 0.067%(+0.599)#23 | 0.096%(+0.569)#712 |
| 24. | Monee | 0.66% | 0.067%(+0.597)#24 | 0.096%(+0.568)#715 |
| 25. | Goodfield | 0.66% | 0.067%(+0.595)#25 | 0.096%(+0.566)#718 |
| 26. | Le Roy | 0.62% | 0.067%(+0.554)#26 | 0.096%(+0.524)#777 |
| 27. | Inverness | 0.57% | 0.067%(+0.503)#27 | 0.096%(+0.473)#862 |
| 28. | Winnetka | 0.56% | 0.067%(+0.496)#28 | 0.096%(+0.467)#873 |
| 29. | Kildeer | 0.53% | 0.067%(+0.465)#29 | 0.096%(+0.436)#933 |
| 30. | Wataga | 0.52% | 0.067%(+0.456)#30 | 0.096%(+0.427)#957 |
| 31. | Coatsburg | 0.51% | 0.067%(+0.438)#31 | 0.096%(+0.409)#995 |
| 32. | Gridley | 0.49% | 0.067%(+0.426)#32 | 0.096%(+0.397)#1,012 |
| 33. | Elizabeth | 0.49% | 0.067%(+0.423)#33 | 0.096%(+0.394)#1,020 |
| 34. | Orland Hills | 0.47% | 0.067%(+0.401)#34 | 0.096%(+0.371)#1,097 |
| 35. | Clinton | 0.46% | 0.067%(+0.397)#35 | 0.096%(+0.368)#1,103 |
| 36. | South Barrington | 0.46% | 0.067%(+0.393)#36 | 0.096%(+0.364)#1,114 |
| 37. | Leaf River | 0.46% | 0.067%(+0.391)#37 | 0.096%(+0.361)#1,116 |
| 38. | Richmond | 0.44% | 0.067%(+0.374)#38 | 0.096%(+0.345)#1,169 |
| 39. | Lemont | 0.44% | 0.067%(+0.372)#39 | 0.096%(+0.342)#1,178 |
| 40. | Wilmington | 0.42% | 0.067%(+0.349)#40 | 0.096%(+0.320)#1,240 |
| 41. | Wayne | 0.40% | 0.067%(+0.337)#41 | 0.096%(+0.308)#1,282 |
| 42. | Pleasant Plains | 0.40% | 0.067%(+0.335)#42 | 0.096%(+0.305)#1,291 |
| 43. | Christopher | 0.40% | 0.067%(+0.332)#43 | 0.096%(+0.303)#1,303 |
| 44. | Burr Ridge | 0.40% | 0.067%(+0.328)#44 | 0.096%(+0.299)#1,314 |
| 45. | New Milford | 0.39% | 0.067%(+0.326)#45 | 0.096%(+0.297)#1,324 |
| 46. | Ringwood | 0.39% | 0.067%(+0.318)#46 | 0.096%(+0.289)#1,354 |
| 47. | Batavia | 0.38% | 0.067%(+0.316)#47 | 0.096%(+0.287)#1,359 |
| 48. | Chillicothe | 0.38% | 0.067%(+0.308)#48 | 0.096%(+0.279)#1,395 |
| 49. | Thornton | 0.37% | 0.067%(+0.302)#49 | 0.096%(+0.273)#1,424 |
| 50. | Princeton | 0.36% | 0.067%(+0.294)#50 | 0.096%(+0.265)#1,453 |
| 51. | Bloomingdale | 0.36% | 0.067%(+0.294)#51 | 0.096%(+0.265)#1,454 |
| 52. | Dallas City | 0.35% | 0.067%(+0.288)#52 | 0.096%(+0.258)#1,477 |
| 53. | Timberlane | 0.34% | 0.067%(+0.276)#53 | 0.096%(+0.247)#1,517 |
| 54. | Broadlands | 0.34% | 0.067%(+0.272)#54 | 0.096%(+0.243)#1,532 |
| 55. | Energy | 0.33% | 0.067%(+0.259)#55 | 0.096%(+0.230)#1,592 |
| 56. | Bull Valley | 0.32% | 0.067%(+0.253)#56 | 0.096%(+0.224)#1,622 |
| 57. | Skokie | 0.32% | 0.067%(+0.252)#57 | 0.096%(+0.223)#1,629 |
| 58. | Bushnell | 0.32% | 0.067%(+0.249)#58 | 0.096%(+0.219)#1,649 |
| 59. | Kenilworth | 0.32% | 0.067%(+0.248)#59 | 0.096%(+0.219)#1,651 |
| 60. | Mendota | 0.30% | 0.067%(+0.235)#60 | 0.096%(+0.205)#1,719 |
| 61. | Joppa | 0.30% | 0.067%(+0.233)#61 | 0.096%(+0.204)#1,732 |
| 62. | Rantoul | 0.29% | 0.067%(+0.228)#62 | 0.096%(+0.199)#1,751 |
| 63. | Albers | 0.28% | 0.067%(+0.209)#63 | 0.096%(+0.180)#1,866 |
| 64. | Naperville | 0.27% | 0.067%(+0.199)#64 | 0.096%(+0.169)#1,939 |
| 65. | North Utica | 0.26% | 0.067%(+0.197)#65 | 0.096%(+0.168)#1,946 |
| 66. | Casey | 0.26% | 0.067%(+0.195)#66 | 0.096%(+0.165)#1,955 |
| 67. | Mcleansboro | 0.25% | 0.067%(+0.184)#67 | 0.096%(+0.154)#2,047 |
| 68. | Wilmette | 0.25% | 0.067%(+0.181)#68 | 0.096%(+0.152)#2,057 |
| 69. | Gurnee | 0.25% | 0.067%(+0.181)#69 | 0.096%(+0.152)#2,059 |
| 70. | Godfrey | 0.25% | 0.067%(+0.180)#70 | 0.096%(+0.151)#2,063 |
| 71. | Big Rock | 0.25% | 0.067%(+0.179)#71 | 0.096%(+0.149)#2,075 |
| 72. | Wheaton | 0.24% | 0.067%(+0.173)#72 | 0.096%(+0.144)#2,099 |
| 73. | Evanston | 0.22% | 0.067%(+0.153)#73 | 0.096%(+0.124)#2,256 |
| 74. | Toulon | 0.22% | 0.067%(+0.152)#74 | 0.096%(+0.123)#2,267 |
| 75. | Hume | 0.21% | 0.067%(+0.148)#75 | 0.096%(+0.118)#2,312 |
| 76. | Fox Lake | 0.21% | 0.067%(+0.146)#76 | 0.096%(+0.117)#2,324 |
| 77. | Mount Morris | 0.21% | 0.067%(+0.143)#77 | 0.096%(+0.114)#2,351 |
| 78. | Crainville | 0.21% | 0.067%(+0.141)#78 | 0.096%(+0.112)#2,369 |
| 79. | Granville | 0.20% | 0.067%(+0.137)#79 | 0.096%(+0.107)#2,411 |
| 80. | Minonk | 0.20% | 0.067%(+0.136)#80 | 0.096%(+0.107)#2,412 |
| 81. | Lake Bluff | 0.20% | 0.067%(+0.136)#81 | 0.096%(+0.106)#2,416 |
| 82. | Scott Afb | 0.20% | 0.067%(+0.132)#82 | 0.096%(+0.103)#2,456 |
| 83. | Barry | 0.20% | 0.067%(+0.129)#83 | 0.096%(+0.100)#2,497 |
| 84. | Streamwood | 0.19% | 0.067%(+0.128)#84 | 0.096%(+0.098)#2,510 |
| 85. | Pecatonica | 0.19% | 0.067%(+0.120)#85 | 0.096%(+0.091)#2,587 |
| 86. | Grandwood Park | 0.19% | 0.067%(+0.118)#86 | 0.096%(+0.089)#2,597 |
| 87. | Troy | 0.18% | 0.067%(+0.116)#87 | 0.096%(+0.087)#2,619 |
| 88. | Golf | 0.18% | 0.067%(+0.116)#88 | 0.096%(+0.087)#2,620 |
| 89. | Round Lake | 0.18% | 0.067%(+0.115)#89 | 0.096%(+0.086)#2,631 |
| 90. | Yorkville | 0.18% | 0.067%(+0.112)#90 | 0.096%(+0.082)#2,661 |
| 91. | Highland | 0.18% | 0.067%(+0.109)#91 | 0.096%(+0.080)#2,683 |
| 92. | Homer Glen | 0.18% | 0.067%(+0.108)#92 | 0.096%(+0.079)#2,692 |
| 93. | Cary | 0.17% | 0.067%(+0.106)#93 | 0.096%(+0.077)#2,703 |
| 94. | Morris | 0.17% | 0.067%(+0.105)#94 | 0.096%(+0.076)#2,717 |
| 95. | Lombard | 0.17% | 0.067%(+0.103)#95 | 0.096%(+0.074)#2,745 |
| 96. | Hinsdale | 0.17% | 0.067%(+0.102)#96 | 0.096%(+0.073)#2,767 |
| 97. | Warrenville | 0.16% | 0.067%(+0.098)#97 | 0.096%(+0.069)#2,811 |
| 98. | Lake Forest | 0.16% | 0.067%(+0.098)#98 | 0.096%(+0.068)#2,816 |
| 99. | Taylorville | 0.16% | 0.067%(+0.092)#99 | 0.096%(+0.063)#2,873 |
| 100. | Midlothian | 0.15% | 0.067%(+0.088)#100 | 0.096%(+0.059)#2,910 |
Common Questions
What are the Top 10 Cities with the Highest Percentage of Immigrants from England in Illinois?
Top 10 Cities with the Highest Percentage of Immigrants from England in Illinois are:
#1
5.79%
#2
3.51%
#3
2.11%
#4
1.54%
#5
1.47%
#6
1.44%
#7
1.31%
#8
1.26%
#9
1.26%
#10
1.22%
What city has the Highest Percentage of Immigrants from England in Illinois?
Buffalo has the Highest Percentage of Immigrants from England in Illinois with 5.79%.
What is the Percentage of Immigrants from England in the State of Illinois?
Percentage of Immigrants from England in Illinois is 0.067%.
What is the Percentage of Immigrants from England in the United States?
Percentage of Immigrants from England in the United States is 0.096%.