Cities with the Highest Percentage of Immigrants from Africa in Illinois
RELATED REPORTS & OPTIONS
Africa
Illinois
Compare Cities
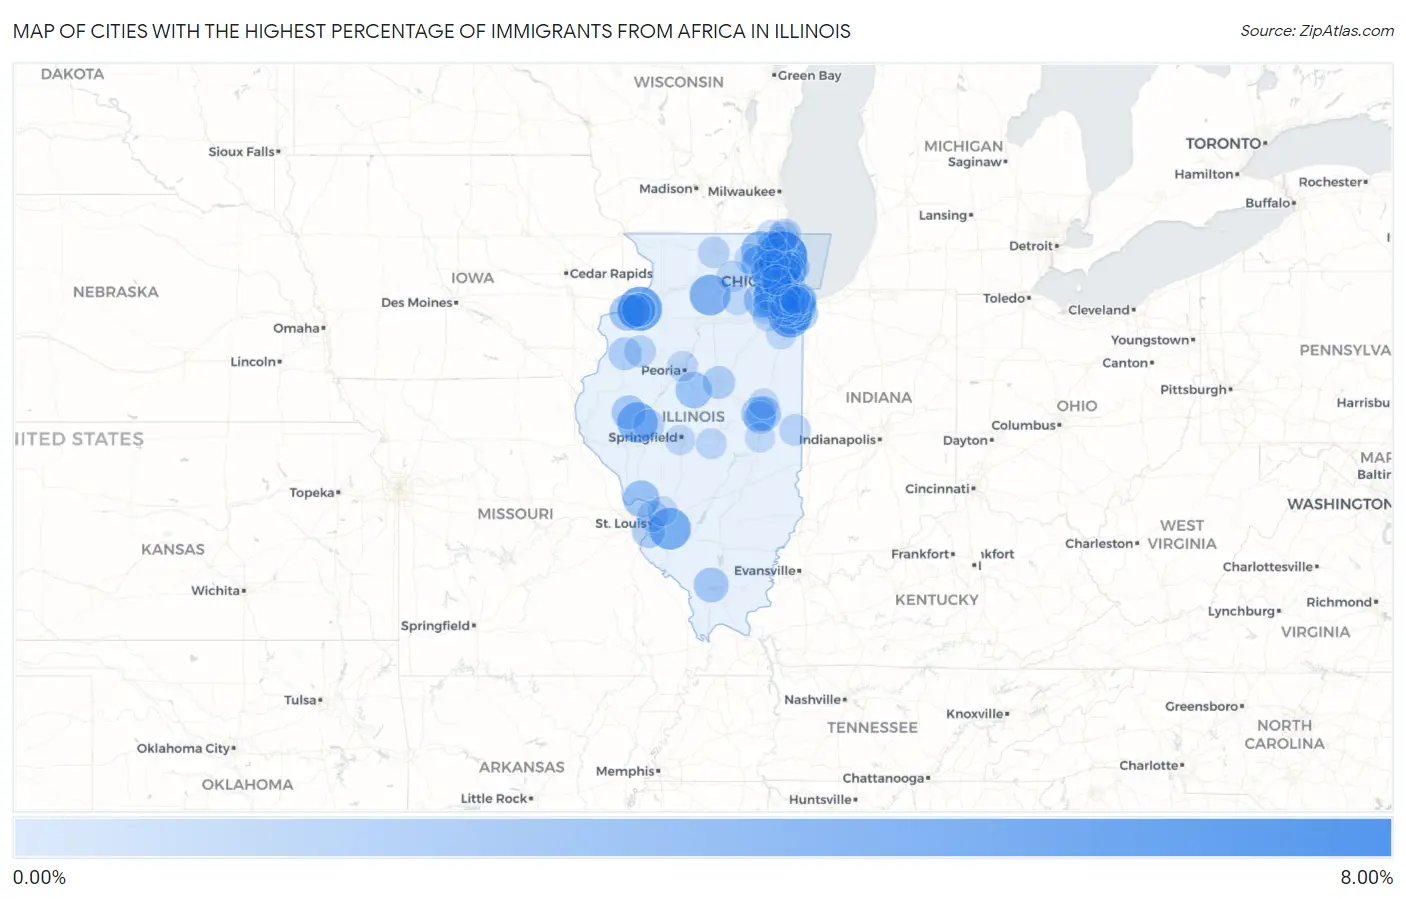
Map of Cities with the Highest Percentage of Immigrants from Africa in Illinois
0.00%
8.00%
Cities with the Highest Percentage of Immigrants from Africa in Illinois
| City | Africa | vs State | vs National | |
| 1. | Bannockburn | 7.89% | 0.62%(+7.27)#-1 | 0.78%(+7.11)#0 |
| 2. | East Moline | 5.85% | 0.62%(+5.23)#0 | 0.78%(+5.07)#1 |
| 3. | Monee | 5.27% | 0.62%(+4.65)#1 | 0.78%(+4.49)#2 |
| 4. | Scott Afb | 4.95% | 0.62%(+4.33)#2 | 0.78%(+4.17)#3 |
| 5. | Hillside | 4.91% | 0.62%(+4.29)#3 | 0.78%(+4.13)#4 |
| 6. | University Park | 4.63% | 0.62%(+4.01)#4 | 0.78%(+3.85)#5 |
| 7. | West Brooklyn | 4.58% | 0.62%(+3.95)#5 | 0.78%(+3.80)#6 |
| 8. | Beardstown | 4.45% | 0.62%(+3.83)#6 | 0.78%(+3.67)#7 |
| 9. | Glendale Heights | 3.61% | 0.62%(+2.99)#7 | 0.78%(+2.84)#8 |
| 10. | Prairie Grove | 3.41% | 0.62%(+2.79)#8 | 0.78%(+2.63)#9 |
| 11. | East Dundee | 3.33% | 0.62%(+2.70)#9 | 0.78%(+2.55)#10 |
| 12. | Berkeley | 3.16% | 0.62%(+2.54)#10 | 0.78%(+2.38)#11 |
| 13. | Elsah | 3.02% | 0.62%(+2.40)#11 | 0.78%(+2.24)#12 |
| 14. | Hopedale | 2.95% | 0.62%(+2.32)#12 | 0.78%(+2.17)#13 |
| 15. | Rock Island | 2.84% | 0.62%(+2.22)#13 | 0.78%(+2.06)#14 |
| 16. | Woodridge | 2.80% | 0.62%(+2.18)#14 | 0.78%(+2.02)#15 |
| 17. | Skokie | 2.54% | 0.62%(+1.91)#29 | 0.78%(+1.76)#483 |
| 18. | Plainfield | 2.53% | 0.62%(+1.91)#30 | 0.78%(+1.75)#484 |
| 19. | Romeoville | 2.49% | 0.62%(+1.87)#31 | 0.78%(+1.71)#485 |
| 20. | Champaign | 2.37% | 0.62%(+1.75)#32 | 0.78%(+1.59)#486 |
| 21. | Cambria | 2.36% | 0.62%(+1.73)#33 | 0.78%(+1.58)#487 |
| 22. | Urbana | 2.32% | 0.62%(+1.70)#34 | 0.78%(+1.54)#488 |
| 23. | South Holland | 2.24% | 0.62%(+1.62)#35 | 0.78%(+1.46)#489 |
| 24. | Rushville | 2.22% | 0.62%(+1.60)#36 | 0.78%(+1.44)#490 |
| 25. | East Hazel Crest | 2.16% | 0.62%(+1.54)#37 | 0.78%(+1.38)#491 |
| 26. | Evanston | 2.13% | 0.62%(+1.51)#38 | 0.78%(+1.35)#492 |
| 27. | Silvis | 2.03% | 0.62%(+1.41)#39 | 0.78%(+1.25)#493 |
| 28. | Carbon Cliff | 1.99% | 0.62%(+1.37)#40 | 0.78%(+1.21)#494 |
| 29. | Willowbrook | 1.97% | 0.62%(+1.35)#41 | 0.78%(+1.19)#495 |
| 30. | Dupo | 1.92% | 0.62%(+1.30)#42 | 0.78%(+1.14)#496 |
| 31. | Moline | 1.84% | 0.62%(+1.22)#43 | 0.78%(+1.06)#497 |
| 32. | Monmouth | 1.76% | 0.62%(+1.14)#44 | 0.78%(+0.978)#498 |
| 33. | Country Club Hills | 1.75% | 0.62%(+1.13)#45 | 0.78%(+0.970)#499 |
| 34. | Richton Park | 1.74% | 0.62%(+1.12)#46 | 0.78%(+0.958)#500 |
| 35. | Normal | 1.69% | 0.62%(+1.07)#47 | 0.78%(+0.910)#501 |
| 36. | Lynwood | 1.67% | 0.62%(+1.05)#48 | 0.78%(+0.893)#502 |
| 37. | Savoy | 1.64% | 0.62%(+1.01)#49 | 0.78%(+0.856)#503 |
| 38. | Calumet City | 1.62% | 0.62%(+1.00)#50 | 0.78%(+0.845)#504 |
| 39. | Winthrop Harbor | 1.54% | 0.62%(+0.918)#51 | 0.78%(+0.760)#505 |
| 40. | Burr Ridge | 1.53% | 0.62%(+0.906)#52 | 0.78%(+0.748)#506 |
| 41. | Lansing | 1.49% | 0.62%(+0.870)#53 | 0.78%(+0.711)#507 |
| 42. | Posen | 1.47% | 0.62%(+0.849)#54 | 0.78%(+0.691)#508 |
| 43. | Lincolnwood | 1.43% | 0.62%(+0.811)#55 | 0.78%(+0.653)#509 |
| 44. | Park Forest | 1.37% | 0.62%(+0.748)#56 | 0.78%(+0.589)#510 |
| 45. | Galesburg | 1.37% | 0.62%(+0.746)#57 | 0.78%(+0.588)#511 |
| 46. | Hazel Crest | 1.34% | 0.62%(+0.719)#58 | 0.78%(+0.560)#512 |
| 47. | Bridgeview | 1.33% | 0.62%(+0.713)#59 | 0.78%(+0.555)#513 |
| 48. | River Grove | 1.29% | 0.62%(+0.670)#60 | 0.78%(+0.512)#514 |
| 49. | Prospect Heights | 1.28% | 0.62%(+0.659)#61 | 0.78%(+0.501)#515 |
| 50. | Madison | 1.23% | 0.62%(+0.612)#62 | 0.78%(+0.453)#516 |
| 51. | Palos Hills | 1.23% | 0.62%(+0.610)#63 | 0.78%(+0.452)#517 |
| 52. | Rockford | 1.22% | 0.62%(+0.595)#64 | 0.78%(+0.436)#518 |
| 53. | Ridge Farm | 1.19% | 0.62%(+0.566)#65 | 0.78%(+0.407)#519 |
| 54. | Calumet Park | 1.18% | 0.62%(+0.561)#66 | 0.78%(+0.402)#520 |
| 55. | Hoffman Estates | 1.18% | 0.62%(+0.554)#67 | 0.78%(+0.396)#521 |
| 56. | Waukegan | 1.16% | 0.62%(+0.534)#68 | 0.78%(+0.376)#522 |
| 57. | Virginia | 1.14% | 0.62%(+0.520)#69 | 0.78%(+0.362)#523 |
| 58. | Matteson | 1.13% | 0.62%(+0.511)#70 | 0.78%(+0.353)#524 |
| 59. | Flossmoor | 1.13% | 0.62%(+0.506)#71 | 0.78%(+0.348)#525 |
| 60. | Dekalb | 1.12% | 0.62%(+0.497)#72 | 0.78%(+0.339)#526 |
| 61. | Golf | 1.10% | 0.62%(+0.478)#73 | 0.78%(+0.320)#527 |
| 62. | Hinsdale | 1.07% | 0.62%(+0.445)#74 | 0.78%(+0.287)#528 |
| 63. | Chicago | 1.03% | 0.62%(+0.409)#75 | 0.78%(+0.250)#529 |
| 64. | Alsip | 1.02% | 0.62%(+0.402)#76 | 0.78%(+0.244)#530 |
| 65. | Schaumburg | 1.02% | 0.62%(+0.400)#77 | 0.78%(+0.242)#531 |
| 66. | Broadview | 0.99% | 0.62%(+0.372)#78 | 0.78%(+0.214)#532 |
| 67. | Worth | 0.97% | 0.62%(+0.346)#79 | 0.78%(+0.188)#533 |
| 68. | Blue Mound | 0.96% | 0.62%(+0.343)#80 | 0.78%(+0.184)#534 |
| 69. | Wheaton | 0.93% | 0.62%(+0.309)#81 | 0.78%(+0.150)#535 |
| 70. | Harwood Heights | 0.92% | 0.62%(+0.296)#82 | 0.78%(+0.138)#536 |
| 71. | Crest Hill | 0.91% | 0.62%(+0.289)#83 | 0.78%(+0.131)#537 |
| 72. | Indian Creek | 0.90% | 0.62%(+0.283)#84 | 0.78%(+0.124)#538 |
| 73. | Inverness | 0.89% | 0.62%(+0.273)#85 | 0.78%(+0.114)#539 |
| 74. | Bourbonnais | 0.87% | 0.62%(+0.251)#86 | 0.78%(+0.092)#540 |
| 75. | Peoria | 0.87% | 0.62%(+0.244)#87 | 0.78%(+0.086)#541 |
| 76. | Bolingbrook | 0.87% | 0.62%(+0.244)#88 | 0.78%(+0.086)#542 |
| 77. | Huntley | 0.86% | 0.62%(+0.243)#89 | 0.78%(+0.085)#543 |
| 78. | Niles | 0.85% | 0.62%(+0.231)#90 | 0.78%(+0.073)#544 |
| 79. | Hickory Hills | 0.85% | 0.62%(+0.231)#91 | 0.78%(+0.072)#545 |
| 80. | Joliet | 0.82% | 0.62%(+0.201)#92 | 0.78%(+0.042)#546 |
| 81. | Burnham | 0.82% | 0.62%(+0.198)#93 | 0.78%(+0.040)#547 |
| 82. | Oak Brook | 0.82% | 0.62%(+0.197)#94 | 0.78%(+0.039)#548 |
| 83. | Tinley Park | 0.82% | 0.62%(+0.194)#95 | 0.78%(+0.036)#549 |
| 84. | Frankfort | 0.81% | 0.62%(+0.193)#96 | 0.78%(+0.035)#550 |
| 85. | Hanover Park | 0.81% | 0.62%(+0.185)#97 | 0.78%(+0.027)#551 |
| 86. | Orland Hills | 0.80% | 0.62%(+0.183)#98 | 0.78%(+0.025)#552 |
| 87. | Lake Holiday | 0.80% | 0.62%(+0.181)#99 | 0.78%(+0.023)#553 |
| 88. | Thomasboro | 0.78% | 0.62%(+0.161)#100 | 0.78%(+0.003)#554 |
| 89. | Zion | 0.78% | 0.62%(+0.160)#101 | 0.78%(+0.002)#555 |
| 90. | Antioch | 0.77% | 0.62%(+0.147)#102 | 0.78%(-0.011)#556 |
| 91. | Midlothian | 0.77% | 0.62%(+0.147)#103 | 0.78%(-0.012)#557 |
| 92. | Springfield | 0.76% | 0.62%(+0.138)#104 | 0.78%(-0.020)#558 |
| 93. | Rolling Meadows | 0.76% | 0.62%(+0.136)#105 | 0.78%(-0.023)#559 |
| 94. | Round Lake Park | 0.75% | 0.62%(+0.125)#106 | 0.78%(-0.034)#560 |
| 95. | Riverdale | 0.74% | 0.62%(+0.120)#107 | 0.78%(-0.038)#561 |
| 96. | Elwood | 0.73% | 0.62%(+0.113)#108 | 0.78%(-0.045)#562 |
| 97. | Villa Park | 0.73% | 0.62%(+0.104)#109 | 0.78%(-0.054)#563 |
| 98. | Tuscola | 0.72% | 0.62%(+0.101)#110 | 0.78%(-0.057)#564 |
| 99. | Phoenix | 0.70% | 0.62%(+0.083)#111 | 0.78%(-0.075)#565 |
| 100. | Edwardsville | 0.70% | 0.62%(+0.081)#112 | 0.78%(-0.077)#566 |
Common Questions
What are the Top 10 Cities with the Highest Percentage of Immigrants from Africa in Illinois?
Top 10 Cities with the Highest Percentage of Immigrants from Africa in Illinois are:
#1
7.89%
#2
5.85%
#3
5.27%
#4
4.95%
#5
4.91%
#6
4.63%
#7
4.58%
#8
4.45%
#9
3.61%
#10
3.41%
What city has the Highest Percentage of Immigrants from Africa in Illinois?
Bannockburn has the Highest Percentage of Immigrants from Africa in Illinois with 7.89%.
What is the Percentage of Immigrants from Africa in the State of Illinois?
Percentage of Immigrants from Africa in Illinois is 0.62%.
What is the Percentage of Immigrants from Africa in the United States?
Percentage of Immigrants from Africa in the United States is 0.78%.