Cities with the Highest Percentage of Immigrants from South Eastern Asia in South Carolina
RELATED REPORTS & OPTIONS
South Eastern Asia
South Carolina
Compare Cities
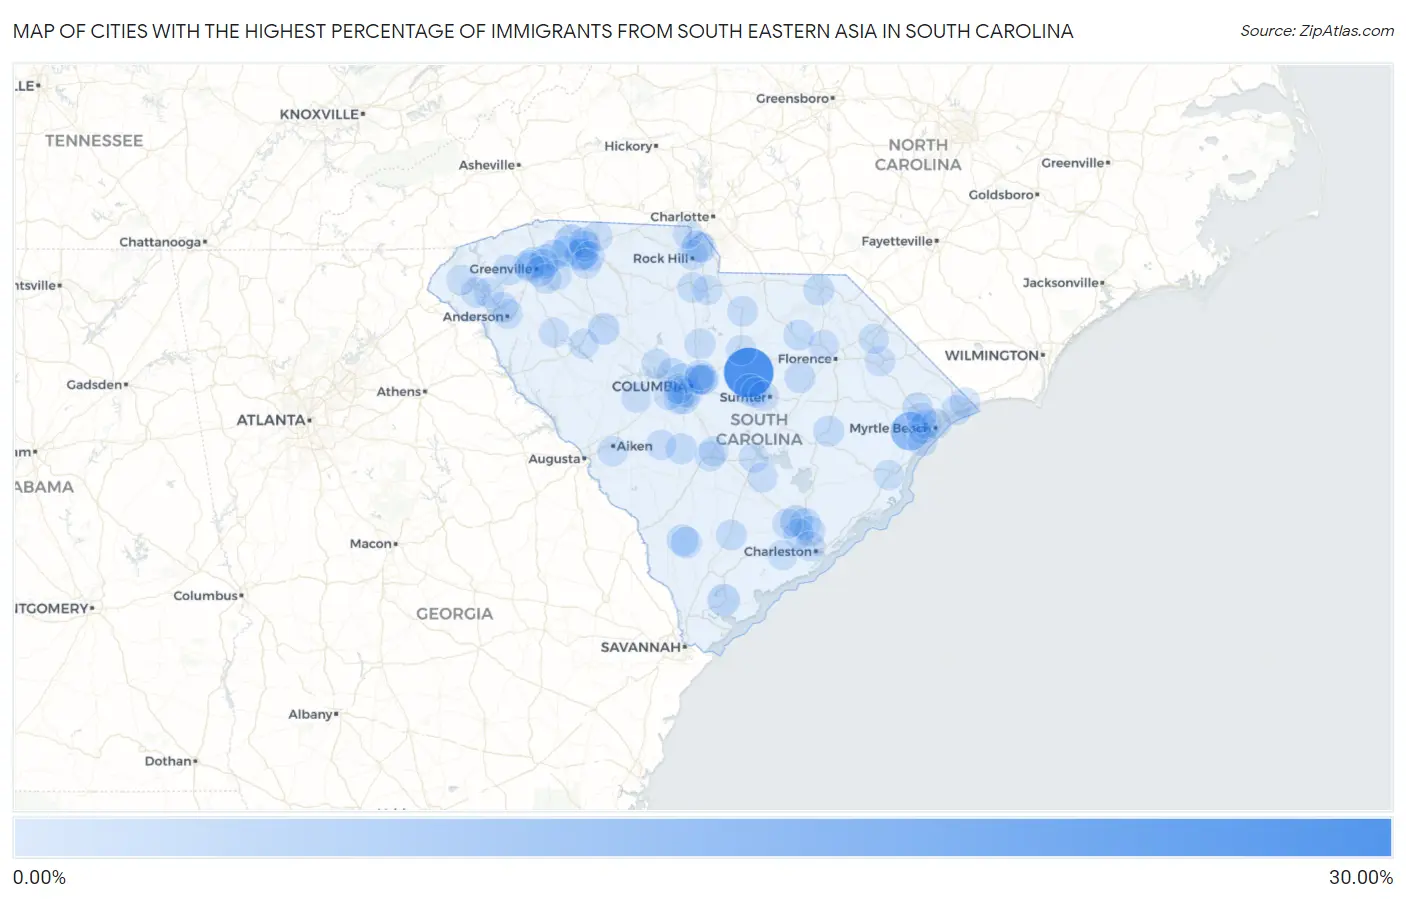
Map of Cities with the Highest Percentage of Immigrants from South Eastern Asia in South Carolina
0.00%
30.00%
Cities with the Highest Percentage of Immigrants from South Eastern Asia in South Carolina
| City | South Eastern Asia | vs State | vs National | |
| 1. | Rembert | 29.41% | 0.43%(+29.0)#-1 | 1.30%(+28.1)#0 |
| 2. | Bucksport | 12.63% | 0.43%(+12.2)#0 | 1.30%(+11.3)#1 |
| 3. | Camp Croft | 8.80% | 0.43%(+8.37)#1 | 1.30%(+7.50)#2 |
| 4. | Inman | 5.39% | 0.43%(+4.96)#2 | 1.30%(+4.09)#3 |
| 5. | Burton | 3.54% | 0.43%(+3.11)#3 | 1.30%(+2.24)#4 |
| 6. | Ladson | 2.99% | 0.43%(+2.55)#4 | 1.30%(+1.69)#5 |
| 7. | Fairforest | 2.89% | 0.43%(+2.46)#5 | 1.30%(+1.59)#6 |
| 8. | Arkwright | 2.86% | 0.43%(+2.43)#6 | 1.30%(+1.56)#7 |
| 9. | Stateburg | 2.82% | 0.43%(+2.39)#7 | 1.30%(+1.52)#8 |
| 10. | Arcadia | 2.71% | 0.43%(+2.27)#8 | 1.30%(+1.41)#9 |
| 11. | Joanna | 2.42% | 0.43%(+1.99)#9 | 1.30%(+1.12)#10 |
| 12. | Riverview | 2.24% | 0.43%(+1.81)#10 | 1.30%(+0.942)#11 |
| 13. | Goose Creek | 2.19% | 0.43%(+1.76)#11 | 1.30%(+0.893)#12 |
| 14. | Taylors | 2.10% | 0.43%(+1.67)#12 | 1.30%(+0.808)#13 |
| 15. | Irmo | 2.04% | 0.43%(+1.60)#13 | 1.30%(+0.740)#14 |
| 16. | Sans Souci | 1.93% | 0.43%(+1.49)#14 | 1.30%(+0.631)#15 |
| 17. | Hampton | 1.87% | 0.43%(+1.44)#15 | 1.30%(+0.575)#16 |
| 18. | Varnville | 1.84% | 0.43%(+1.41)#16 | 1.30%(+0.544)#17 |
| 19. | Kingstree | 1.69% | 0.43%(+1.25)#17 | 1.30%(+0.390)#18 |
| 20. | Neeses | 1.62% | 0.43%(+1.19)#18 | 1.30%(+0.325)#19 |
| 21. | Lynchburg | 1.62% | 0.43%(+1.19)#19 | 1.30%(+0.323)#20 |
| 22. | Arial | 1.60% | 0.43%(+1.17)#20 | 1.30%(+0.304)#21 |
| 23. | Cheraw | 1.56% | 0.43%(+1.13)#21 | 1.30%(+0.266)#22 |
| 24. | Springdale | 1.51% | 0.43%(+1.08)#22 | 1.30%(+0.216)#23 |
| 25. | Lyman | 1.41% | 0.43%(+0.977)#23 | 1.30%(+0.114)#24 |
| 26. | Greer | 1.39% | 0.43%(+0.953)#24 | 1.30%(+0.090)#25 |
| 27. | Pine Ridge | 1.38% | 0.43%(+0.944)#25 | 1.30%(+0.081)#26 |
| 28. | Hartsville | 1.37% | 0.43%(+0.936)#26 | 1.30%(+0.073)#27 |
| 29. | Walterboro | 1.29% | 0.43%(+0.855)#27 | 1.30%(-0.009)#28 |
| 30. | Hanahan | 1.22% | 0.43%(+0.788)#28 | 1.30%(-0.076)#29 |
| 31. | Cash | 1.20% | 0.43%(+0.766)#29 | 1.30%(-0.097)#30 |
| 32. | Ridgeway | 1.20% | 0.43%(+0.763)#30 | 1.30%(-0.101)#31 |
| 33. | Five Forks | 1.16% | 0.43%(+0.724)#31 | 1.30%(-0.140)#32 |
| 34. | South Congaree | 1.15% | 0.43%(+0.720)#32 | 1.30%(-0.144)#33 |
| 35. | Richburg | 1.13% | 0.43%(+0.697)#33 | 1.30%(-0.166)#34 |
| 36. | Kershaw | 1.13% | 0.43%(+0.692)#34 | 1.30%(-0.171)#35 |
| 37. | Woodfield | 1.11% | 0.43%(+0.677)#35 | 1.30%(-0.187)#36 |
| 38. | Capitol View | 1.09% | 0.43%(+0.656)#36 | 1.30%(-0.208)#37 |
| 39. | Northlake | 1.08% | 0.43%(+0.645)#37 | 1.30%(-0.218)#38 |
| 40. | Wade Hampton | 1.07% | 0.43%(+0.637)#38 | 1.30%(-0.226)#39 |
| 41. | Valley Falls | 1.04% | 0.43%(+0.609)#39 | 1.30%(-0.255)#40 |
| 42. | St Andrews | 1.00% | 0.43%(+0.571)#40 | 1.30%(-0.292)#41 |
| 43. | North Charleston | 0.99% | 0.43%(+0.555)#41 | 1.30%(-0.309)#42 |
| 44. | Cayce | 0.95% | 0.43%(+0.512)#42 | 1.30%(-0.351)#43 |
| 45. | Whitney | 0.94% | 0.43%(+0.505)#43 | 1.30%(-0.359)#44 |
| 46. | Carolina Forest | 0.92% | 0.43%(+0.490)#44 | 1.30%(-0.374)#45 |
| 47. | Arcadia Lakes | 0.92% | 0.43%(+0.486)#45 | 1.30%(-0.378)#46 |
| 48. | Sandy Springs | 0.92% | 0.43%(+0.484)#46 | 1.30%(-0.380)#47 |
| 49. | Berea | 0.83% | 0.43%(+0.401)#47 | 1.30%(-0.462)#48 |
| 50. | Utica | 0.79% | 0.43%(+0.353)#48 | 1.30%(-0.510)#49 |
| 51. | Aiken | 0.77% | 0.43%(+0.339)#49 | 1.30%(-0.525)#50 |
| 52. | Summerville | 0.76% | 0.43%(+0.323)#50 | 1.30%(-0.541)#51 |
| 53. | Orangeburg | 0.73% | 0.43%(+0.301)#51 | 1.30%(-0.563)#52 |
| 54. | Wyboo | 0.71% | 0.43%(+0.280)#52 | 1.30%(-0.583)#53 |
| 55. | Darlington | 0.68% | 0.43%(+0.248)#53 | 1.30%(-0.616)#54 |
| 56. | Salley | 0.67% | 0.43%(+0.241)#54 | 1.30%(-0.623)#55 |
| 57. | Marion | 0.67% | 0.43%(+0.239)#55 | 1.30%(-0.625)#56 |
| 58. | Camden | 0.66% | 0.43%(+0.231)#56 | 1.30%(-0.633)#57 |
| 59. | Walhalla | 0.66% | 0.43%(+0.226)#57 | 1.30%(-0.638)#58 |
| 60. | Oak Grove | 0.65% | 0.43%(+0.217)#58 | 1.30%(-0.646)#59 |
| 61. | Boiling Springs | 0.63% | 0.43%(+0.193)#59 | 1.30%(-0.671)#60 |
| 62. | Sumter | 0.61% | 0.43%(+0.176)#60 | 1.30%(-0.688)#61 |
| 63. | Mayo | 0.57% | 0.43%(+0.139)#61 | 1.30%(-0.725)#62 |
| 64. | Anderson | 0.53% | 0.43%(+0.099)#62 | 1.30%(-0.765)#63 |
| 65. | Latta | 0.53% | 0.43%(+0.094)#63 | 1.30%(-0.770)#64 |
| 66. | Fripp Island | 0.52% | 0.43%(+0.089)#64 | 1.30%(-0.775)#65 |
| 67. | Brookdale | 0.52% | 0.43%(+0.083)#65 | 1.30%(-0.780)#66 |
| 68. | Spartanburg | 0.51% | 0.43%(+0.074)#66 | 1.30%(-0.790)#67 |
| 69. | Santee | 0.50% | 0.43%(+0.072)#67 | 1.30%(-0.792)#68 |
| 70. | Forest Acres | 0.50% | 0.43%(+0.071)#68 | 1.30%(-0.792)#69 |
| 71. | Little River | 0.50% | 0.43%(+0.067)#69 | 1.30%(-0.797)#70 |
| 72. | Rock Hill | 0.47% | 0.43%(+0.039)#70 | 1.30%(-0.824)#71 |
| 73. | Ware Shoals | 0.47% | 0.43%(+0.033)#71 | 1.30%(-0.831)#72 |
| 74. | Cherryvale | 0.46% | 0.43%(+0.025)#72 | 1.30%(-0.839)#73 |
| 75. | North Myrtle Beach | 0.46% | 0.43%(+0.024)#73 | 1.30%(-0.840)#74 |
| 76. | Clemson | 0.46% | 0.43%(+0.023)#74 | 1.30%(-0.841)#75 |
| 77. | Dentsville | 0.43% | 0.43%(+0.000)#75 | 1.30%(-0.863)#76 |
| 78. | Hollywood | 0.43% | 0.43%(-0.007)#76 | 1.30%(-0.870)#77 |
| 79. | Columbia | 0.41% | 0.43%(-0.027)#77 | 1.30%(-0.890)#78 |
| 80. | Chapin | 0.39% | 0.43%(-0.044)#78 | 1.30%(-0.907)#79 |
| 81. | Fort Mill | 0.38% | 0.43%(-0.048)#79 | 1.30%(-0.912)#80 |
| 82. | Cross Hill | 0.38% | 0.43%(-0.050)#80 | 1.30%(-0.913)#81 |
| 83. | Socastee | 0.38% | 0.43%(-0.053)#81 | 1.30%(-0.916)#82 |
| 84. | Conway | 0.37% | 0.43%(-0.062)#82 | 1.30%(-0.926)#83 |
| 85. | Parker | 0.37% | 0.43%(-0.064)#83 | 1.30%(-0.927)#84 |
| 86. | Georgetown | 0.37% | 0.43%(-0.066)#84 | 1.30%(-0.930)#85 |
| 87. | Roebuck | 0.36% | 0.43%(-0.068)#85 | 1.30%(-0.931)#86 |
| 88. | Holly Hill | 0.36% | 0.43%(-0.071)#86 | 1.30%(-0.935)#87 |
| 89. | Mauldin | 0.35% | 0.43%(-0.080)#87 | 1.30%(-0.944)#88 |
| 90. | Forestbrook | 0.35% | 0.43%(-0.082)#88 | 1.30%(-0.946)#89 |
| 91. | Fort Lawn | 0.35% | 0.43%(-0.085)#89 | 1.30%(-0.948)#90 |
| 92. | Charleston | 0.34% | 0.43%(-0.097)#90 | 1.30%(-0.960)#91 |
| 93. | Myrtle Beach | 0.33% | 0.43%(-0.106)#91 | 1.30%(-0.969)#92 |
| 94. | Garden City | 0.32% | 0.43%(-0.111)#92 | 1.30%(-0.975)#93 |
| 95. | Greenville | 0.31% | 0.43%(-0.118)#93 | 1.30%(-0.982)#94 |
| 96. | Red Hill | 0.30% | 0.43%(-0.131)#94 | 1.30%(-0.995)#95 |
| 97. | Red Bank | 0.29% | 0.43%(-0.139)#95 | 1.30%(-1.00)#96 |
| 98. | Lake Wylie | 0.29% | 0.43%(-0.148)#96 | 1.30%(-1.01)#97 |
| 99. | Batesburg Leesville | 0.28% | 0.43%(-0.153)#97 | 1.30%(-1.02)#98 |
| 100. | Hilltop | 0.28% | 0.43%(-0.156)#98 | 1.30%(-1.02)#99 |
Common Questions
What are the Top 10 Cities with the Highest Percentage of Immigrants from South Eastern Asia in South Carolina?
Top 10 Cities with the Highest Percentage of Immigrants from South Eastern Asia in South Carolina are:
What city has the Highest Percentage of Immigrants from South Eastern Asia in South Carolina?
Rembert has the Highest Percentage of Immigrants from South Eastern Asia in South Carolina with 29.41%.
What is the Percentage of Immigrants from South Eastern Asia in the State of South Carolina?
Percentage of Immigrants from South Eastern Asia in South Carolina is 0.43%.
What is the Percentage of Immigrants from South Eastern Asia in the United States?
Percentage of Immigrants from South Eastern Asia in the United States is 1.30%.