Cities with the Highest Percentage of Immigrants from Chile in Illinois
RELATED REPORTS & OPTIONS
Chile
Illinois
Compare Cities
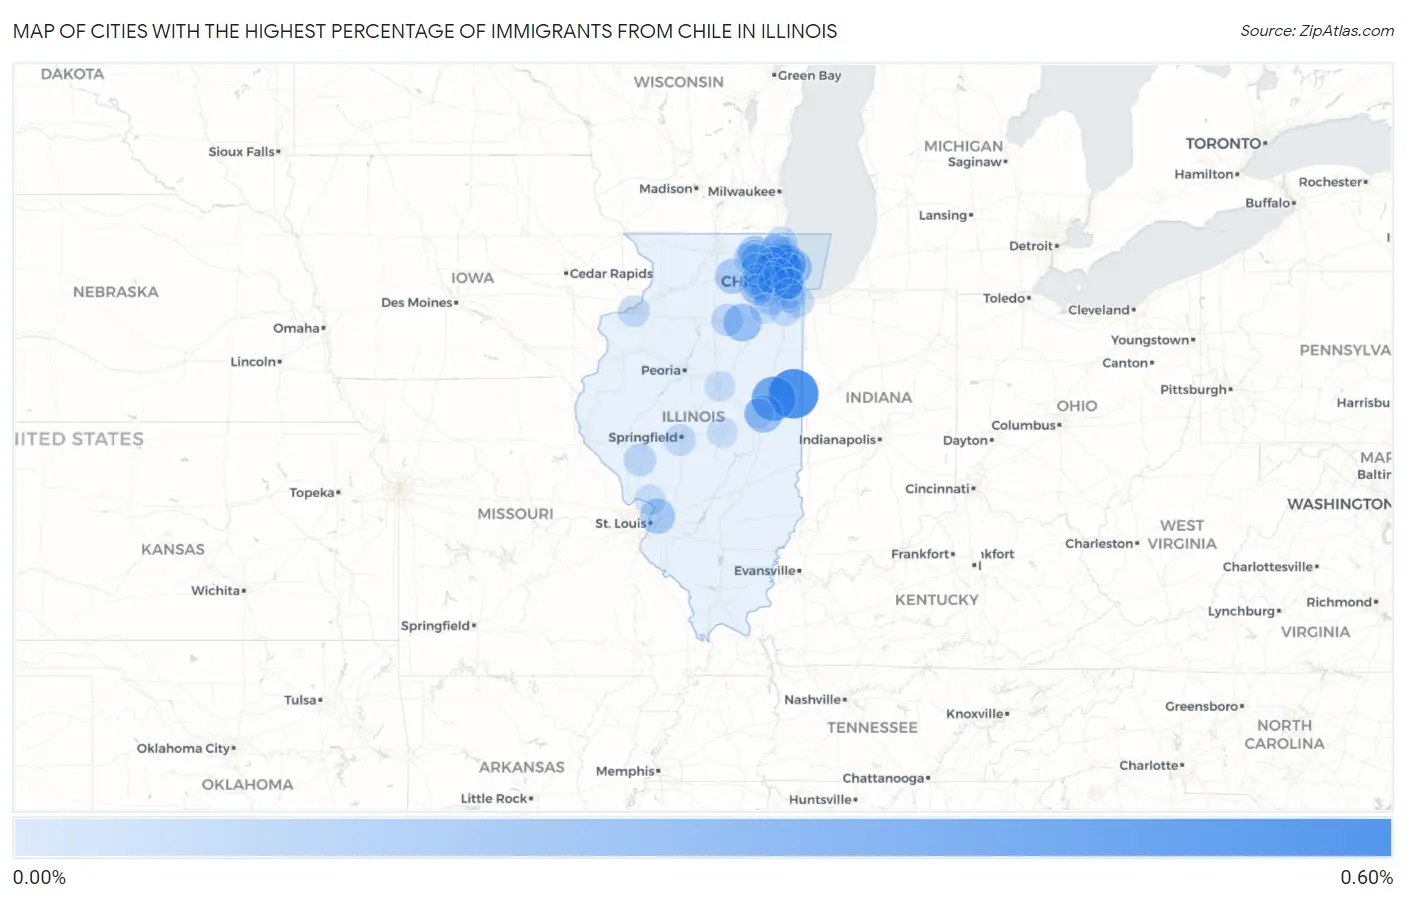
Map of Cities with the Highest Percentage of Immigrants from Chile in Illinois
0.00%
0.60%
Cities with the Highest Percentage of Immigrants from Chile in Illinois
| City | Chile | vs State | vs National | |
| 1. | Rossville | 0.50% | 0.018%(+0.483)#-1 | 0.032%(+0.469)#0 |
| 2. | Gifford | 0.36% | 0.018%(+0.345)#0 | 0.032%(+0.331)#1 |
| 3. | Maywood | 0.22% | 0.018%(+0.200)#182 | 0.032%(+0.186)#4,016 |
| 4. | Evanston | 0.21% | 0.018%(+0.188)#183 | 0.032%(+0.174)#4,017 |
| 5. | Prospect Heights | 0.20% | 0.018%(+0.177)#184 | 0.032%(+0.163)#4,018 |
| 6. | Seneca | 0.19% | 0.018%(+0.177)#185 | 0.032%(+0.163)#4,019 |
| 7. | Urbana | 0.19% | 0.018%(+0.176)#191 | 0.032%(+0.161)#4,147 |
| 8. | Northfield | 0.19% | 0.018%(+0.175)#192 | 0.032%(+0.161)#4,148 |
| 9. | Crystal Lake | 0.15% | 0.018%(+0.128)#193 | 0.032%(+0.114)#4,149 |
| 10. | Pontoon Beach | 0.13% | 0.018%(+0.115)#194 | 0.032%(+0.100)#4,150 |
| 11. | Dekalb | 0.12% | 0.018%(+0.105)#195 | 0.032%(+0.091)#4,151 |
| 12. | Warrenville | 0.093% | 0.018%(+0.075)#196 | 0.032%(+0.061)#4,152 |
| 13. | Northbrook | 0.092% | 0.018%(+0.074)#197 | 0.032%(+0.059)#4,153 |
| 14. | Arlington Heights | 0.081% | 0.018%(+0.063)#198 | 0.032%(+0.049)#4,154 |
| 15. | Lake In The Hills | 0.079% | 0.018%(+0.061)#199 | 0.032%(+0.047)#4,155 |
| 16. | North Aurora | 0.073% | 0.018%(+0.055)#200 | 0.032%(+0.041)#4,156 |
| 17. | Niles | 0.072% | 0.018%(+0.054)#201 | 0.032%(+0.040)#4,157 |
| 18. | Westchester | 0.066% | 0.018%(+0.048)#202 | 0.032%(+0.034)#4,158 |
| 19. | Romeoville | 0.065% | 0.018%(+0.047)#203 | 0.032%(+0.033)#4,159 |
| 20. | Carpentersville | 0.063% | 0.018%(+0.045)#204 | 0.032%(+0.031)#4,160 |
| 21. | Mundelein | 0.063% | 0.018%(+0.045)#205 | 0.032%(+0.031)#4,161 |
| 22. | Huntley | 0.061% | 0.018%(+0.044)#206 | 0.032%(+0.029)#4,162 |
| 23. | Roodhouse | 0.061% | 0.018%(+0.043)#207 | 0.032%(+0.029)#4,163 |
| 24. | South Holland | 0.061% | 0.018%(+0.043)#208 | 0.032%(+0.029)#4,164 |
| 25. | Ottawa | 0.059% | 0.018%(+0.041)#209 | 0.032%(+0.027)#4,165 |
| 26. | Alsip | 0.058% | 0.018%(+0.040)#210 | 0.032%(+0.026)#4,166 |
| 27. | Carol Stream | 0.058% | 0.018%(+0.040)#211 | 0.032%(+0.026)#4,167 |
| 28. | Wilmette | 0.058% | 0.018%(+0.040)#212 | 0.032%(+0.025)#4,168 |
| 29. | Springfield | 0.045% | 0.018%(+0.027)#213 | 0.032%(+0.012)#4,169 |
| 30. | Frankfort | 0.044% | 0.018%(+0.026)#214 | 0.032%(+0.012)#4,170 |
| 31. | Libertyville | 0.044% | 0.018%(+0.026)#215 | 0.032%(+0.012)#4,171 |
| 32. | Streamwood | 0.043% | 0.018%(+0.025)#216 | 0.032%(+0.011)#4,287 |
| 33. | Lake Forest | 0.041% | 0.018%(+0.023)#217 | 0.032%(+0.009)#4,288 |
| 34. | Waukegan | 0.040% | 0.018%(+0.022)#218 | 0.032%(+0.008)#4,289 |
| 35. | Palatine | 0.039% | 0.018%(+0.021)#219 | 0.032%(+0.006)#4,290 |
| 36. | Moline | 0.038% | 0.018%(+0.020)#220 | 0.032%(+0.006)#4,291 |
| 37. | Chicago | 0.033% | 0.018%(+0.015)#221 | 0.032%(+0.001)#4,292 |
| 38. | Naperville | 0.032% | 0.018%(+0.014)#222 | 0.032%(-0.001)#4,293 |
| 39. | Algonquin | 0.030% | 0.018%(+0.012)#223 | 0.032%(-0.002)#4,294 |
| 40. | Cicero | 0.030% | 0.018%(+0.012)#224 | 0.032%(-0.002)#4,295 |
| 41. | Godfrey | 0.028% | 0.018%(+0.010)#225 | 0.032%(-0.004)#4,296 |
| 42. | Batavia | 0.027% | 0.018%(+0.009)#226 | 0.032%(-0.006)#4,297 |
| 43. | Schaumburg | 0.024% | 0.018%(+0.007)#227 | 0.032%(-0.008)#4,298 |
| 44. | Glendale Heights | 0.024% | 0.018%(+0.006)#228 | 0.032%(-0.008)#4,299 |
| 45. | Geneva | 0.023% | 0.018%(+0.005)#229 | 0.032%(-0.009)#4,300 |
| 46. | Aurora | 0.023% | 0.018%(+0.005)#230 | 0.032%(-0.009)#4,301 |
| 47. | Decatur | 0.018% | 0.018%(+0.000)#231 | 0.032%(-0.014)#4,302 |
| 48. | Berwyn | 0.018% | 0.018%(-0.000)#232 | 0.032%(-0.015)#4,303 |
| 49. | Elgin | 0.018% | 0.018%(-0.000)#233 | 0.032%(-0.015)#4,304 |
| 50. | Lombard | 0.016% | 0.018%(-0.002)#234 | 0.032%(-0.016)#4,305 |
| 51. | Bloomington | 0.015% | 0.018%(-0.003)#235 | 0.032%(-0.017)#4,306 |
| 52. | Skokie | 0.012% | 0.018%(-0.006)#236 | 0.032%(-0.020)#4,307 |
| 53. | Bensenville | 0.011% | 0.018%(-0.007)#237 | 0.032%(-0.021)#4,308 |
| 54. | Oak Lawn | 0.0087% | 0.018%(-0.009)#238 | 0.032%(-0.024)#4,309 |
| 55. | Joliet | 0.0067% | 0.018%(-0.011)#239 | 0.032%(-0.026)#4,310 |
| 56. | Champaign | 0.0034% | 0.018%(-0.015)#240 | 0.032%(-0.029)#4,311 |
Common Questions
What are the Top 10 Cities with the Highest Percentage of Immigrants from Chile in Illinois?
Top 10 Cities with the Highest Percentage of Immigrants from Chile in Illinois are:
#1
0.50%
#2
0.36%
#3
0.22%
#4
0.21%
#5
0.20%
#6
0.19%
#7
0.19%
#8
0.19%
#9
0.15%
#10
0.13%
What city has the Highest Percentage of Immigrants from Chile in Illinois?
Rossville has the Highest Percentage of Immigrants from Chile in Illinois with 0.50%.
What is the Percentage of Immigrants from Chile in the State of Illinois?
Percentage of Immigrants from Chile in Illinois is 0.018%.
What is the Percentage of Immigrants from Chile in the United States?
Percentage of Immigrants from Chile in the United States is 0.032%.