Edgewood, IL
Edgewood Map
Edgewood Overview
429
TOTAL POPULATION
222
MALE POPULATION
207
FEMALE POPULATION
107.25
MALES / 100 FEMALES
93.24
FEMALES / 100 MALES
37.2
MEDIAN AGE
2.5
AVG FAMILY SIZE
2.1
AVG HOUSEHOLD SIZE
$24,012
PER CAPITA INCOME
$61,875
AVG FAMILY INCOME
$41,250
AVG HOUSEHOLD INCOME
30.7%
WAGE / INCOME GAP [ % ]
69.3¢/ $1
WAGE / INCOME GAP [ $ ]
0.42
INEQUALITY / GINI INDEX
222
LABOR FORCE [ PEOPLE ]
61.8%
PERCENT IN LABOR FORCE
5.4%
UNEMPLOYMENT RATE
Edgewood Zip Codes
Edgewood Area Codes
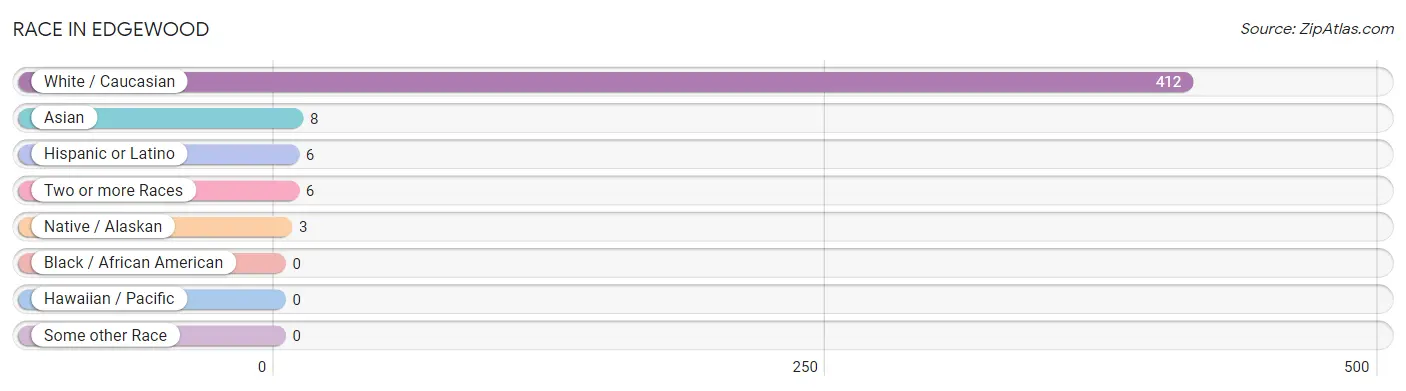
Race in Edgewood
The most populous races in Edgewood are White / Caucasian (412 | 96.0%), Asian (8 | 1.9%), and Hispanic or Latino (6 | 1.4%).
| Race | # Population | % Population |
| Asian | 8 | 1.9% |
| Black / African American | 0 | 0.0% |
| Hawaiian / Pacific | 0 | 0.0% |
| Hispanic or Latino | 6 | 1.4% |
| Native / Alaskan | 3 | 0.7% |
| White / Caucasian | 412 | 96.0% |
| Two or more Races | 6 | 1.4% |
| Some other Race | 0 | 0.0% |
| Total | 429 | 100.0% |
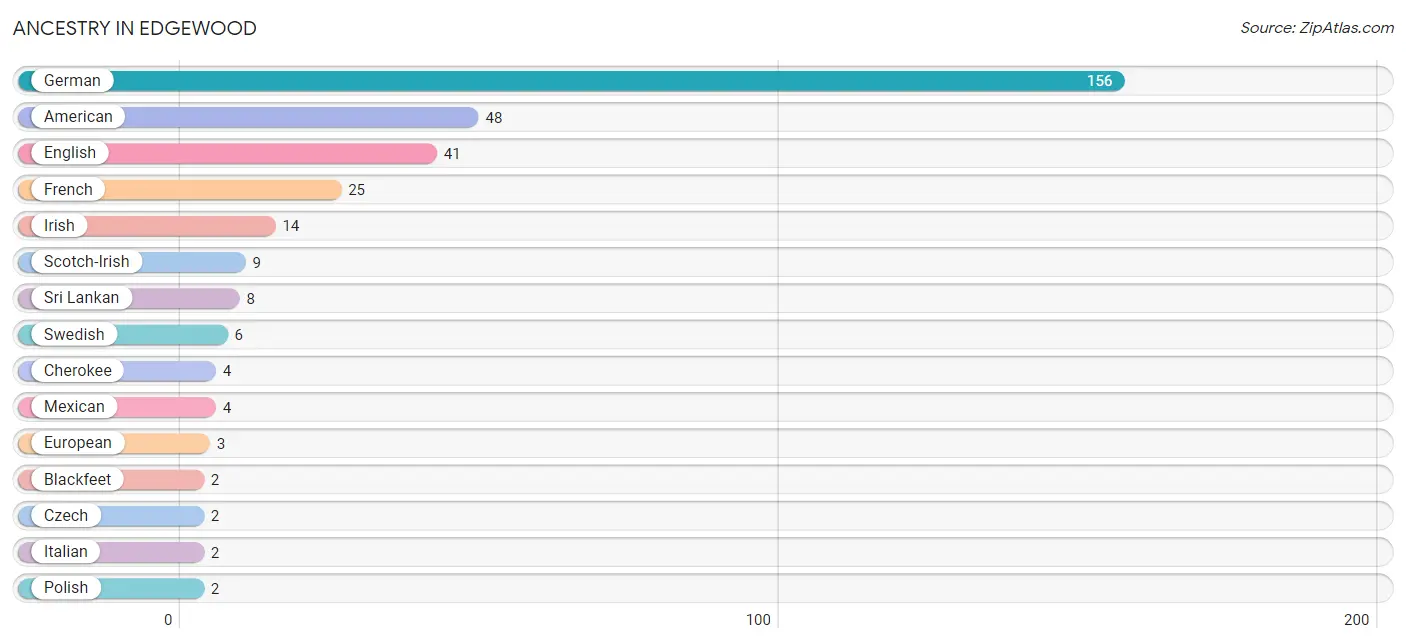
Ancestry in Edgewood
The most populous ancestries reported in Edgewood are German (156 | 36.4%), American (48 | 11.2%), English (41 | 9.6%), French (25 | 5.8%), and Irish (14 | 3.3%), together accounting for 66.2% of all Edgewood residents.
| Ancestry | # Population | % Population |
| American | 48 | 11.2% |
| Blackfeet | 2 | 0.5% |
| Cherokee | 4 | 0.9% |
| Cuban | 1 | 0.2% |
| Czech | 2 | 0.5% |
| Eastern European | 1 | 0.2% |
| English | 41 | 9.6% |
| European | 3 | 0.7% |
| French | 25 | 5.8% |
| German | 156 | 36.4% |
| Irish | 14 | 3.3% |
| Italian | 2 | 0.5% |
| Mexican | 4 | 0.9% |
| Polish | 2 | 0.5% |
| Puerto Rican | 1 | 0.2% |
| Scotch-Irish | 9 | 2.1% |
| Scottish | 1 | 0.2% |
| Sri Lankan | 8 | 1.9% |
| Swedish | 6 | 1.4% | View All 19 Rows |
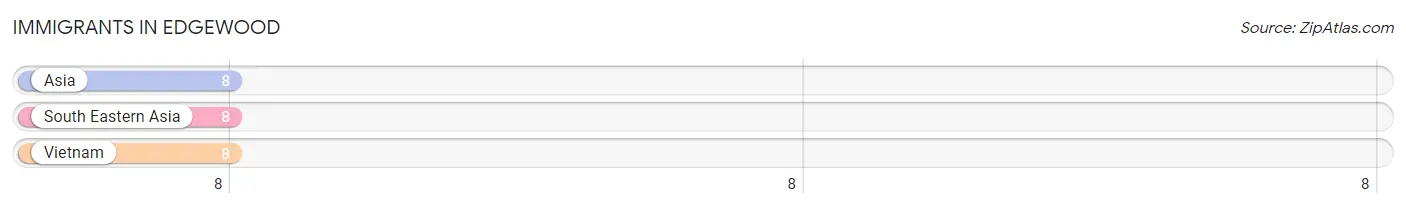
Immigrants in Edgewood
The most numerous immigrant groups reported in Edgewood came from Asia (8 | 1.9%), South Eastern Asia (8 | 1.9%), and Vietnam (8 | 1.9%), together accounting for 5.6% of all Edgewood residents.
| Immigration Origin | # Population | % Population |
| Asia | 8 | 1.9% |
| South Eastern Asia | 8 | 1.9% |
| Vietnam | 8 | 1.9% | View All 3 Rows |
Sex and Age in Edgewood
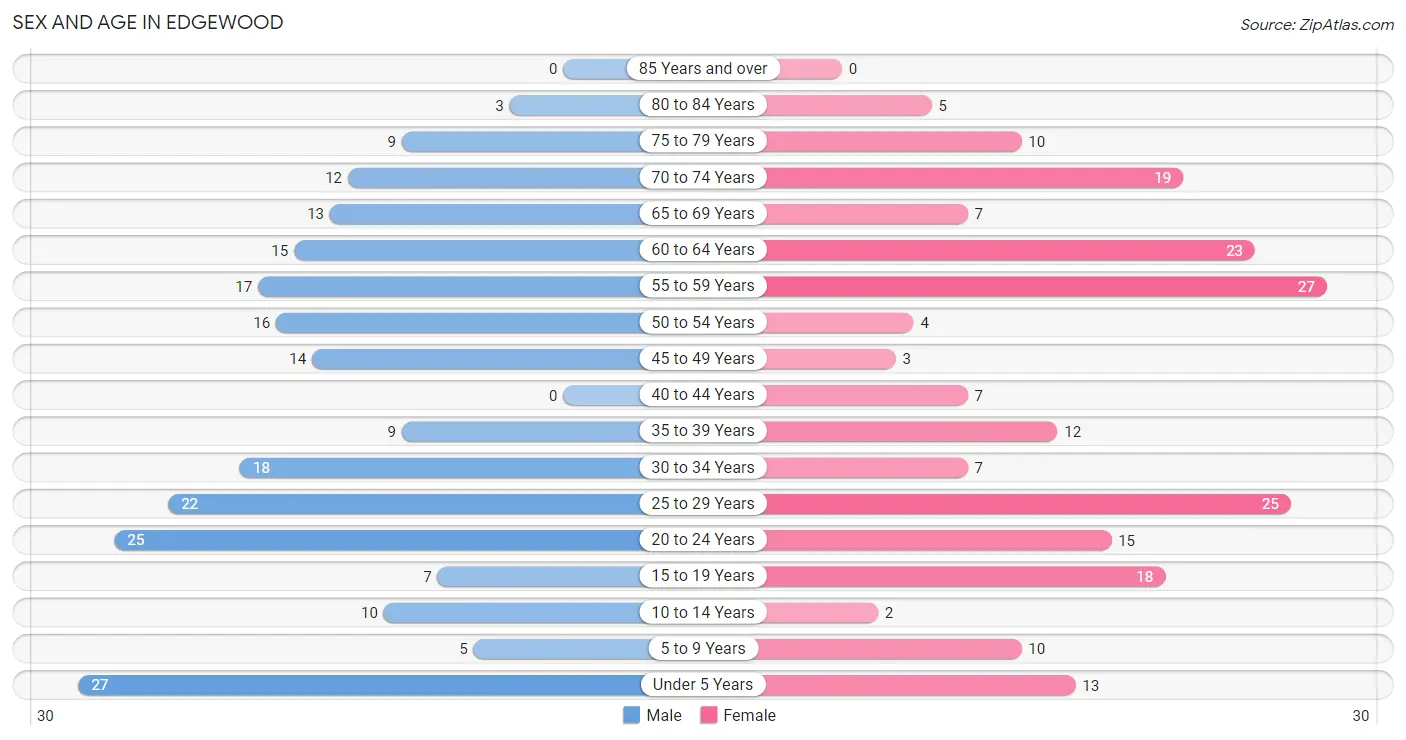
Sex and Age in Edgewood
The most populous age groups in Edgewood are Under 5 Years (27 | 12.2%) for men and 55 to 59 Years (27 | 13.0%) for women.
| Age Bracket | Male | Female |
| Under 5 Years | 27 (12.2%) | 13 (6.3%) |
| 5 to 9 Years | 5 (2.2%) | 10 (4.8%) |
| 10 to 14 Years | 10 (4.5%) | 2 (1.0%) |
| 15 to 19 Years | 7 (3.2%) | 18 (8.7%) |
| 20 to 24 Years | 25 (11.3%) | 15 (7.2%) |
| 25 to 29 Years | 22 (9.9%) | 25 (12.1%) |
| 30 to 34 Years | 18 (8.1%) | 7 (3.4%) |
| 35 to 39 Years | 9 (4.1%) | 12 (5.8%) |
| 40 to 44 Years | 0 (0.0%) | 7 (3.4%) |
| 45 to 49 Years | 14 (6.3%) | 3 (1.5%) |
| 50 to 54 Years | 16 (7.2%) | 4 (1.9%) |
| 55 to 59 Years | 17 (7.7%) | 27 (13.0%) |
| 60 to 64 Years | 15 (6.8%) | 23 (11.1%) |
| 65 to 69 Years | 13 (5.9%) | 7 (3.4%) |
| 70 to 74 Years | 12 (5.4%) | 19 (9.2%) |
| 75 to 79 Years | 9 (4.1%) | 10 (4.8%) |
| 80 to 84 Years | 3 (1.3%) | 5 (2.4%) |
| 85 Years and over | 0 (0.0%) | 0 (0.0%) |
| Total | 222 (100.0%) | 207 (100.0%) |
Families and Households in Edgewood
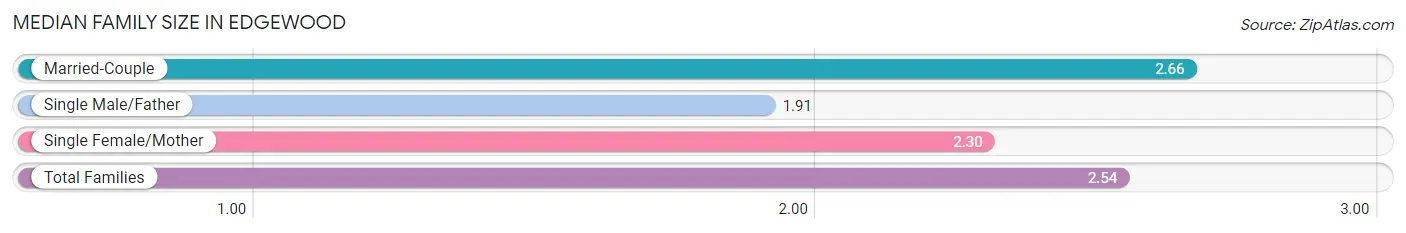
Median Family Size in Edgewood
The median family size in Edgewood is 2.54 persons per family, with married-couple families (103 | 75.2%) accounting for the largest median family size of 2.66 persons per family. On the other hand, single male/father families (11 | 8.0%) represent the smallest median family size with 1.91 persons per family.
| Family Type | # Families | Family Size |
| Married-Couple | 103 (75.2%) | 2.66 |
| Single Male/Father | 11 (8.0%) | 1.91 |
| Single Female/Mother | 23 (16.8%) | 2.30 |
| Total Families | 137 (100.0%) | 2.54 |
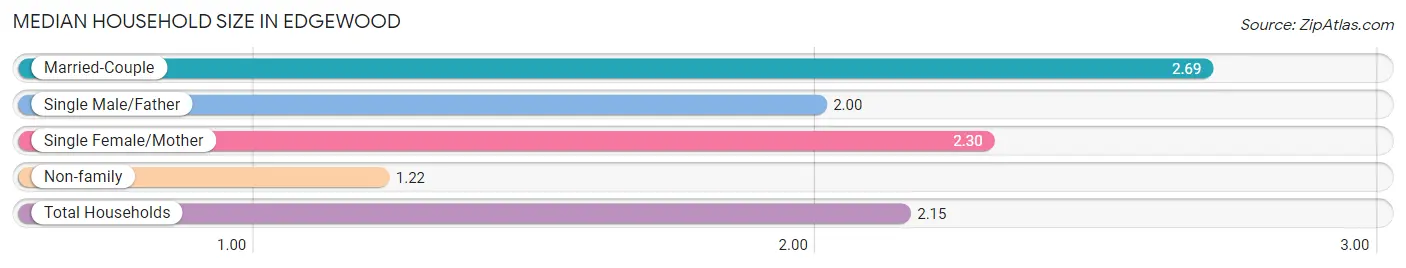
Median Household Size in Edgewood
The median household size in Edgewood is 2.15 persons per household, with married-couple households (103 | 51.5%) accounting for the largest median household size of 2.69 persons per household. non-family households (63 | 31.5%) represent the smallest median household size with 1.22 persons per household.
| Household Type | # Households | Household Size |
| Married-Couple | 103 (51.5%) | 2.69 |
| Single Male/Father | 11 (5.5%) | 2.00 |
| Single Female/Mother | 23 (11.5%) | 2.30 |
| Non-family | 63 (31.5%) | 1.22 |
| Total Households | 200 (100.0%) | 2.15 |
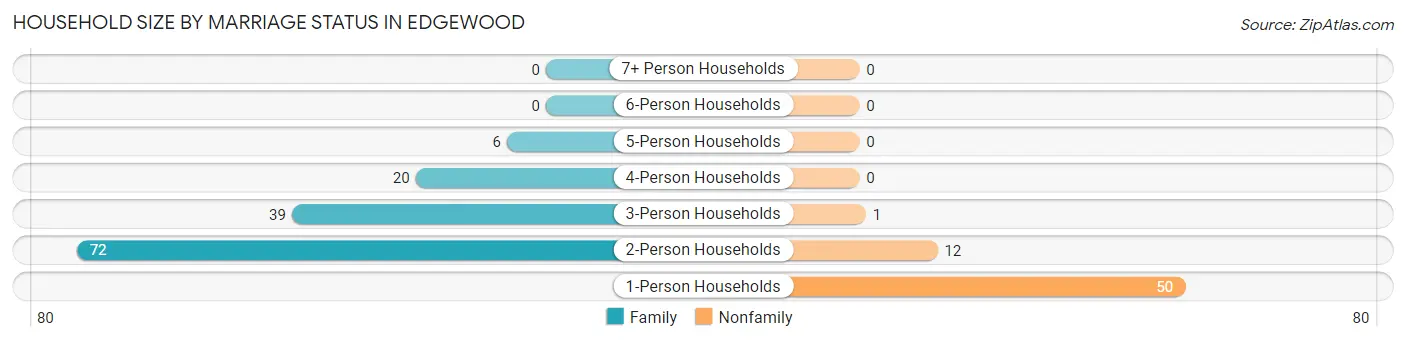
Household Size by Marriage Status in Edgewood
Out of a total of 200 households in Edgewood, 137 (68.5%) are family households, while 63 (31.5%) are nonfamily households. The most numerous type of family households are 2-person households, comprising 72, and the most common type of nonfamily households are 1-person households, comprising 50.
| Household Size | Family Households | Nonfamily Households |
| 1-Person Households | - | 50 (25.0%) |
| 2-Person Households | 72 (36.0%) | 12 (6.0%) |
| 3-Person Households | 39 (19.5%) | 1 (0.5%) |
| 4-Person Households | 20 (10.0%) | 0 (0.0%) |
| 5-Person Households | 6 (3.0%) | 0 (0.0%) |
| 6-Person Households | 0 (0.0%) | 0 (0.0%) |
| 7+ Person Households | 0 (0.0%) | 0 (0.0%) |
| Total | 137 (68.5%) | 63 (31.5%) |
Female Fertility in Edgewood
Fertility by Age in Edgewood
| Age Bracket | Women with Births | Births / 1,000 Women |
| 15 to 19 years | 0 (0.0%) | 0.0 |
| 20 to 34 years | 0 (0.0%) | 0.0 |
| 35 to 50 years | 0 (0.0%) | 0.0 |
| Total | 0 (0.0%) | 0.0 |
Fertility by Age by Marriage Status in Edgewood
| Age Bracket | Married | Unmarried |
| 15 to 19 years | 0 (0.0%) | 0 (0.0%) |
| 20 to 34 years | 0 (0.0%) | 0 (0.0%) |
| 35 to 50 years | 0 (0.0%) | 0 (0.0%) |
| Total | 0 (0.0%) | 0 (0.0%) |
Fertility by Education in Edgewood
| Educational Attainment | Women with Births | Births / 1,000 Women |
| Less than High School | 0 (0.0%) | 0.0 |
| High School Diploma | 0 (0.0%) | 0.0 |
| College or Associate's Degree | 0 (0.0%) | 0.0 |
| Bachelor's Degree | 0 (0.0%) | 0.0 |
| Graduate Degree | 0 (0.0%) | 0.0 |
| Total | 0 (0.0%) | 0.0 |
Fertility by Education by Marriage Status in Edgewood
| Educational Attainment | Married | Unmarried |
| Less than High School | 0 (0.0%) | 0 (0.0%) |
| High School Diploma | 0 (0.0%) | 0 (0.0%) |
| College or Associate's Degree | 0 (0.0%) | 0 (0.0%) |
| Bachelor's Degree | 0 (0.0%) | 0 (0.0%) |
| Graduate Degree | 0 (0.0%) | 0 (0.0%) |
| Total | 0 (0.0%) | 0 (0.0%) |
Income in Edgewood
Income Overview in Edgewood
Per Capita Income in Edgewood is $24,012, while median incomes of families and households are $61,875 and $41,250 respectively.
| Characteristic | Number | Measure |
| Per Capita Income | 429 | $24,012 |
| Median Family Income | 137 | $61,875 |
| Mean Family Income | 137 | $68,230 |
| Median Household Income | 200 | $41,250 |
| Mean Household Income | 200 | $54,987 |
| Income Deficit | 137 | $0 |
| Wage / Income Gap (%) | 429 | 30.73% |
| Wage / Income Gap ($) | 429 | 69.27¢ per $1 |
| Gini / Inequality Index | 429 | 0.42 |
Earnings by Sex in Edgewood
Average Earnings in Edgewood are $28,750, $34,886 for men and $24,167 for women, a difference of 30.7%.
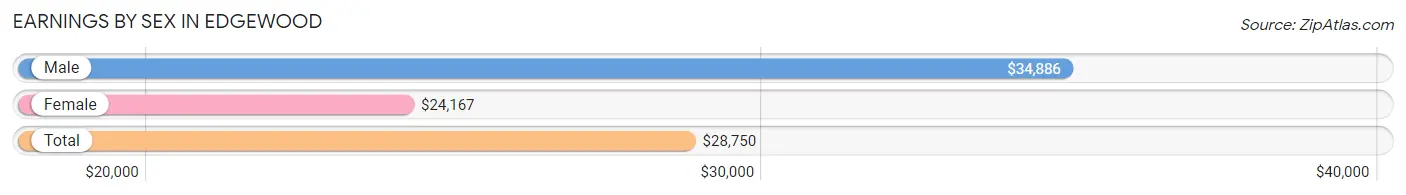
| Sex | Number | Average Earnings |
| Male | 123 (53.2%) | $34,886 |
| Female | 108 (46.8%) | $24,167 |
| Total | 231 (100.0%) | $28,750 |
Earnings by Sex by Income Bracket in Edgewood
The most common earnings brackets in Edgewood are $65,000 to $74,999 for men (14 | 11.4%) and $22,500 to $24,999 for women (12 | 11.1%).
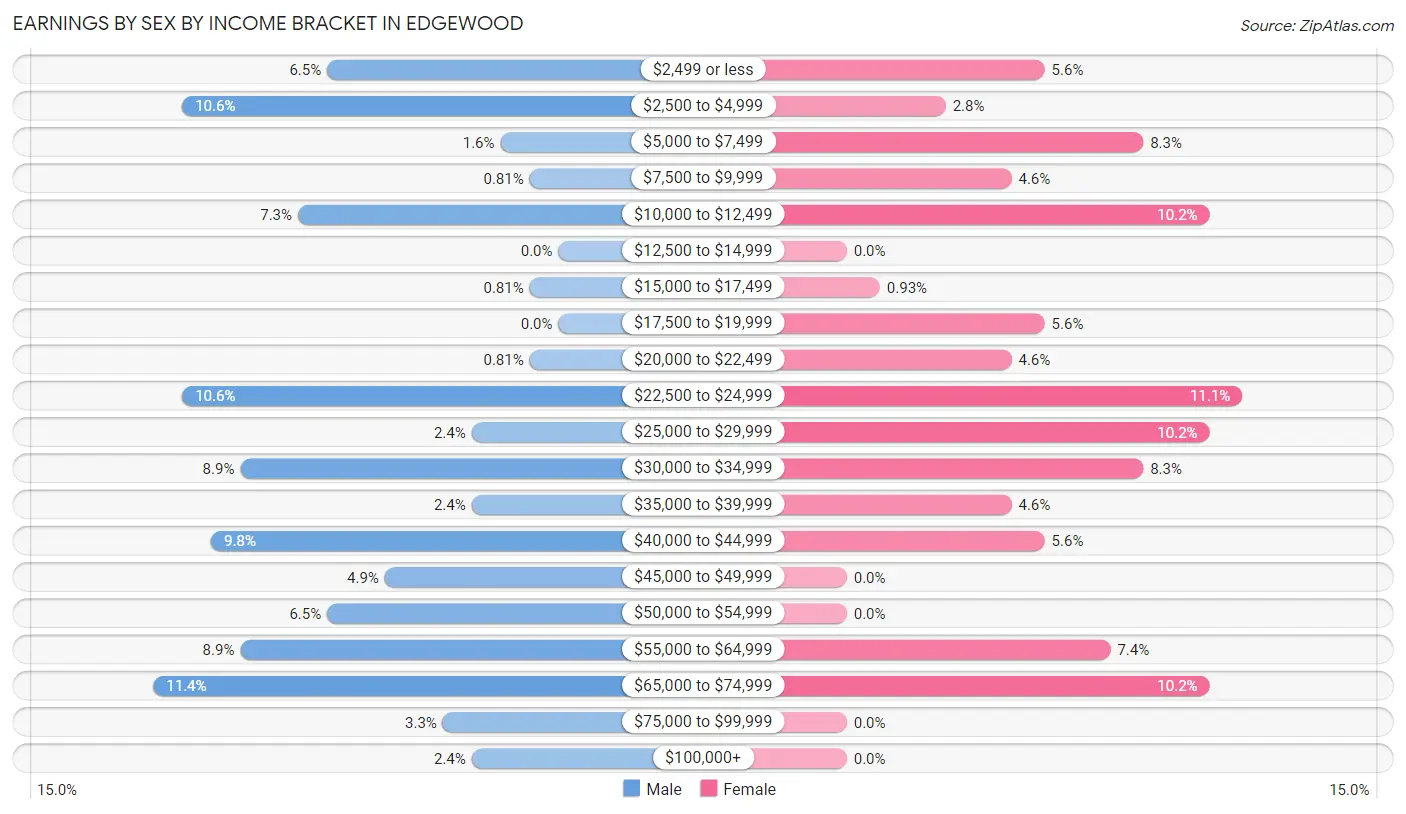
| Income | Male | Female |
| $2,499 or less | 8 (6.5%) | 6 (5.6%) |
| $2,500 to $4,999 | 13 (10.6%) | 3 (2.8%) |
| $5,000 to $7,499 | 2 (1.6%) | 9 (8.3%) |
| $7,500 to $9,999 | 1 (0.8%) | 5 (4.6%) |
| $10,000 to $12,499 | 9 (7.3%) | 11 (10.2%) |
| $12,500 to $14,999 | 0 (0.0%) | 0 (0.0%) |
| $15,000 to $17,499 | 1 (0.8%) | 1 (0.9%) |
| $17,500 to $19,999 | 0 (0.0%) | 6 (5.6%) |
| $20,000 to $22,499 | 1 (0.8%) | 5 (4.6%) |
| $22,500 to $24,999 | 13 (10.6%) | 12 (11.1%) |
| $25,000 to $29,999 | 3 (2.4%) | 11 (10.2%) |
| $30,000 to $34,999 | 11 (8.9%) | 9 (8.3%) |
| $35,000 to $39,999 | 3 (2.4%) | 5 (4.6%) |
| $40,000 to $44,999 | 12 (9.8%) | 6 (5.6%) |
| $45,000 to $49,999 | 6 (4.9%) | 0 (0.0%) |
| $50,000 to $54,999 | 8 (6.5%) | 0 (0.0%) |
| $55,000 to $64,999 | 11 (8.9%) | 8 (7.4%) |
| $65,000 to $74,999 | 14 (11.4%) | 11 (10.2%) |
| $75,000 to $99,999 | 4 (3.3%) | 0 (0.0%) |
| $100,000+ | 3 (2.4%) | 0 (0.0%) |
| Total | 123 (100.0%) | 108 (100.0%) |
Earnings by Sex by Educational Attainment in Edgewood
Average earnings in Edgewood are $40,833 for men and $24,250 for women, a difference of 40.6%. Men with an educational attainment of college or associate's degree enjoy the highest average annual earnings of $51,875, while those with high school diploma education earn the least with $34,219. Women with an educational attainment of bachelor's degree earn the most with the average annual earnings of $57,500, while those with college or associate's degree education have the smallest earnings of $19,375.
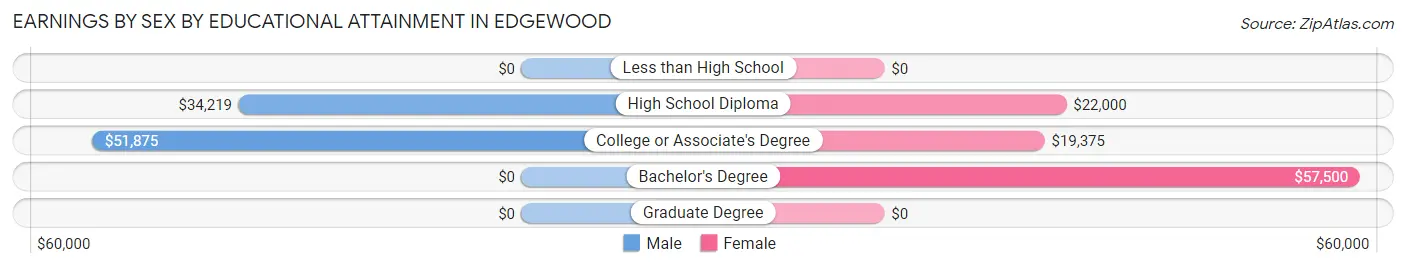
| Educational Attainment | Male Income | Female Income |
| Less than High School | - | - |
| High School Diploma | $34,219 | $22,000 |
| College or Associate's Degree | $51,875 | $19,375 |
| Bachelor's Degree | - | - |
| Graduate Degree | - | - |
| Total | $40,833 | $24,250 |
Family Income in Edgewood
Family Income Brackets in Edgewood
According to the Edgewood family income data, there are 29 families falling into the $50,000 to $74,999 income range, which is the most common income bracket and makes up 21.2% of all families. Conversely, the $200,000+ income bracket is the least frequent group with only 2 families (1.5%) belonging to this category.
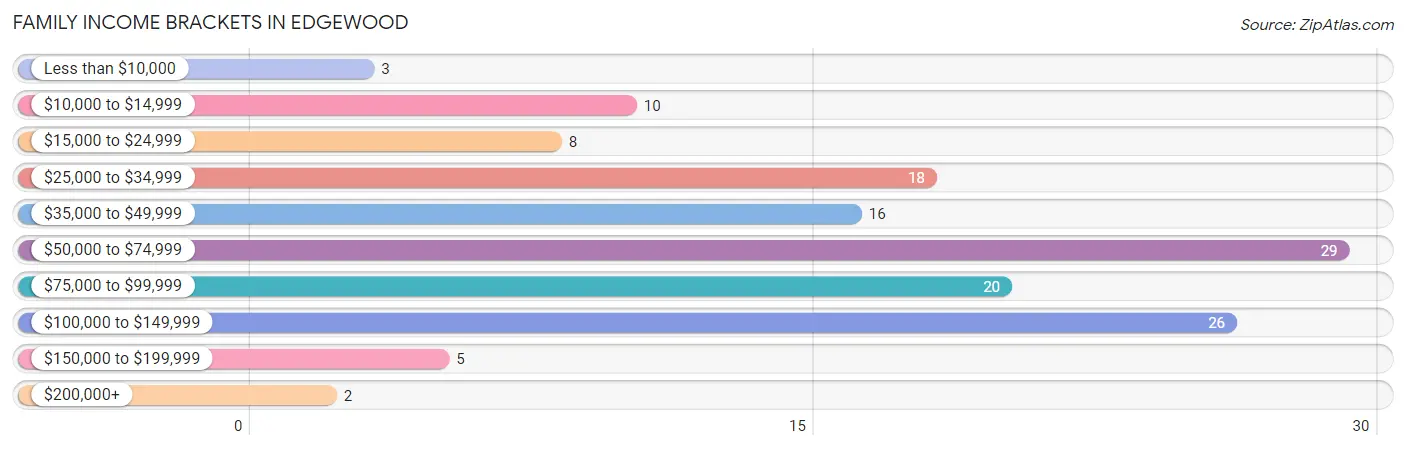
| Income Bracket | # Families | % Families |
| Less than $10,000 | 3 | 2.2% |
| $10,000 to $14,999 | 10 | 7.3% |
| $15,000 to $24,999 | 8 | 5.8% |
| $25,000 to $34,999 | 18 | 13.1% |
| $35,000 to $49,999 | 16 | 11.7% |
| $50,000 to $74,999 | 29 | 21.2% |
| $75,000 to $99,999 | 20 | 14.6% |
| $100,000 to $149,999 | 26 | 19.0% |
| $150,000 to $199,999 | 5 | 3.6% |
| $200,000+ | 2 | 1.5% |
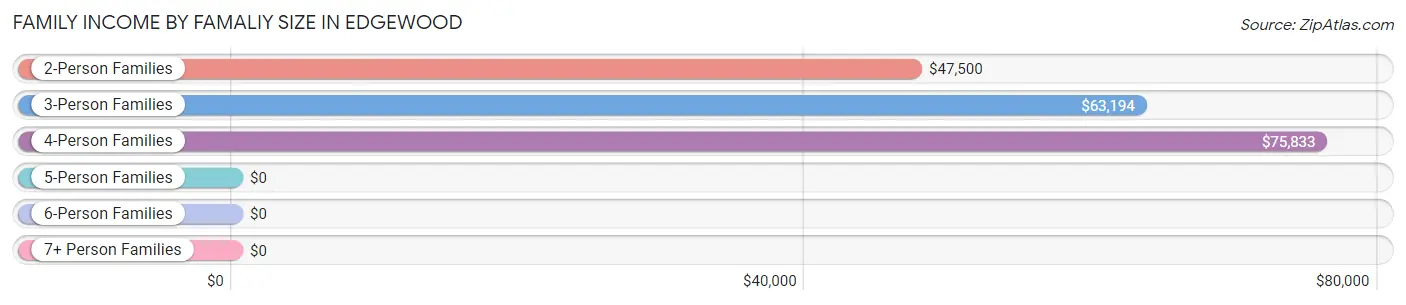
Family Income by Famaliy Size in Edgewood
4-person families (18 | 13.1%) account for the highest median family income in Edgewood with $75,833 per family, while 2-person families (76 | 55.5%) have the highest median income of $23,750 per family member.
| Income Bracket | # Families | Median Income |
| 2-Person Families | 76 (55.5%) | $47,500 |
| 3-Person Families | 37 (27.0%) | $63,194 |
| 4-Person Families | 18 (13.1%) | $75,833 |
| 5-Person Families | 6 (4.4%) | $0 |
| 6-Person Families | 0 (0.0%) | $0 |
| 7+ Person Families | 0 (0.0%) | $0 |
| Total | 137 (100.0%) | $61,875 |
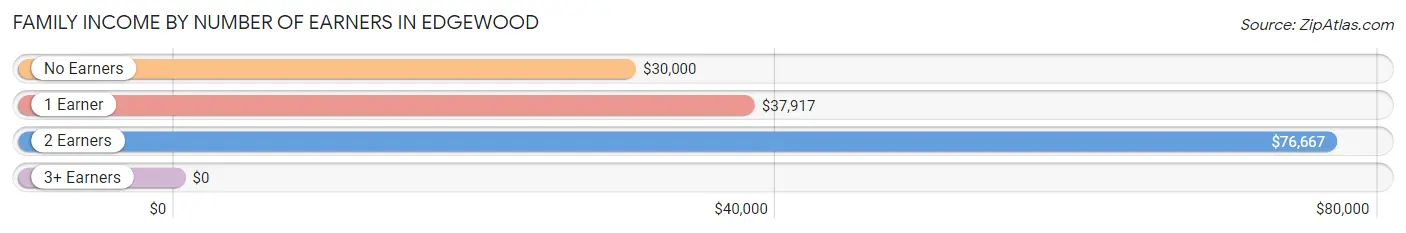
Family Income by Number of Earners in Edgewood
| Number of Earners | # Families | Median Income |
| No Earners | 28 (20.4%) | $30,000 |
| 1 Earner | 27 (19.7%) | $37,917 |
| 2 Earners | 74 (54.0%) | $76,667 |
| 3+ Earners | 8 (5.8%) | $0 |
| Total | 137 (100.0%) | $61,875 |
Household Income in Edgewood
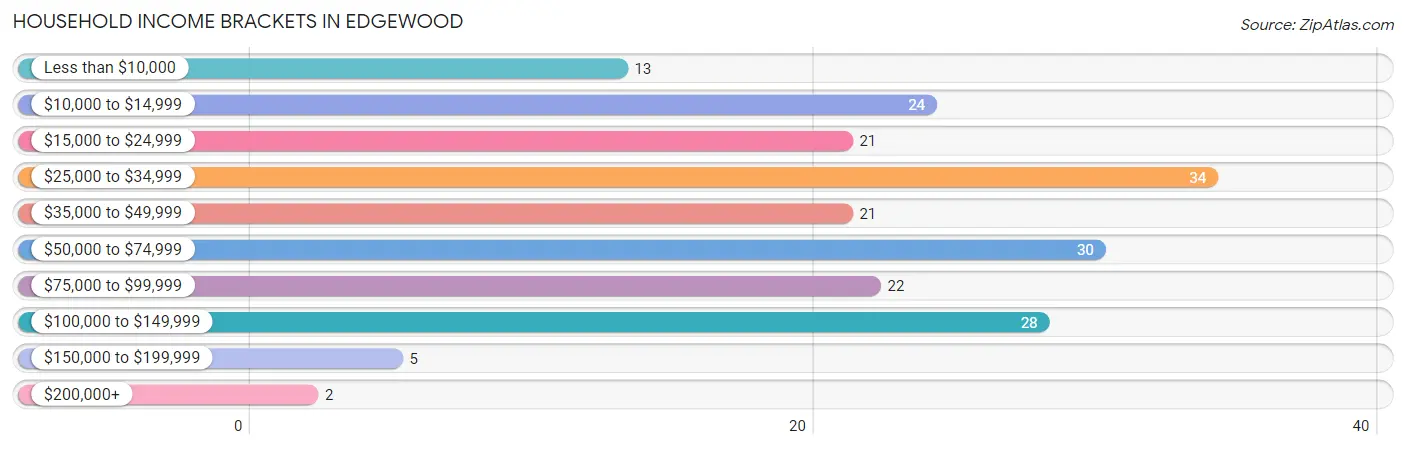
Household Income Brackets in Edgewood
With 34 households falling in the category, the $25,000 to $34,999 income range is the most frequent in Edgewood, accounting for 17.0% of all households. In contrast, only 2 households (1.0%) fall into the $200,000+ income bracket, making it the least populous group.
| Income Bracket | # Households | % Households |
| Less than $10,000 | 13 | 6.5% |
| $10,000 to $14,999 | 24 | 12.0% |
| $15,000 to $24,999 | 21 | 10.5% |
| $25,000 to $34,999 | 34 | 17.0% |
| $35,000 to $49,999 | 21 | 10.5% |
| $50,000 to $74,999 | 30 | 15.0% |
| $75,000 to $99,999 | 22 | 11.0% |
| $100,000 to $149,999 | 28 | 14.0% |
| $150,000 to $199,999 | 5 | 2.5% |
| $200,000+ | 2 | 1.0% |
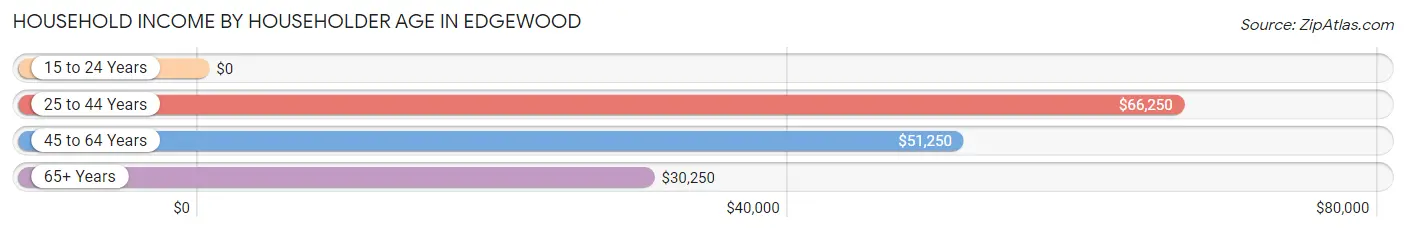
Household Income by Householder Age in Edgewood
The median household income in Edgewood is $41,250, with the highest median household income of $66,250 found in the 25 to 44 years age bracket for the primary householder. A total of 48 households (24.0%) fall into this category. Meanwhile, the 15 to 24 years age bracket for the primary householder has the lowest median household income of $0, with 29 households (14.5%) in this group.
| Income Bracket | # Households | Median Income |
| 15 to 24 Years | 29 (14.5%) | $0 |
| 25 to 44 Years | 48 (24.0%) | $66,250 |
| 45 to 64 Years | 78 (39.0%) | $51,250 |
| 65+ Years | 45 (22.5%) | $30,250 |
| Total | 200 (100.0%) | $41,250 |
Poverty in Edgewood
Income Below Poverty by Sex and Age in Edgewood
With 15.1% poverty level for males and 16.9% for females among the residents of Edgewood, 35 to 44 year old males and 6 to 11 year old females are the most vulnerable to poverty, with 8 males (88.9%) and 5 females (50.0%) in their respective age groups living below the poverty level.
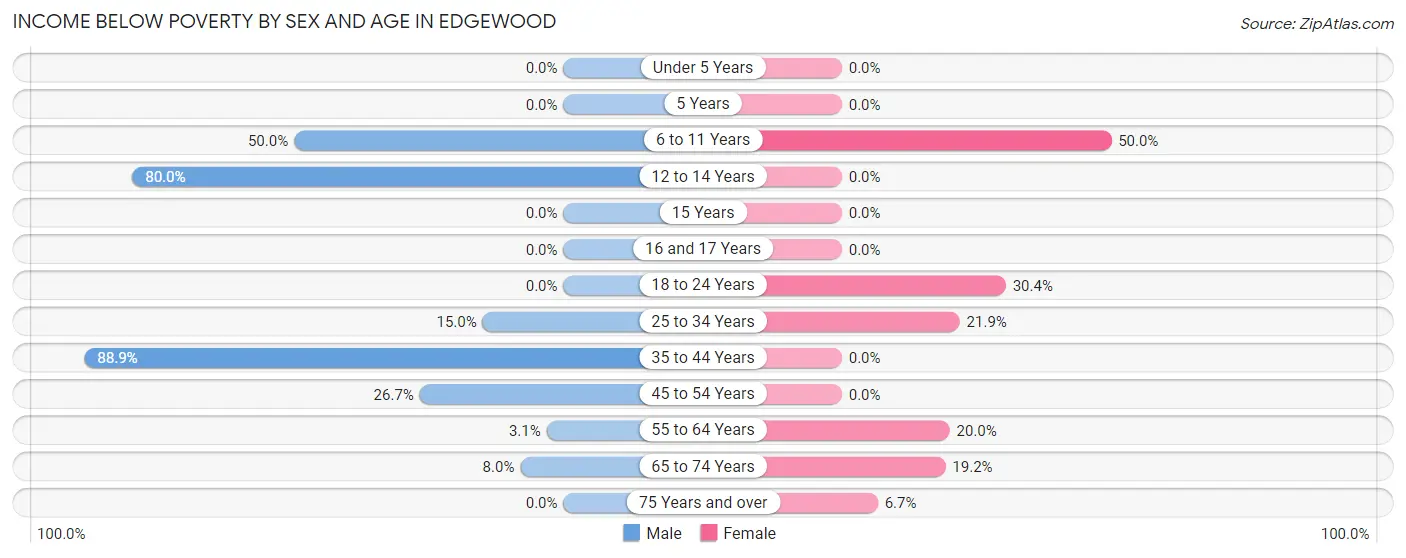
| Age Bracket | Male | Female |
| Under 5 Years | 0 (0.0%) | 0 (0.0%) |
| 5 Years | 0 (0.0%) | 0 (0.0%) |
| 6 to 11 Years | 4 (50.0%) | 5 (50.0%) |
| 12 to 14 Years | 4 (80.0%) | 0 (0.0%) |
| 15 Years | 0 (0.0%) | 0 (0.0%) |
| 16 and 17 Years | 0 (0.0%) | 0 (0.0%) |
| 18 to 24 Years | 0 (0.0%) | 7 (30.4%) |
| 25 to 34 Years | 6 (15.0%) | 7 (21.9%) |
| 35 to 44 Years | 8 (88.9%) | 0 (0.0%) |
| 45 to 54 Years | 8 (26.7%) | 0 (0.0%) |
| 55 to 64 Years | 1 (3.1%) | 10 (20.0%) |
| 65 to 74 Years | 2 (8.0%) | 5 (19.2%) |
| 75 Years and over | 0 (0.0%) | 1 (6.7%) |
| Total | 33 (15.1%) | 35 (16.9%) |
Income Above Poverty by Sex and Age in Edgewood
According to the poverty statistics in Edgewood, males aged under 5 years and females aged under 5 years are the age groups that are most secure financially, with 100.0% of males and 100.0% of females in these age groups living above the poverty line.
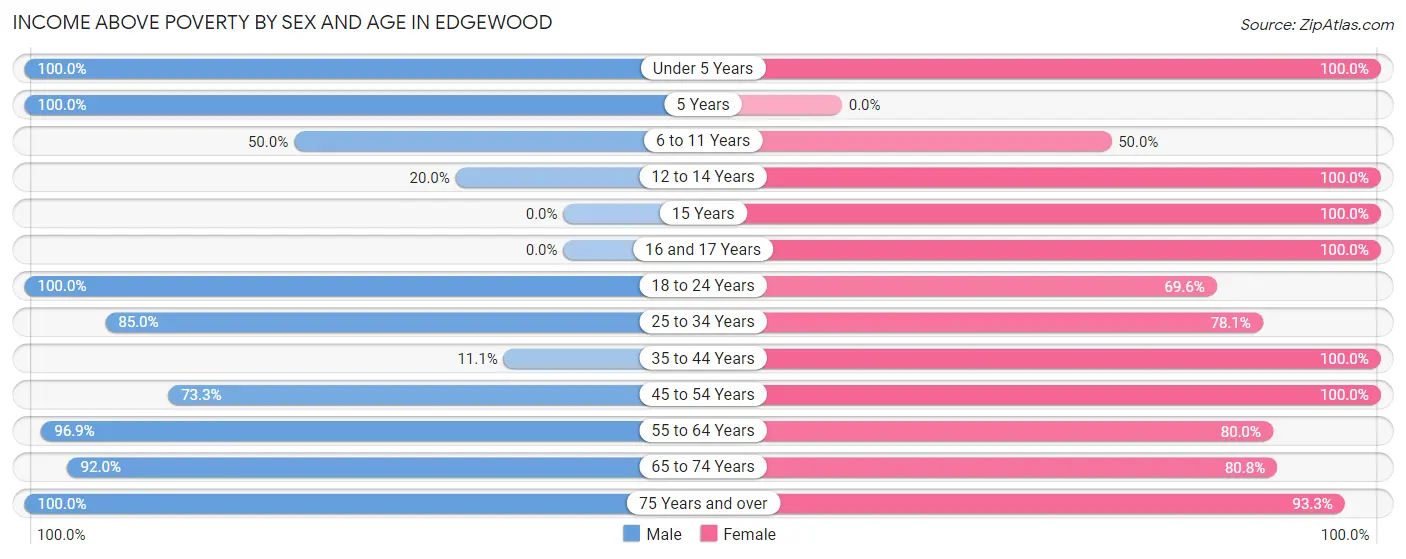
| Age Bracket | Male | Female |
| Under 5 Years | 24 (100.0%) | 13 (100.0%) |
| 5 Years | 2 (100.0%) | 0 (0.0%) |
| 6 to 11 Years | 4 (50.0%) | 5 (50.0%) |
| 12 to 14 Years | 1 (20.0%) | 2 (100.0%) |
| 15 Years | 0 (0.0%) | 3 (100.0%) |
| 16 and 17 Years | 0 (0.0%) | 7 (100.0%) |
| 18 to 24 Years | 32 (100.0%) | 16 (69.6%) |
| 25 to 34 Years | 34 (85.0%) | 25 (78.1%) |
| 35 to 44 Years | 1 (11.1%) | 19 (100.0%) |
| 45 to 54 Years | 22 (73.3%) | 7 (100.0%) |
| 55 to 64 Years | 31 (96.9%) | 40 (80.0%) |
| 65 to 74 Years | 23 (92.0%) | 21 (80.8%) |
| 75 Years and over | 12 (100.0%) | 14 (93.3%) |
| Total | 186 (84.9%) | 172 (83.1%) |
Income Below Poverty Among Married-Couple Families in Edgewood
The poverty statistics for married-couple families in Edgewood show that 5.8% or 6 of the total 103 families live below the poverty line. Families with 1 or 2 children have the highest poverty rate of 14.7%, comprising of 5 families. On the other hand, families with 3 or 4 children have the lowest poverty rate of 0.0%, which includes 0 families.
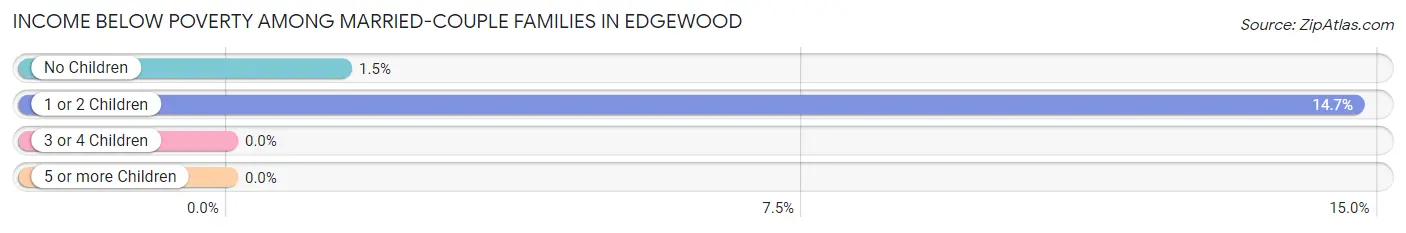
| Children | Above Poverty | Below Poverty |
| No Children | 66 (98.5%) | 1 (1.5%) |
| 1 or 2 Children | 29 (85.3%) | 5 (14.7%) |
| 3 or 4 Children | 2 (100.0%) | 0 (0.0%) |
| 5 or more Children | 0 (0.0%) | 0 (0.0%) |
| Total | 97 (94.2%) | 6 (5.8%) |
Income Below Poverty Among Single-Parent Households in Edgewood
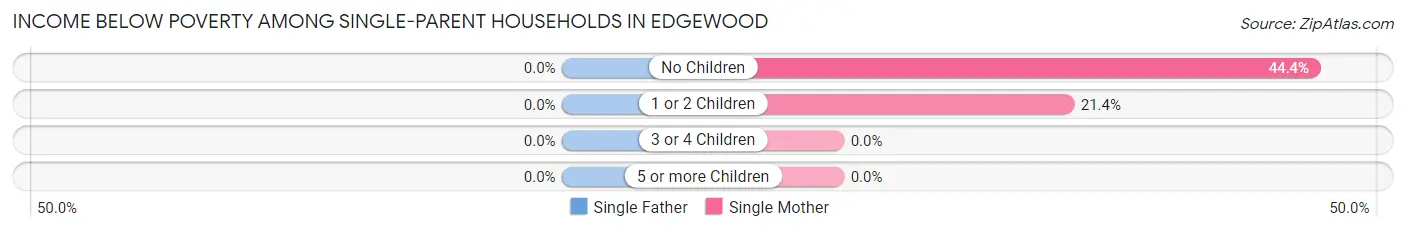
| Children | Single Father | Single Mother |
| No Children | 0 (0.0%) | 4 (44.4%) |
| 1 or 2 Children | 0 (0.0%) | 3 (21.4%) |
| 3 or 4 Children | 0 (0.0%) | 0 (0.0%) |
| 5 or more Children | 0 (0.0%) | 0 (0.0%) |
| Total | 0 (0.0%) | 7 (30.4%) |
Income Below Poverty Among Married-Couple vs Single-Parent Households in Edgewood
The poverty data for Edgewood shows that 6 of the married-couple family households (5.8%) and 7 of the single-parent households (20.6%) are living below the poverty level. Within the married-couple family households, those with 1 or 2 children have the highest poverty rate, with 5 households (14.7%) falling below the poverty line. Among the single-parent households, those with no children have the highest poverty rate, with 4 household (28.6%) living below poverty.
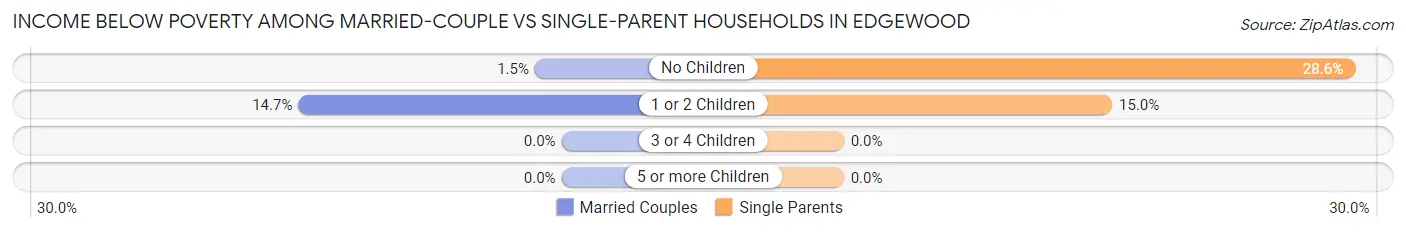
| Children | Married-Couple Families | Single-Parent Households |
| No Children | 1 (1.5%) | 4 (28.6%) |
| 1 or 2 Children | 5 (14.7%) | 3 (15.0%) |
| 3 or 4 Children | 0 (0.0%) | 0 (0.0%) |
| 5 or more Children | 0 (0.0%) | 0 (0.0%) |
| Total | 6 (5.8%) | 7 (20.6%) |
Employment Characteristics in Edgewood
Employment by Class of Employer in Edgewood
Among the 210 employed individuals in Edgewood, private company employees (176 | 83.8%), not-for-profit organizations (20 | 9.5%), and state government employees (6 | 2.9%) make up the most common classes of employment.
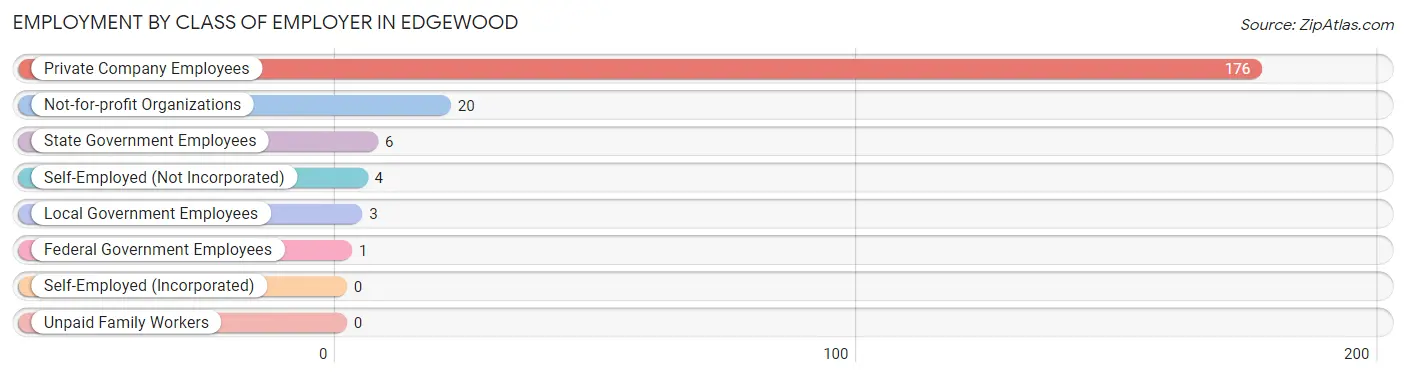
| Employer Class | # Employees | % Employees |
| Private Company Employees | 176 | 83.8% |
| Self-Employed (Incorporated) | 0 | 0.0% |
| Self-Employed (Not Incorporated) | 4 | 1.9% |
| Not-for-profit Organizations | 20 | 9.5% |
| Local Government Employees | 3 | 1.4% |
| State Government Employees | 6 | 2.9% |
| Federal Government Employees | 1 | 0.5% |
| Unpaid Family Workers | 0 | 0.0% |
| Total | 210 | 100.0% |
Employment Status by Age in Edgewood
According to the labor force statistics for Edgewood, out of the total population over 16 years of age (359), 61.8% or 222 individuals are in the labor force, with 5.4% or 12 of them unemployed. The age group with the highest labor force participation rate is 20 to 24 years, with 100.0% or 40 individuals in the labor force. Within the labor force, the 60 to 64 years age range has the highest percentage of unemployed individuals, with 27.8% or 5 of them being unemployed.
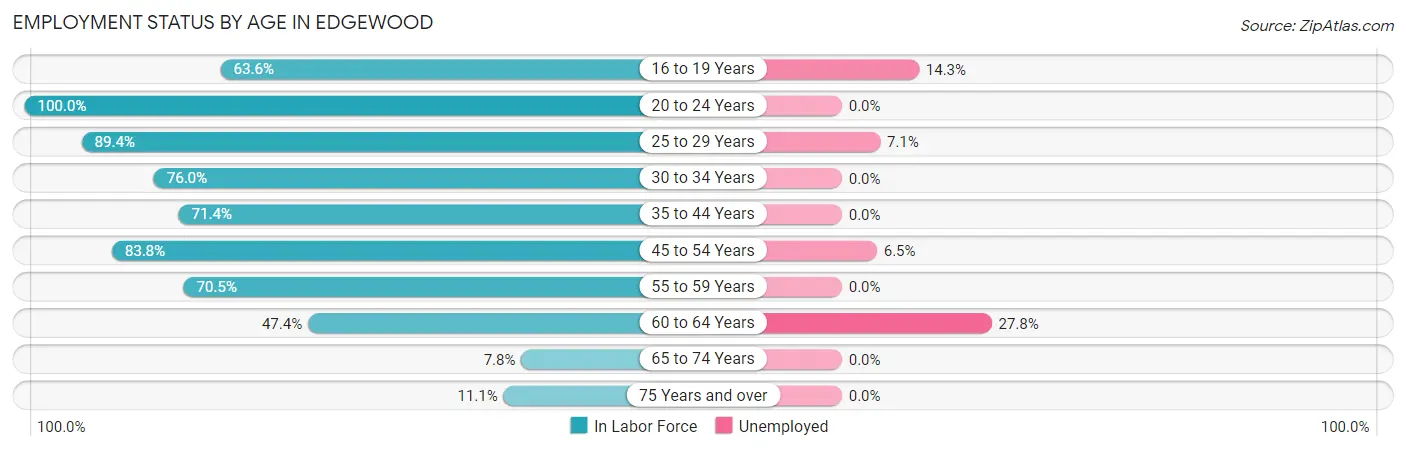
| Age Bracket | In Labor Force | Unemployed |
| 16 to 19 Years | 14 (63.6%) | 2 (14.3%) |
| 20 to 24 Years | 40 (100.0%) | 0 (0.0%) |
| 25 to 29 Years | 42 (89.4%) | 3 (7.1%) |
| 30 to 34 Years | 19 (76.0%) | 0 (0.0%) |
| 35 to 44 Years | 20 (71.4%) | 0 (0.0%) |
| 45 to 54 Years | 31 (83.8%) | 2 (6.5%) |
| 55 to 59 Years | 31 (70.5%) | 0 (0.0%) |
| 60 to 64 Years | 18 (47.4%) | 5 (27.8%) |
| 65 to 74 Years | 4 (7.8%) | 0 (0.0%) |
| 75 Years and over | 3 (11.1%) | 0 (0.0%) |
| Total | 222 (61.8%) | 12 (5.4%) |
Employment Status by Educational Attainment in Edgewood
According to labor force statistics for Edgewood, 73.5% of individuals (161) out of the total population between 25 and 64 years of age (219) are in the labor force, with 6.2% or 10 of them being unemployed. The group with the highest labor force participation rate are those with the educational attainment of bachelor's degree or higher, with 100.0% or 21 individuals in the labor force. Within the labor force, individuals with less than high school education have the highest percentage of unemployment, with 33.3% or 3 of them being unemployed.
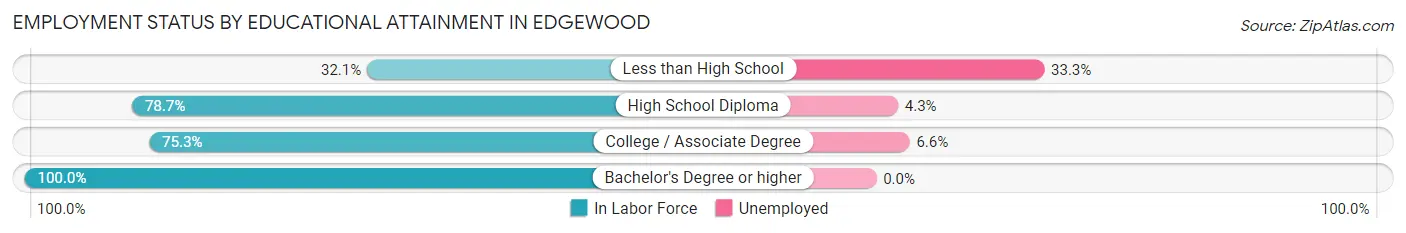
| Educational Attainment | In Labor Force | Unemployed |
| Less than High School | 9 (32.1%) | 9 (33.3%) |
| High School Diploma | 70 (78.7%) | 4 (4.3%) |
| College / Associate Degree | 61 (75.3%) | 5 (6.6%) |
| Bachelor's Degree or higher | 21 (100.0%) | 0 (0.0%) |
| Total | 161 (73.5%) | 14 (6.2%) |
Employment Occupations by Sex in Edgewood
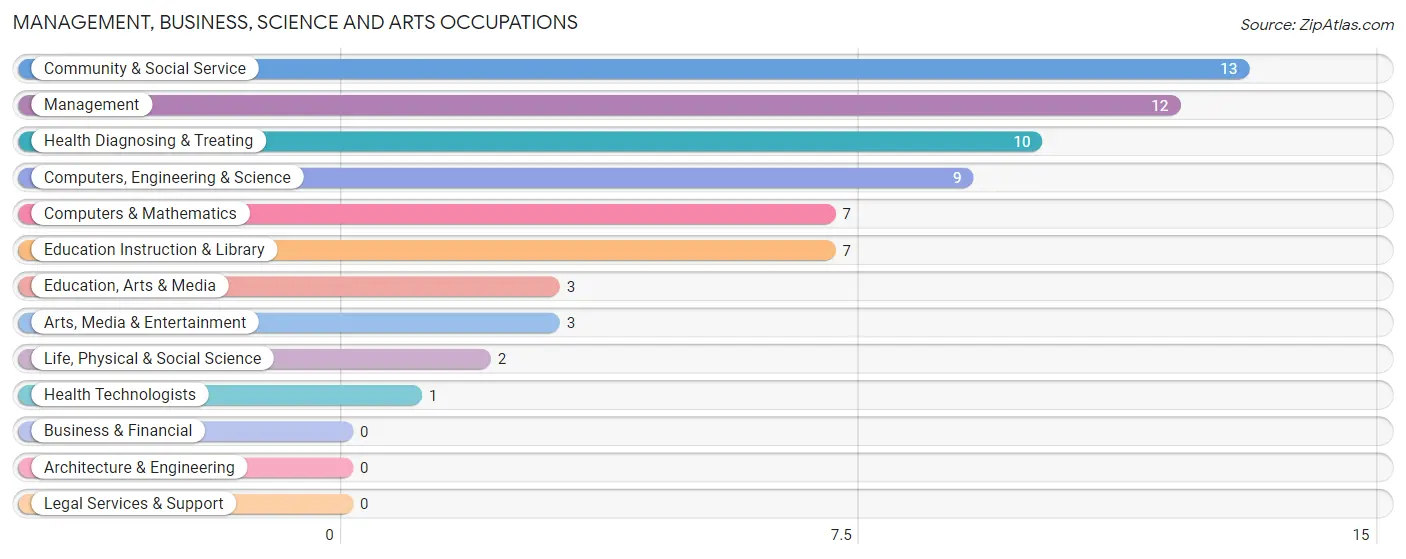
Management, Business, Science and Arts Occupations
The most common Management, Business, Science and Arts occupations in Edgewood are Community & Social Service (13 | 6.2%), Management (12 | 5.7%), Health Diagnosing & Treating (10 | 4.8%), Computers, Engineering & Science (9 | 4.3%), and Computers & Mathematics (7 | 3.3%).
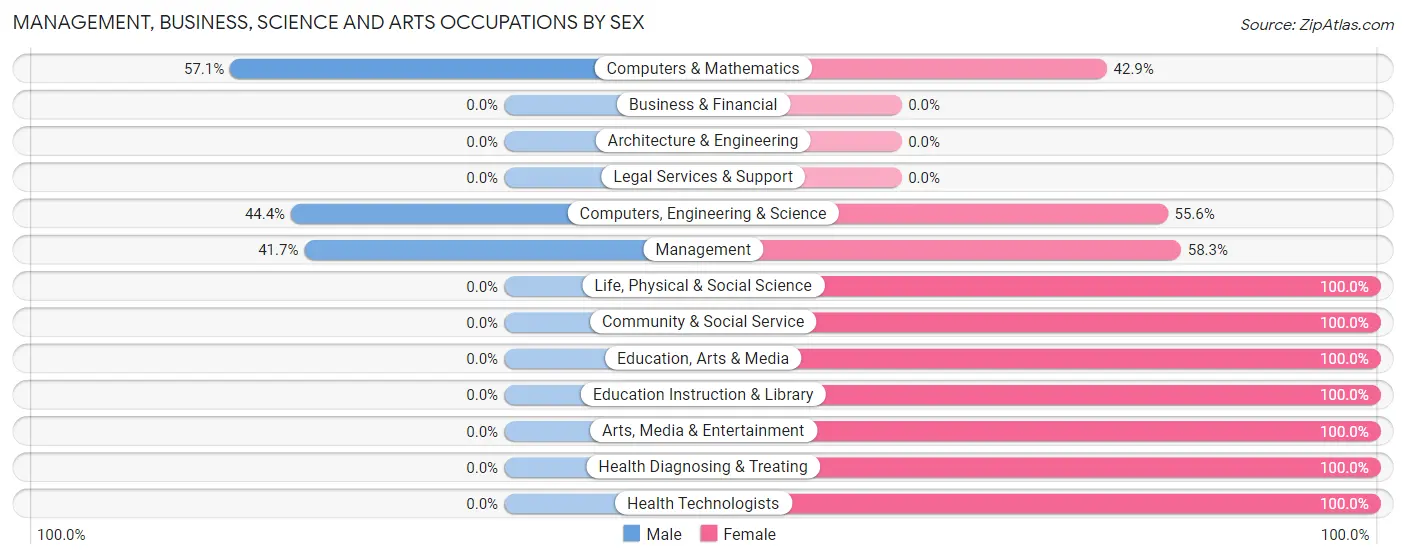
Management, Business, Science and Arts Occupations by Sex
Within the Management, Business, Science and Arts occupations in Edgewood, the most male-oriented occupations are Computers & Mathematics (57.1%), Computers, Engineering & Science (44.4%), and Management (41.7%), while the most female-oriented occupations are Life, Physical & Social Science (100.0%), Community & Social Service (100.0%), and Education, Arts & Media (100.0%).
| Occupation | Male | Female |
| Management | 5 (41.7%) | 7 (58.3%) |
| Business & Financial | 0 (0.0%) | 0 (0.0%) |
| Computers, Engineering & Science | 4 (44.4%) | 5 (55.6%) |
| Computers & Mathematics | 4 (57.1%) | 3 (42.9%) |
| Architecture & Engineering | 0 (0.0%) | 0 (0.0%) |
| Life, Physical & Social Science | 0 (0.0%) | 2 (100.0%) |
| Community & Social Service | 0 (0.0%) | 13 (100.0%) |
| Education, Arts & Media | 0 (0.0%) | 3 (100.0%) |
| Legal Services & Support | 0 (0.0%) | 0 (0.0%) |
| Education Instruction & Library | 0 (0.0%) | 7 (100.0%) |
| Arts, Media & Entertainment | 0 (0.0%) | 3 (100.0%) |
| Health Diagnosing & Treating | 0 (0.0%) | 10 (100.0%) |
| Health Technologists | 0 (0.0%) | 1 (100.0%) |
| Total (Category) | 9 (20.4%) | 35 (79.5%) |
| Total (Overall) | 109 (51.9%) | 101 (48.1%) |
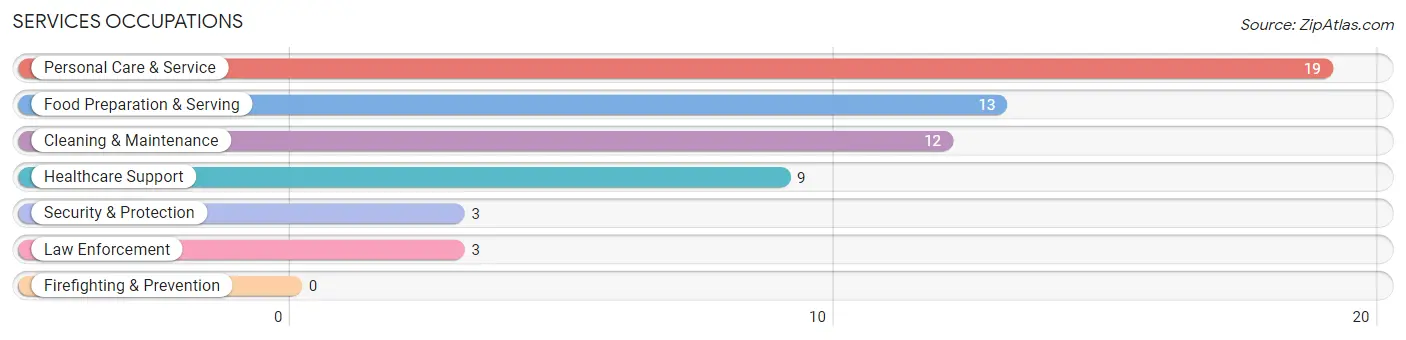
Services Occupations
The most common Services occupations in Edgewood are Personal Care & Service (19 | 9.0%), Food Preparation & Serving (13 | 6.2%), Cleaning & Maintenance (12 | 5.7%), Healthcare Support (9 | 4.3%), and Security & Protection (3 | 1.4%).
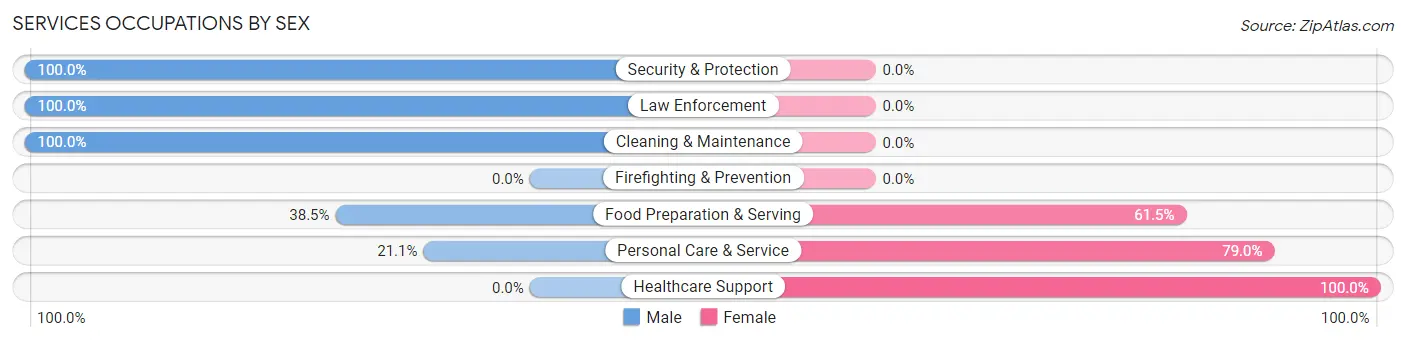
Services Occupations by Sex
Within the Services occupations in Edgewood, the most male-oriented occupations are Security & Protection (100.0%), Law Enforcement (100.0%), and Cleaning & Maintenance (100.0%), while the most female-oriented occupations are Healthcare Support (100.0%), Personal Care & Service (78.9%), and Food Preparation & Serving (61.5%).
| Occupation | Male | Female |
| Healthcare Support | 0 (0.0%) | 9 (100.0%) |
| Security & Protection | 3 (100.0%) | 0 (0.0%) |
| Firefighting & Prevention | 0 (0.0%) | 0 (0.0%) |
| Law Enforcement | 3 (100.0%) | 0 (0.0%) |
| Food Preparation & Serving | 5 (38.5%) | 8 (61.5%) |
| Cleaning & Maintenance | 12 (100.0%) | 0 (0.0%) |
| Personal Care & Service | 4 (21.0%) | 15 (78.9%) |
| Total (Category) | 24 (42.9%) | 32 (57.1%) |
| Total (Overall) | 109 (51.9%) | 101 (48.1%) |
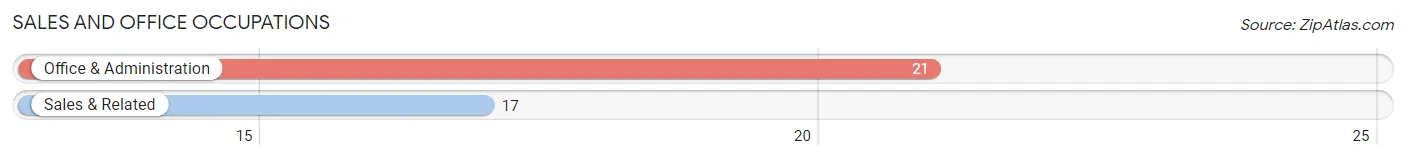
Sales and Office Occupations
The most common Sales and Office occupations in Edgewood are Office & Administration (21 | 10.0%), and Sales & Related (17 | 8.1%).
Sales and Office Occupations by Sex
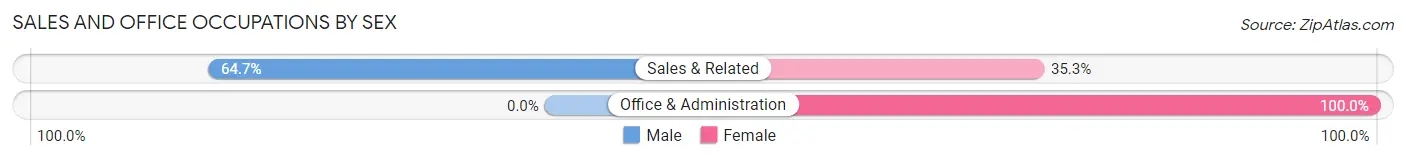
| Occupation | Male | Female |
| Sales & Related | 11 (64.7%) | 6 (35.3%) |
| Office & Administration | 0 (0.0%) | 21 (100.0%) |
| Total (Category) | 11 (28.9%) | 27 (71.1%) |
| Total (Overall) | 109 (51.9%) | 101 (48.1%) |
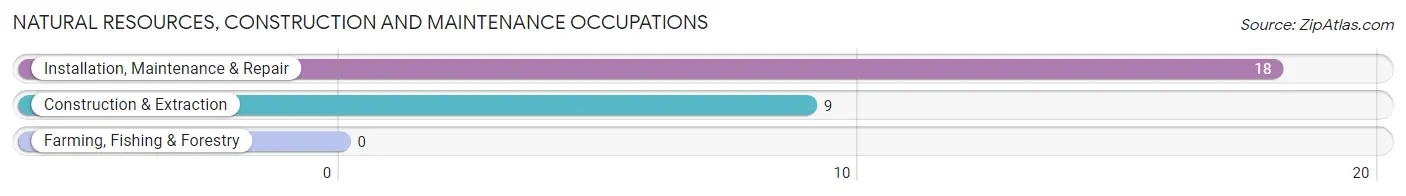
Natural Resources, Construction and Maintenance Occupations
The most common Natural Resources, Construction and Maintenance occupations in Edgewood are Installation, Maintenance & Repair (18 | 8.6%), and Construction & Extraction (9 | 4.3%).
Natural Resources, Construction and Maintenance Occupations by Sex
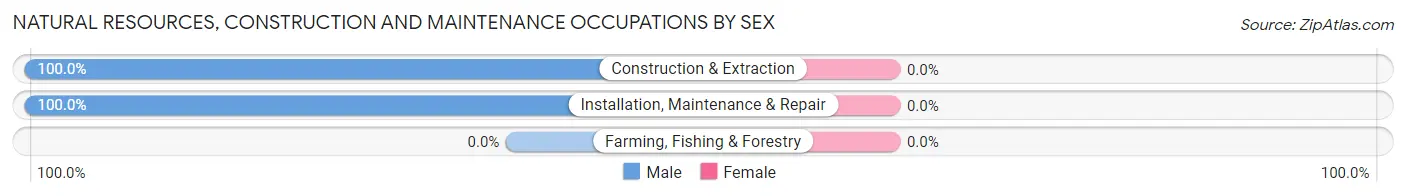
| Occupation | Male | Female |
| Farming, Fishing & Forestry | 0 (0.0%) | 0 (0.0%) |
| Construction & Extraction | 9 (100.0%) | 0 (0.0%) |
| Installation, Maintenance & Repair | 18 (100.0%) | 0 (0.0%) |
| Total (Category) | 27 (100.0%) | 0 (0.0%) |
| Total (Overall) | 109 (51.9%) | 101 (48.1%) |
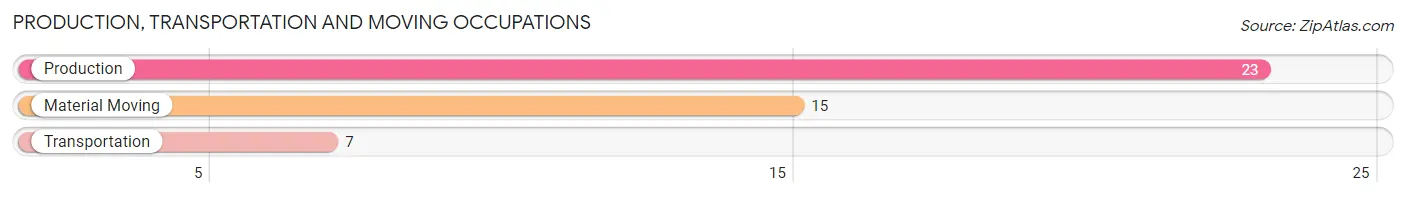
Production, Transportation and Moving Occupations
The most common Production, Transportation and Moving occupations in Edgewood are Production (23 | 11.0%), Material Moving (15 | 7.1%), and Transportation (7 | 3.3%).
Production, Transportation and Moving Occupations by Sex
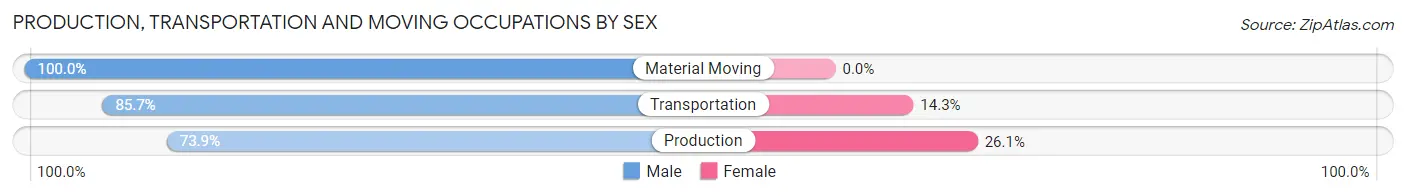
| Occupation | Male | Female |
| Production | 17 (73.9%) | 6 (26.1%) |
| Transportation | 6 (85.7%) | 1 (14.3%) |
| Material Moving | 15 (100.0%) | 0 (0.0%) |
| Total (Category) | 38 (84.4%) | 7 (15.6%) |
| Total (Overall) | 109 (51.9%) | 101 (48.1%) |
Employment Industries by Sex in Edgewood
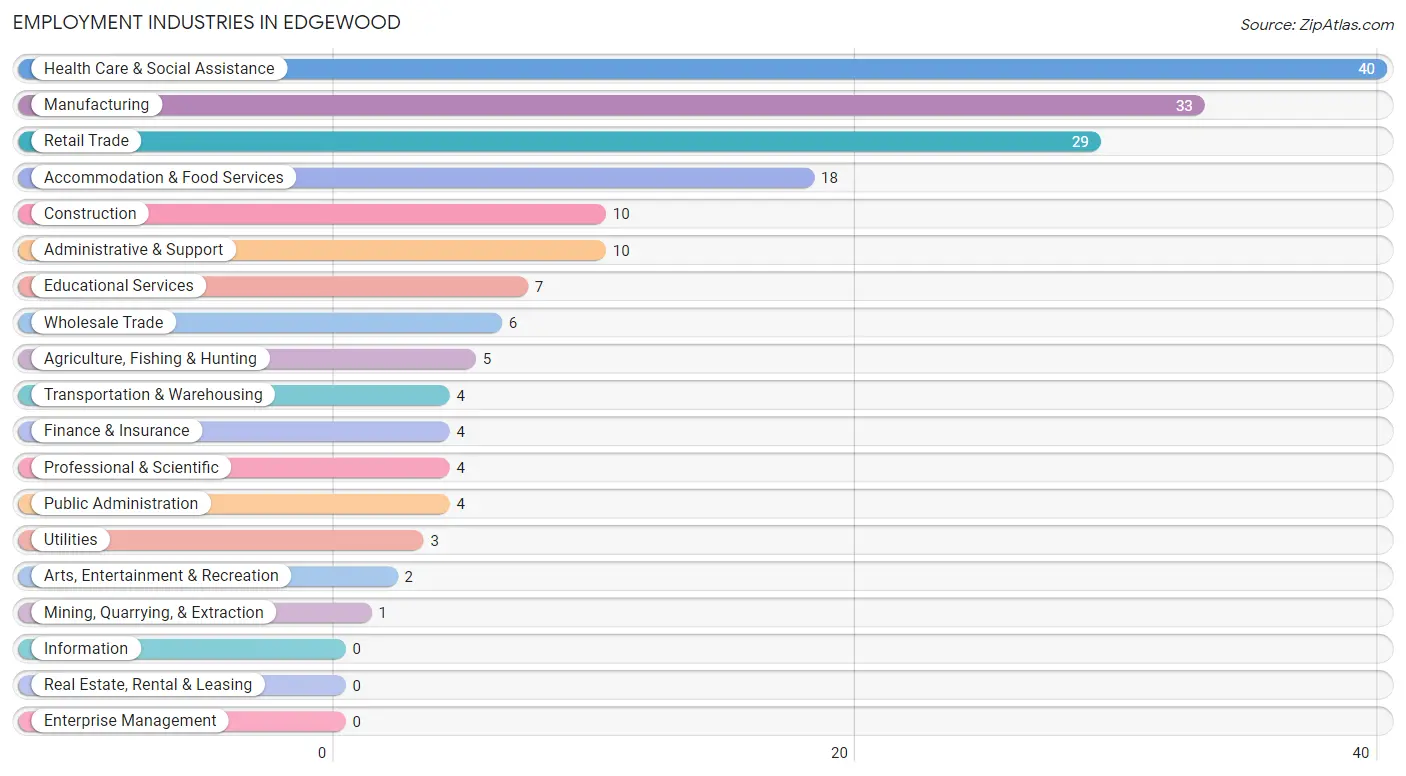
Employment Industries in Edgewood
The major employment industries in Edgewood include Health Care & Social Assistance (40 | 19.1%), Manufacturing (33 | 15.7%), Retail Trade (29 | 13.8%), Accommodation & Food Services (18 | 8.6%), and Construction (10 | 4.8%).
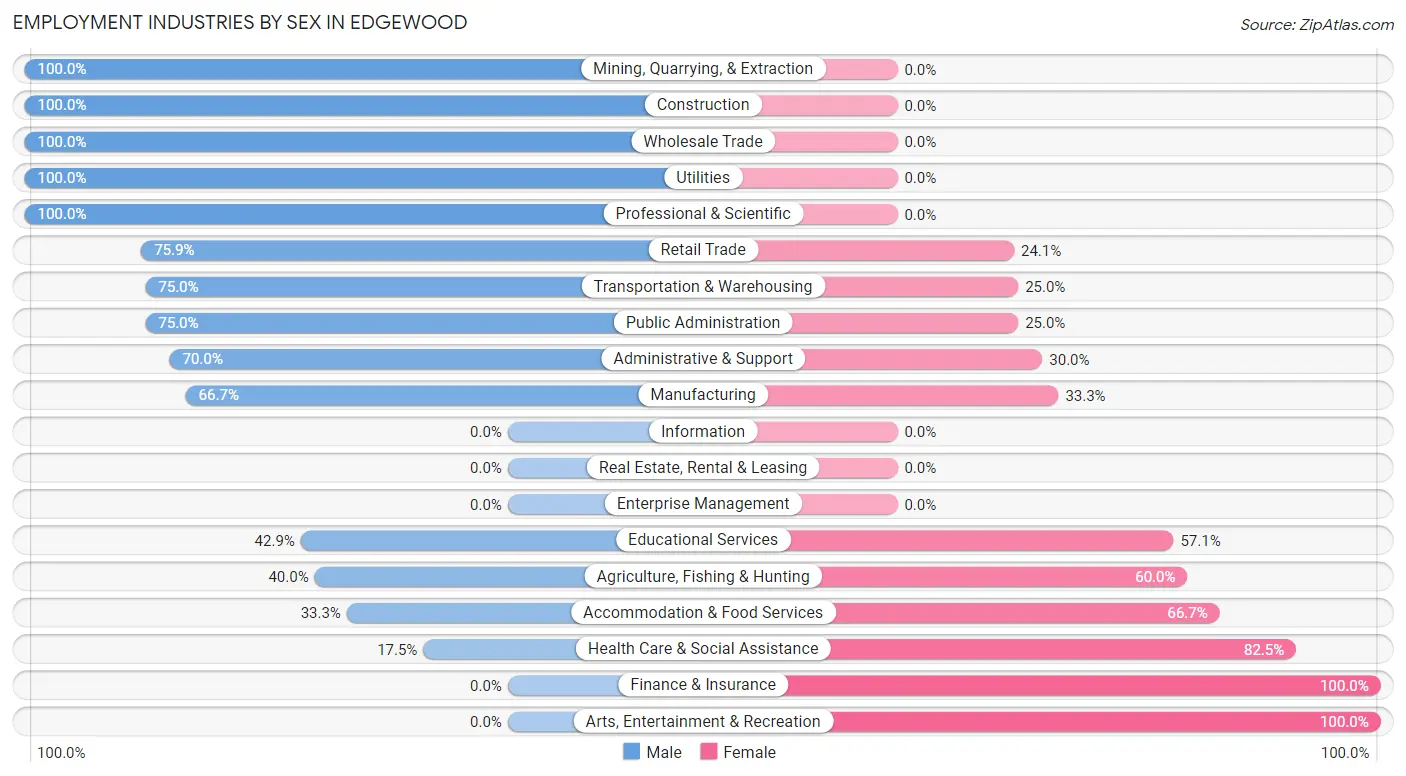
Employment Industries by Sex in Edgewood
The Edgewood industries that see more men than women are Mining, Quarrying, & Extraction (100.0%), Construction (100.0%), and Wholesale Trade (100.0%), whereas the industries that tend to have a higher number of women are Finance & Insurance (100.0%), Arts, Entertainment & Recreation (100.0%), and Health Care & Social Assistance (82.5%).
| Industry | Male | Female |
| Agriculture, Fishing & Hunting | 2 (40.0%) | 3 (60.0%) |
| Mining, Quarrying, & Extraction | 1 (100.0%) | 0 (0.0%) |
| Construction | 10 (100.0%) | 0 (0.0%) |
| Manufacturing | 22 (66.7%) | 11 (33.3%) |
| Wholesale Trade | 6 (100.0%) | 0 (0.0%) |
| Retail Trade | 22 (75.9%) | 7 (24.1%) |
| Transportation & Warehousing | 3 (75.0%) | 1 (25.0%) |
| Utilities | 3 (100.0%) | 0 (0.0%) |
| Information | 0 (0.0%) | 0 (0.0%) |
| Finance & Insurance | 0 (0.0%) | 4 (100.0%) |
| Real Estate, Rental & Leasing | 0 (0.0%) | 0 (0.0%) |
| Professional & Scientific | 4 (100.0%) | 0 (0.0%) |
| Enterprise Management | 0 (0.0%) | 0 (0.0%) |
| Administrative & Support | 7 (70.0%) | 3 (30.0%) |
| Educational Services | 3 (42.9%) | 4 (57.1%) |
| Health Care & Social Assistance | 7 (17.5%) | 33 (82.5%) |
| Arts, Entertainment & Recreation | 0 (0.0%) | 2 (100.0%) |
| Accommodation & Food Services | 6 (33.3%) | 12 (66.7%) |
| Public Administration | 3 (75.0%) | 1 (25.0%) |
| Total | 109 (51.9%) | 101 (48.1%) |
Education in Edgewood
School Enrollment in Edgewood
The most common levels of schooling among the 60 students in Edgewood are high school (18 | 30.0%), college / undergraduate (16 | 26.7%), and elementary school (13 | 21.7%).
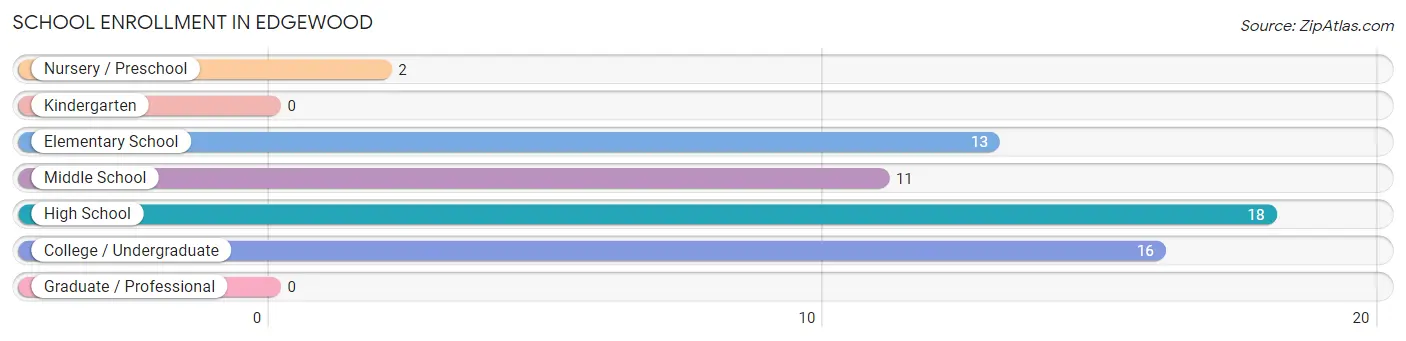
| School Level | # Students | % Students |
| Nursery / Preschool | 2 | 3.3% |
| Kindergarten | 0 | 0.0% |
| Elementary School | 13 | 21.7% |
| Middle School | 11 | 18.3% |
| High School | 18 | 30.0% |
| College / Undergraduate | 16 | 26.7% |
| Graduate / Professional | 0 | 0.0% |
| Total | 60 | 100.0% |
School Enrollment by Age by Funding Source in Edgewood
Out of a total of 60 students who are enrolled in schools in Edgewood, 13 (21.7%) attend a private institution, while the remaining 47 (78.3%) are enrolled in public schools. The age group of 25 to 34 year olds has the highest likelihood of being enrolled in private schools, with 5 (55.6% in the age bracket) enrolled. Conversely, the age group of 18 to 19 year olds has the lowest likelihood of being enrolled in a private school, with 8 (100.0% in the age bracket) attending a public institution.
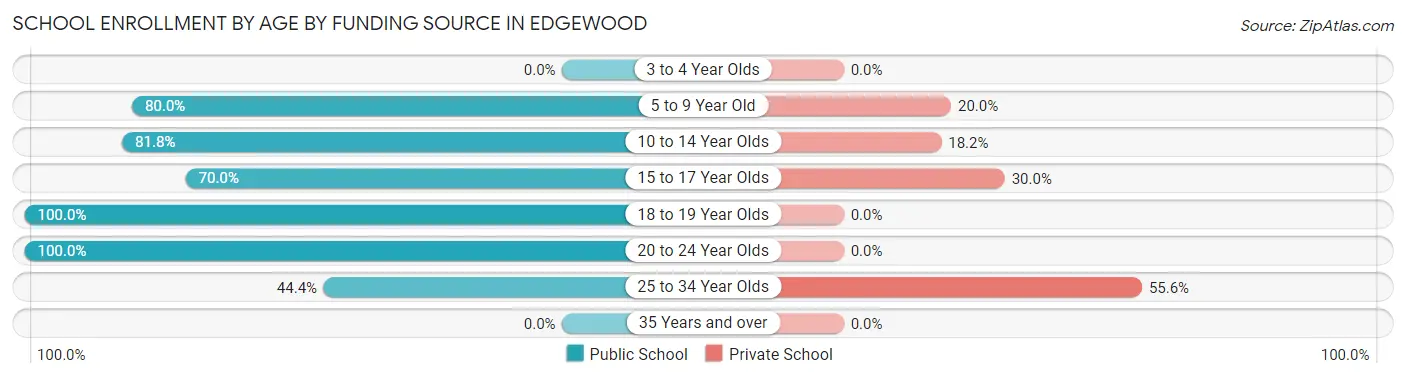
| Age Bracket | Public School | Private School |
| 3 to 4 Year Olds | 0 (0.0%) | 0 (0.0%) |
| 5 to 9 Year Old | 12 (80.0%) | 3 (20.0%) |
| 10 to 14 Year Olds | 9 (81.8%) | 2 (18.2%) |
| 15 to 17 Year Olds | 7 (70.0%) | 3 (30.0%) |
| 18 to 19 Year Olds | 8 (100.0%) | 0 (0.0%) |
| 20 to 24 Year Olds | 7 (100.0%) | 0 (0.0%) |
| 25 to 34 Year Olds | 4 (44.4%) | 5 (55.6%) |
| 35 Years and over | 0 (0.0%) | 0 (0.0%) |
| Total | 47 (78.3%) | 13 (21.7%) |
Educational Attainment by Field of Study in Edgewood
Psychology (5 | 20.8%), science & technology (5 | 20.8%), computers & mathematics (4 | 16.7%), bio, nature & agricultural (4 | 16.7%), and arts & humanities (4 | 16.7%) are the most common fields of study among 24 individuals in Edgewood who have obtained a bachelor's degree or higher.
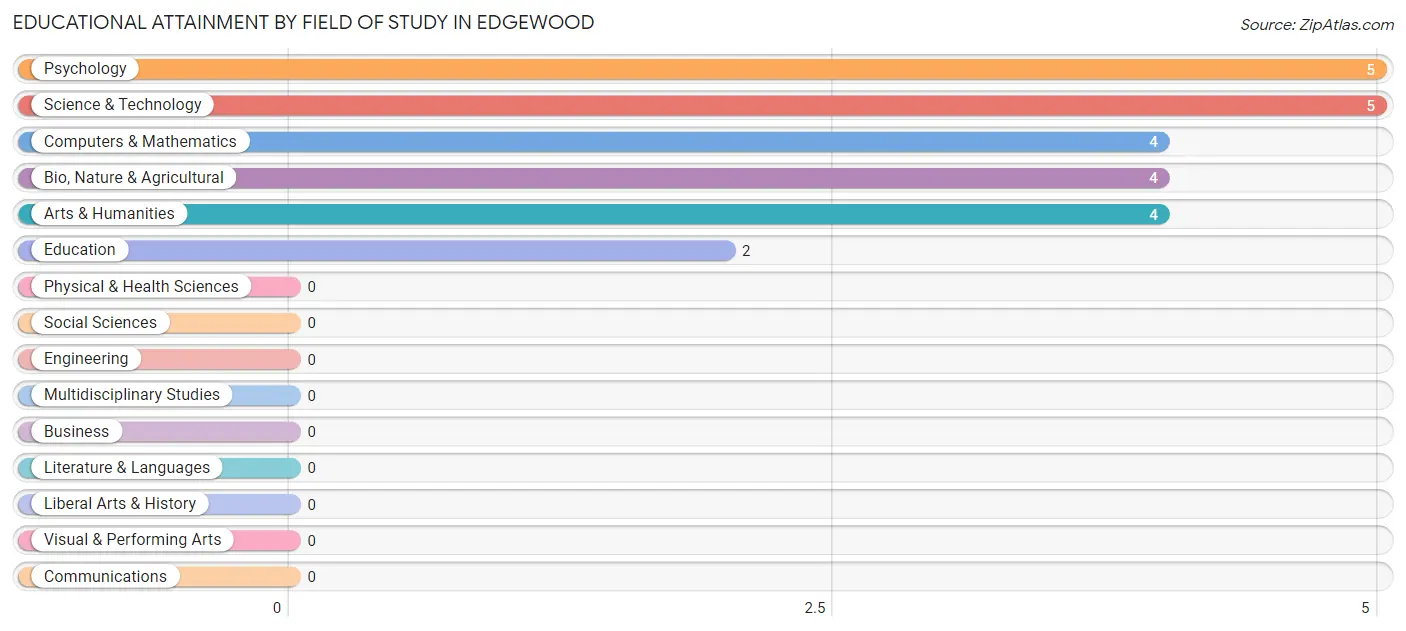
| Field of Study | # Graduates | % Graduates |
| Computers & Mathematics | 4 | 16.7% |
| Bio, Nature & Agricultural | 4 | 16.7% |
| Physical & Health Sciences | 0 | 0.0% |
| Psychology | 5 | 20.8% |
| Social Sciences | 0 | 0.0% |
| Engineering | 0 | 0.0% |
| Multidisciplinary Studies | 0 | 0.0% |
| Science & Technology | 5 | 20.8% |
| Business | 0 | 0.0% |
| Education | 2 | 8.3% |
| Literature & Languages | 0 | 0.0% |
| Liberal Arts & History | 0 | 0.0% |
| Visual & Performing Arts | 0 | 0.0% |
| Communications | 0 | 0.0% |
| Arts & Humanities | 4 | 16.7% |
| Total | 24 | 100.0% |
Transportation & Commute in Edgewood
Vehicle Availability by Sex in Edgewood
The most prevalent vehicle ownership categories in Edgewood are males with 2 vehicles (61, accounting for 56.0%) and females with 2 vehicles (57, making up 60.4%).
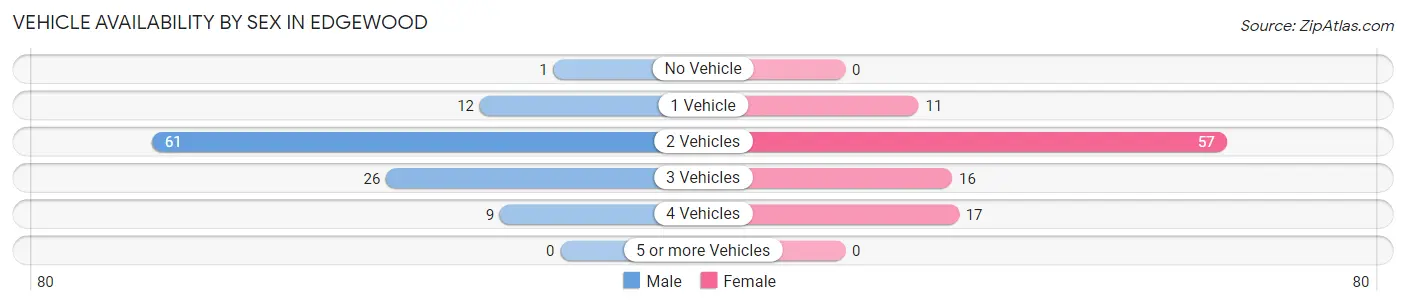
| Vehicles Available | Male | Female |
| No Vehicle | 1 (0.9%) | 0 (0.0%) |
| 1 Vehicle | 12 (11.0%) | 11 (10.9%) |
| 2 Vehicles | 61 (56.0%) | 57 (56.4%) |
| 3 Vehicles | 26 (23.8%) | 16 (15.8%) |
| 4 Vehicles | 9 (8.3%) | 17 (16.8%) |
| 5 or more Vehicles | 0 (0.0%) | 0 (0.0%) |
| Total | 109 (100.0%) | 101 (100.0%) |
Commute Time in Edgewood
The most frequently occuring commute durations in Edgewood are 20 to 24 minutes (101 commuters, 49.7%), 25 to 29 minutes (43 commuters, 21.2%), and 30 to 34 minutes (31 commuters, 15.3%).
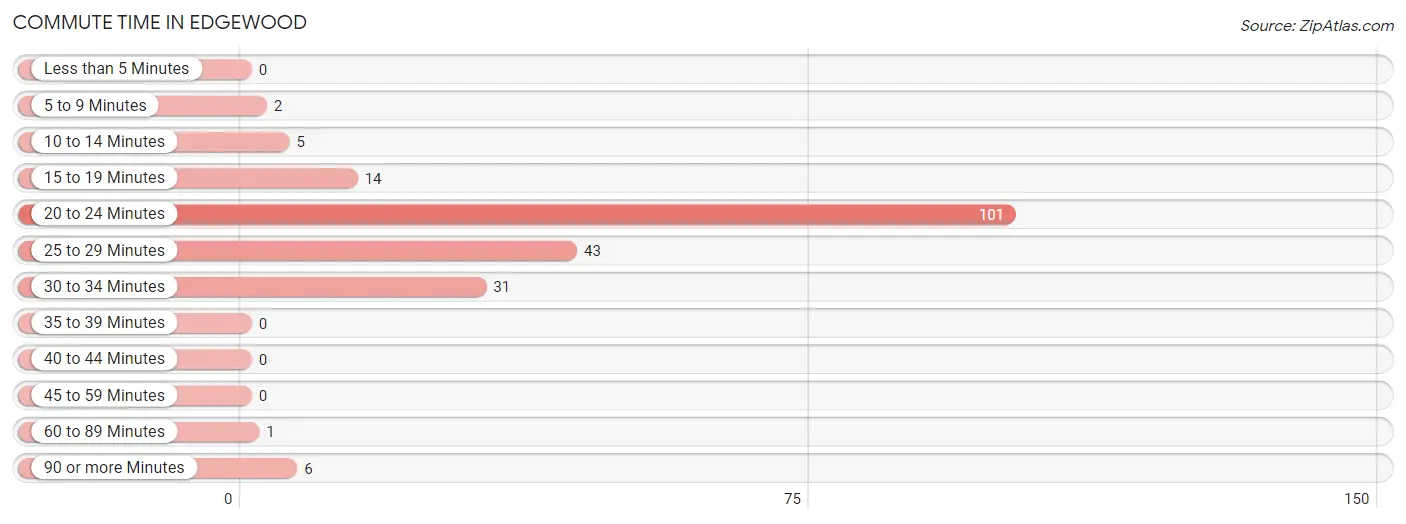
| Commute Time | # Commuters | % Commuters |
| Less than 5 Minutes | 0 | 0.0% |
| 5 to 9 Minutes | 2 | 1.0% |
| 10 to 14 Minutes | 5 | 2.5% |
| 15 to 19 Minutes | 14 | 6.9% |
| 20 to 24 Minutes | 101 | 49.7% |
| 25 to 29 Minutes | 43 | 21.2% |
| 30 to 34 Minutes | 31 | 15.3% |
| 35 to 39 Minutes | 0 | 0.0% |
| 40 to 44 Minutes | 0 | 0.0% |
| 45 to 59 Minutes | 0 | 0.0% |
| 60 to 89 Minutes | 1 | 0.5% |
| 90 or more Minutes | 6 | 3.0% |
Commute Time by Sex in Edgewood
The most common commute times in Edgewood are 20 to 24 minutes (44 commuters, 41.9%) for males and 20 to 24 minutes (57 commuters, 58.2%) for females.
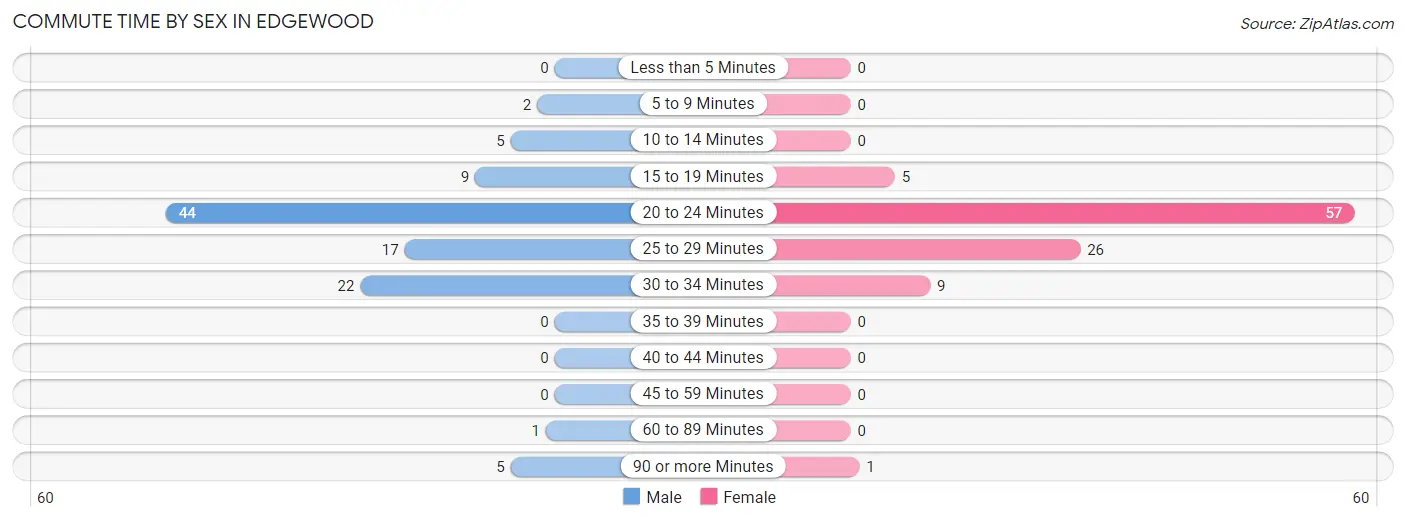
| Commute Time | Male | Female |
| Less than 5 Minutes | 0 (0.0%) | 0 (0.0%) |
| 5 to 9 Minutes | 2 (1.9%) | 0 (0.0%) |
| 10 to 14 Minutes | 5 (4.8%) | 0 (0.0%) |
| 15 to 19 Minutes | 9 (8.6%) | 5 (5.1%) |
| 20 to 24 Minutes | 44 (41.9%) | 57 (58.2%) |
| 25 to 29 Minutes | 17 (16.2%) | 26 (26.5%) |
| 30 to 34 Minutes | 22 (20.9%) | 9 (9.2%) |
| 35 to 39 Minutes | 0 (0.0%) | 0 (0.0%) |
| 40 to 44 Minutes | 0 (0.0%) | 0 (0.0%) |
| 45 to 59 Minutes | 0 (0.0%) | 0 (0.0%) |
| 60 to 89 Minutes | 1 (0.9%) | 0 (0.0%) |
| 90 or more Minutes | 5 (4.8%) | 1 (1.0%) |
Time of Departure to Work by Sex in Edgewood
The most frequent times of departure to work in Edgewood are 7:00 AM to 7:29 AM (25, 23.8%) for males and 6:30 AM to 6:59 AM (35, 35.7%) for females.
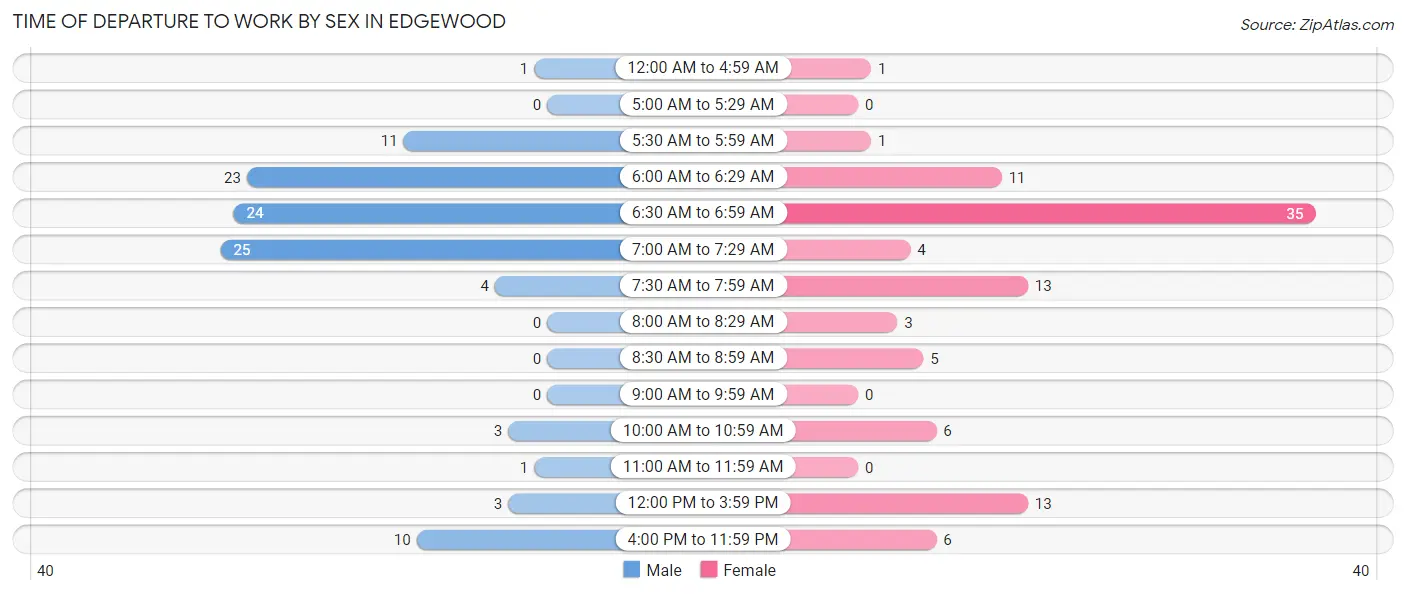
| Time of Departure | Male | Female |
| 12:00 AM to 4:59 AM | 1 (0.9%) | 1 (1.0%) |
| 5:00 AM to 5:29 AM | 0 (0.0%) | 0 (0.0%) |
| 5:30 AM to 5:59 AM | 11 (10.5%) | 1 (1.0%) |
| 6:00 AM to 6:29 AM | 23 (21.9%) | 11 (11.2%) |
| 6:30 AM to 6:59 AM | 24 (22.9%) | 35 (35.7%) |
| 7:00 AM to 7:29 AM | 25 (23.8%) | 4 (4.1%) |
| 7:30 AM to 7:59 AM | 4 (3.8%) | 13 (13.3%) |
| 8:00 AM to 8:29 AM | 0 (0.0%) | 3 (3.1%) |
| 8:30 AM to 8:59 AM | 0 (0.0%) | 5 (5.1%) |
| 9:00 AM to 9:59 AM | 0 (0.0%) | 0 (0.0%) |
| 10:00 AM to 10:59 AM | 3 (2.9%) | 6 (6.1%) |
| 11:00 AM to 11:59 AM | 1 (0.9%) | 0 (0.0%) |
| 12:00 PM to 3:59 PM | 3 (2.9%) | 13 (13.3%) |
| 4:00 PM to 11:59 PM | 10 (9.5%) | 6 (6.1%) |
| Total | 105 (100.0%) | 98 (100.0%) |
Housing Occupancy in Edgewood
Occupancy by Ownership in Edgewood
Of the total 200 dwellings in Edgewood, owner-occupied units account for 147 (73.5%), while renter-occupied units make up 53 (26.5%).
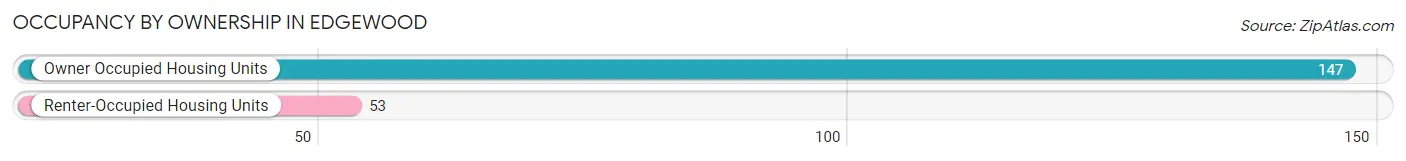
| Occupancy | # Housing Units | % Housing Units |
| Owner Occupied Housing Units | 147 | 73.5% |
| Renter-Occupied Housing Units | 53 | 26.5% |
| Total Occupied Housing Units | 200 | 100.0% |
Occupancy by Household Size in Edgewood
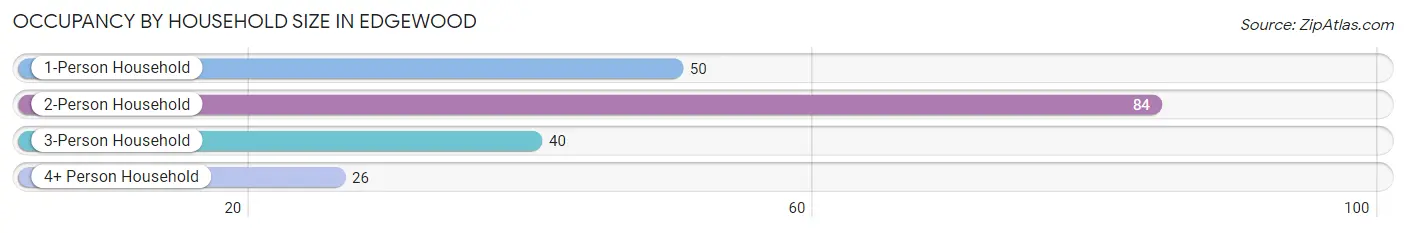
| Household Size | # Housing Units | % Housing Units |
| 1-Person Household | 50 | 25.0% |
| 2-Person Household | 84 | 42.0% |
| 3-Person Household | 40 | 20.0% |
| 4+ Person Household | 26 | 13.0% |
| Total Housing Units | 200 | 100.0% |
Occupancy by Ownership by Household Size in Edgewood
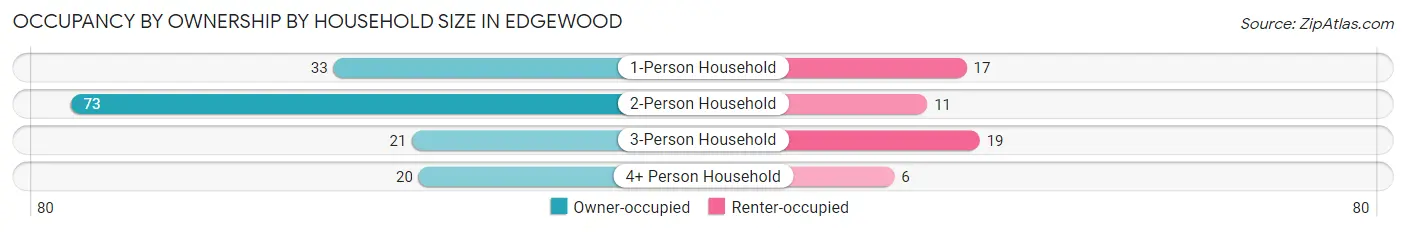
| Household Size | Owner-occupied | Renter-occupied |
| 1-Person Household | 33 (66.0%) | 17 (34.0%) |
| 2-Person Household | 73 (86.9%) | 11 (13.1%) |
| 3-Person Household | 21 (52.5%) | 19 (47.5%) |
| 4+ Person Household | 20 (76.9%) | 6 (23.1%) |
| Total Housing Units | 147 (73.5%) | 53 (26.5%) |
Occupancy by Educational Attainment in Edgewood
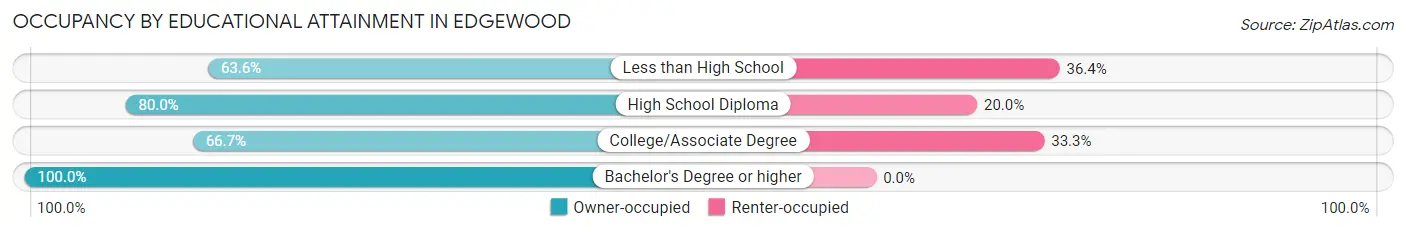
| Household Size | Owner-occupied | Renter-occupied |
| Less than High School | 21 (63.6%) | 12 (36.4%) |
| High School Diploma | 72 (80.0%) | 18 (20.0%) |
| College/Associate Degree | 46 (66.7%) | 23 (33.3%) |
| Bachelor's Degree or higher | 8 (100.0%) | 0 (0.0%) |
Occupancy by Age of Householder in Edgewood
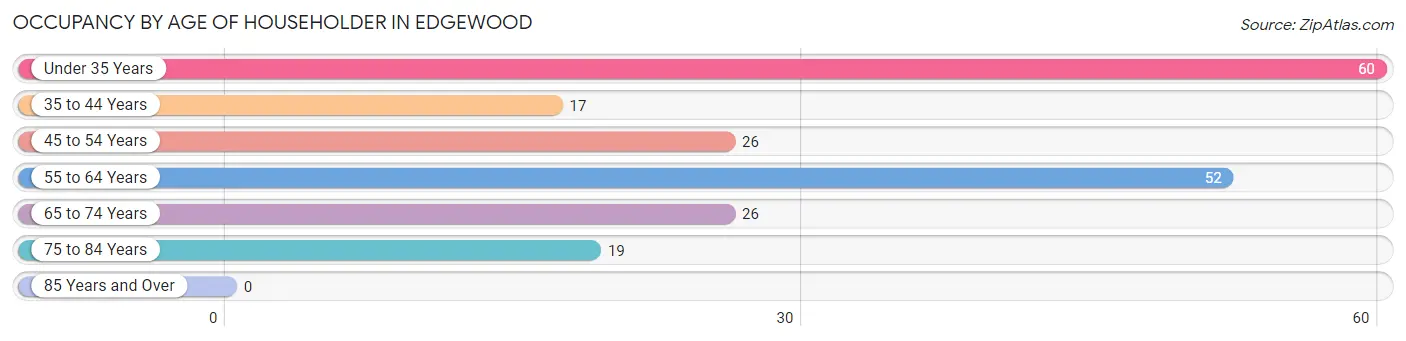
| Age Bracket | # Households | % Households |
| Under 35 Years | 60 | 30.0% |
| 35 to 44 Years | 17 | 8.5% |
| 45 to 54 Years | 26 | 13.0% |
| 55 to 64 Years | 52 | 26.0% |
| 65 to 74 Years | 26 | 13.0% |
| 75 to 84 Years | 19 | 9.5% |
| 85 Years and Over | 0 | 0.0% |
| Total | 200 | 100.0% |
Housing Finances in Edgewood
Median Income by Occupancy in Edgewood
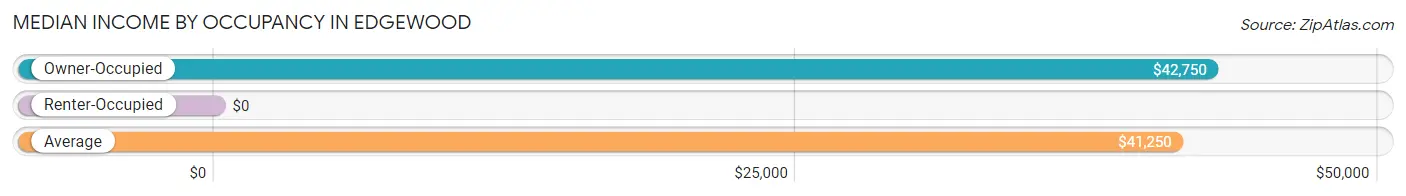
| Occupancy Type | # Households | Median Income |
| Owner-Occupied | 147 (73.5%) | $42,750 |
| Renter-Occupied | 53 (26.5%) | $0 |
| Average | 200 (100.0%) | $41,250 |
Occupancy by Householder Income Bracket in Edgewood
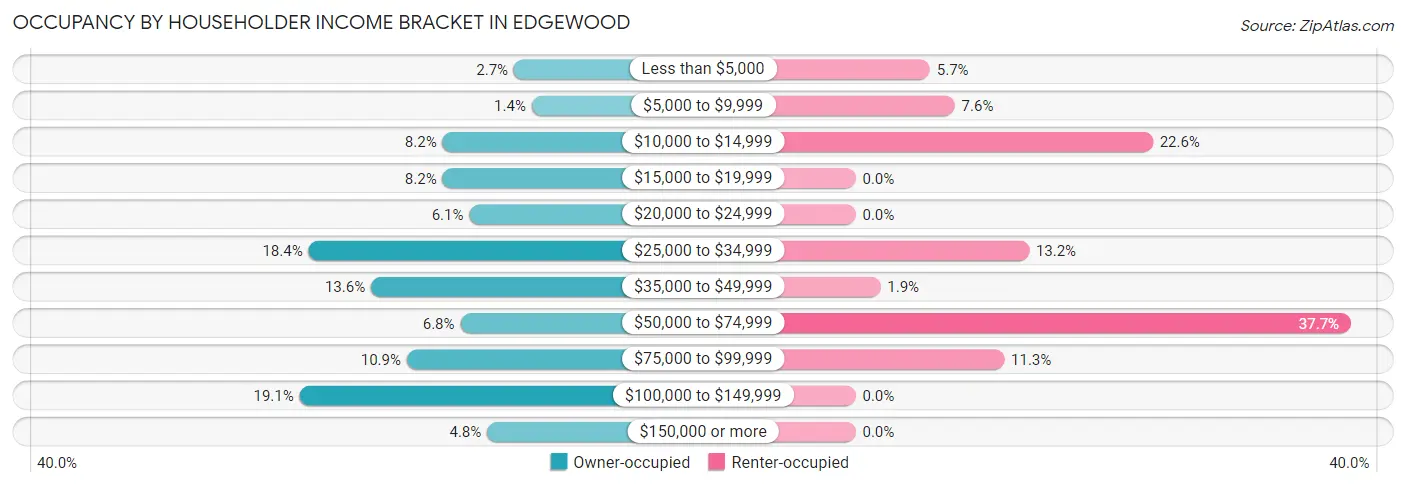
| Income Bracket | Owner-occupied | Renter-occupied |
| Less than $5,000 | 4 (2.7%) | 3 (5.7%) |
| $5,000 to $9,999 | 2 (1.4%) | 4 (7.5%) |
| $10,000 to $14,999 | 12 (8.2%) | 12 (22.6%) |
| $15,000 to $19,999 | 12 (8.2%) | 0 (0.0%) |
| $20,000 to $24,999 | 9 (6.1%) | 0 (0.0%) |
| $25,000 to $34,999 | 27 (18.4%) | 7 (13.2%) |
| $35,000 to $49,999 | 20 (13.6%) | 1 (1.9%) |
| $50,000 to $74,999 | 10 (6.8%) | 20 (37.7%) |
| $75,000 to $99,999 | 16 (10.9%) | 6 (11.3%) |
| $100,000 to $149,999 | 28 (19.1%) | 0 (0.0%) |
| $150,000 or more | 7 (4.8%) | 0 (0.0%) |
| Total | 147 (100.0%) | 53 (100.0%) |
Monthly Housing Cost Tiers in Edgewood
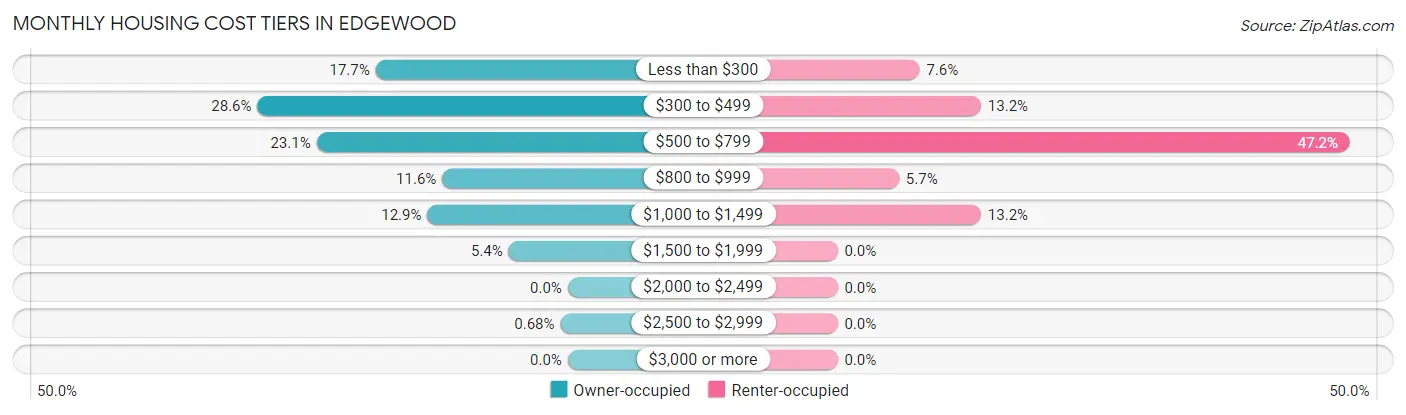
| Monthly Cost | Owner-occupied | Renter-occupied |
| Less than $300 | 26 (17.7%) | 4 (7.5%) |
| $300 to $499 | 42 (28.6%) | 7 (13.2%) |
| $500 to $799 | 34 (23.1%) | 25 (47.2%) |
| $800 to $999 | 17 (11.6%) | 3 (5.7%) |
| $1,000 to $1,499 | 19 (12.9%) | 7 (13.2%) |
| $1,500 to $1,999 | 8 (5.4%) | 0 (0.0%) |
| $2,000 to $2,499 | 0 (0.0%) | 0 (0.0%) |
| $2,500 to $2,999 | 1 (0.7%) | 0 (0.0%) |
| $3,000 or more | 0 (0.0%) | 0 (0.0%) |
| Total | 147 (100.0%) | 53 (100.0%) |
Physical Housing Characteristics in Edgewood
Housing Structures in Edgewood
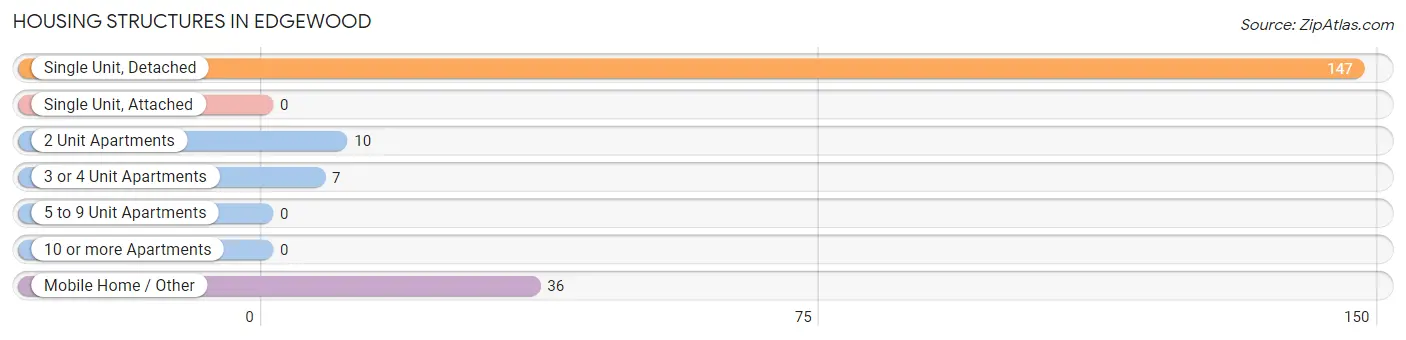
| Structure Type | # Housing Units | % Housing Units |
| Single Unit, Detached | 147 | 73.5% |
| Single Unit, Attached | 0 | 0.0% |
| 2 Unit Apartments | 10 | 5.0% |
| 3 or 4 Unit Apartments | 7 | 3.5% |
| 5 to 9 Unit Apartments | 0 | 0.0% |
| 10 or more Apartments | 0 | 0.0% |
| Mobile Home / Other | 36 | 18.0% |
| Total | 200 | 100.0% |
Housing Structures by Occupancy in Edgewood
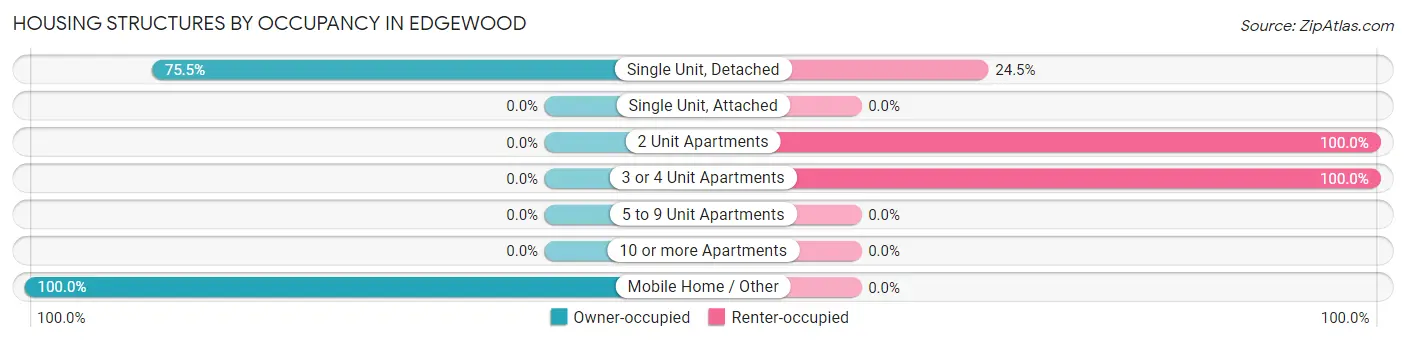
| Structure Type | Owner-occupied | Renter-occupied |
| Single Unit, Detached | 111 (75.5%) | 36 (24.5%) |
| Single Unit, Attached | 0 (0.0%) | 0 (0.0%) |
| 2 Unit Apartments | 0 (0.0%) | 10 (100.0%) |
| 3 or 4 Unit Apartments | 0 (0.0%) | 7 (100.0%) |
| 5 to 9 Unit Apartments | 0 (0.0%) | 0 (0.0%) |
| 10 or more Apartments | 0 (0.0%) | 0 (0.0%) |
| Mobile Home / Other | 36 (100.0%) | 0 (0.0%) |
| Total | 147 (73.5%) | 53 (26.5%) |
Housing Structures by Number of Rooms in Edgewood
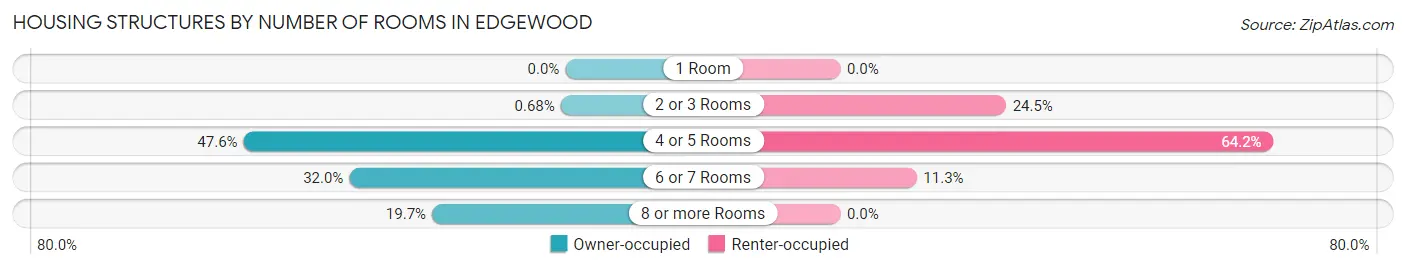
| Number of Rooms | Owner-occupied | Renter-occupied |
| 1 Room | 0 (0.0%) | 0 (0.0%) |
| 2 or 3 Rooms | 1 (0.7%) | 13 (24.5%) |
| 4 or 5 Rooms | 70 (47.6%) | 34 (64.1%) |
| 6 or 7 Rooms | 47 (32.0%) | 6 (11.3%) |
| 8 or more Rooms | 29 (19.7%) | 0 (0.0%) |
| Total | 147 (100.0%) | 53 (100.0%) |
Housing Structure by Heating Type in Edgewood
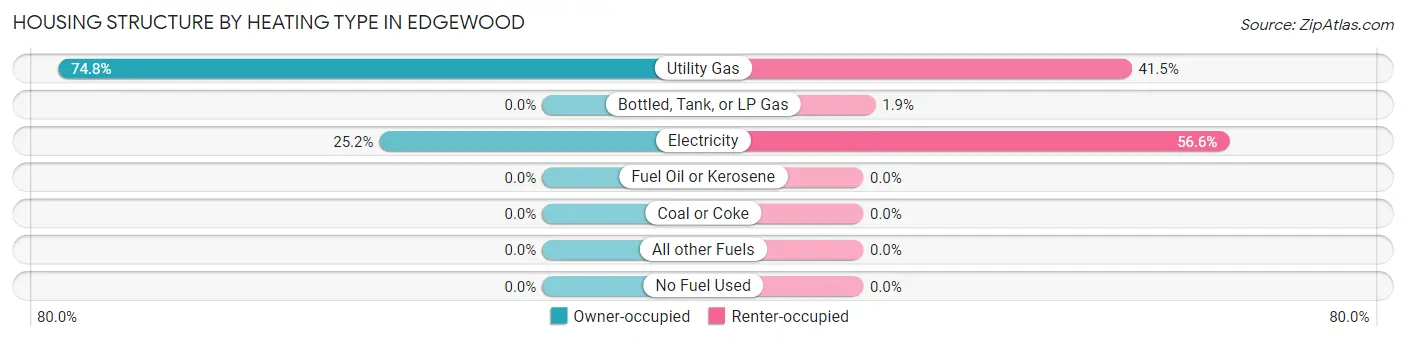
| Heating Type | Owner-occupied | Renter-occupied |
| Utility Gas | 110 (74.8%) | 22 (41.5%) |
| Bottled, Tank, or LP Gas | 0 (0.0%) | 1 (1.9%) |
| Electricity | 37 (25.2%) | 30 (56.6%) |
| Fuel Oil or Kerosene | 0 (0.0%) | 0 (0.0%) |
| Coal or Coke | 0 (0.0%) | 0 (0.0%) |
| All other Fuels | 0 (0.0%) | 0 (0.0%) |
| No Fuel Used | 0 (0.0%) | 0 (0.0%) |
| Total | 147 (100.0%) | 53 (100.0%) |
Household Vehicle Usage in Edgewood
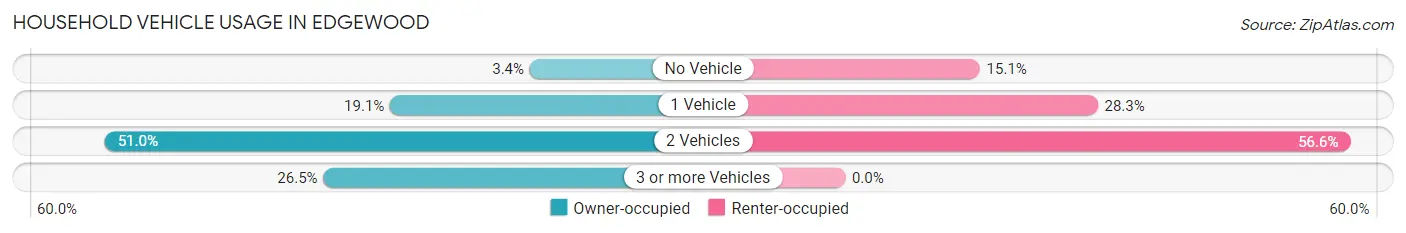
| Vehicles per Household | Owner-occupied | Renter-occupied |
| No Vehicle | 5 (3.4%) | 8 (15.1%) |
| 1 Vehicle | 28 (19.1%) | 15 (28.3%) |
| 2 Vehicles | 75 (51.0%) | 30 (56.6%) |
| 3 or more Vehicles | 39 (26.5%) | 0 (0.0%) |
| Total | 147 (100.0%) | 53 (100.0%) |
Real Estate & Mortgages in Edgewood
Real Estate and Mortgage Overview in Edgewood
| Characteristic | Without Mortgage | With Mortgage |
| Housing Units | 77 | 70 |
| Median Property Value | $53,100 | $84,300 |
| Median Household Income | $29,375 | $2 |
| Monthly Housing Costs | $360 | $0 |
| Real Estate Taxes | $892 | $8 |
Property Value by Mortgage Status in Edgewood
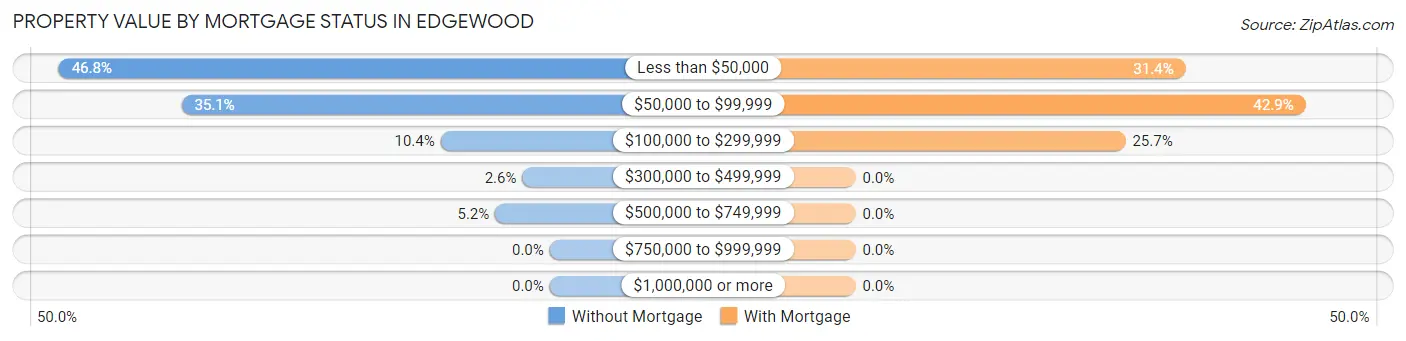
| Property Value | Without Mortgage | With Mortgage |
| Less than $50,000 | 36 (46.8%) | 22 (31.4%) |
| $50,000 to $99,999 | 27 (35.1%) | 30 (42.9%) |
| $100,000 to $299,999 | 8 (10.4%) | 18 (25.7%) |
| $300,000 to $499,999 | 2 (2.6%) | 0 (0.0%) |
| $500,000 to $749,999 | 4 (5.2%) | 0 (0.0%) |
| $750,000 to $999,999 | 0 (0.0%) | 0 (0.0%) |
| $1,000,000 or more | 0 (0.0%) | 0 (0.0%) |
| Total | 77 (100.0%) | 70 (100.0%) |
Household Income by Mortgage Status in Edgewood
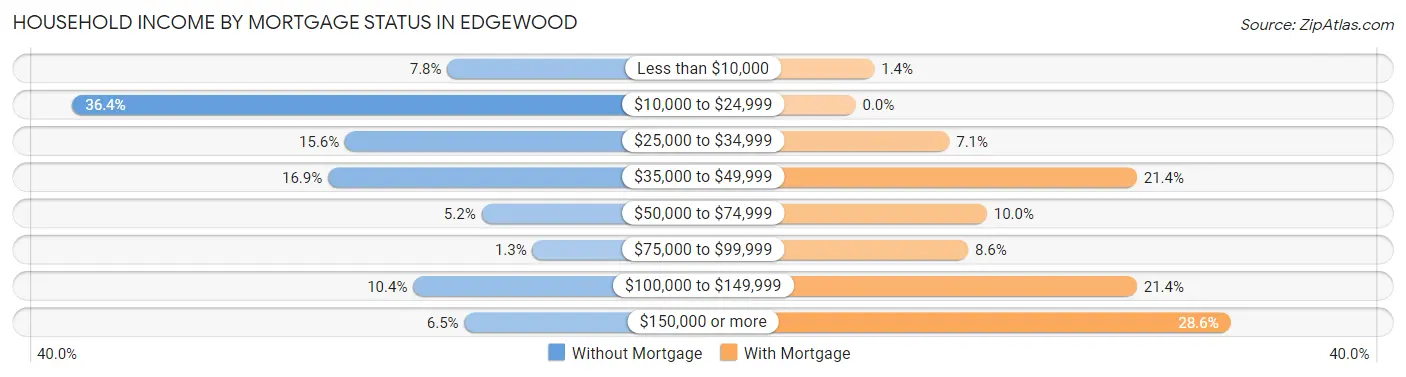
| Household Income | Without Mortgage | With Mortgage |
| Less than $10,000 | 6 (7.8%) | 1 (1.4%) |
| $10,000 to $24,999 | 28 (36.4%) | 0 (0.0%) |
| $25,000 to $34,999 | 12 (15.6%) | 5 (7.1%) |
| $35,000 to $49,999 | 13 (16.9%) | 15 (21.4%) |
| $50,000 to $74,999 | 4 (5.2%) | 7 (10.0%) |
| $75,000 to $99,999 | 1 (1.3%) | 6 (8.6%) |
| $100,000 to $149,999 | 8 (10.4%) | 15 (21.4%) |
| $150,000 or more | 5 (6.5%) | 20 (28.6%) |
| Total | 77 (100.0%) | 70 (100.0%) |
Property Value to Household Income Ratio in Edgewood
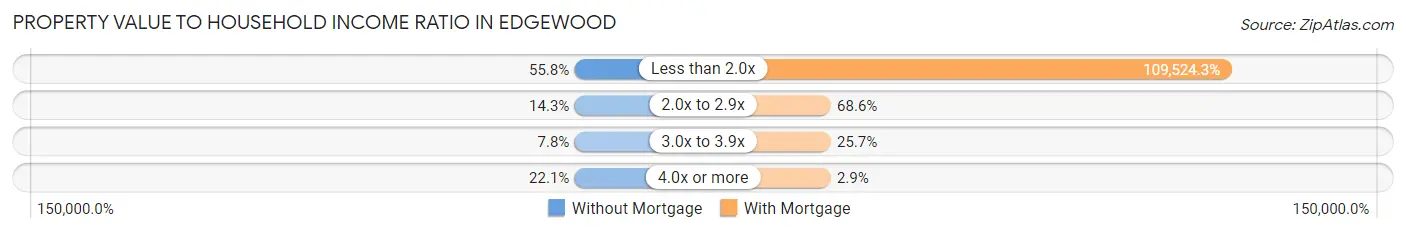
| Value-to-Income Ratio | Without Mortgage | With Mortgage |
| Less than 2.0x | 43 (55.8%) | 76,667 (109,524.3%) |
| 2.0x to 2.9x | 11 (14.3%) | 48 (68.6%) |
| 3.0x to 3.9x | 6 (7.8%) | 18 (25.7%) |
| 4.0x or more | 17 (22.1%) | 2 (2.9%) |
| Total | 77 (100.0%) | 70 (100.0%) |
Real Estate Taxes by Mortgage Status in Edgewood
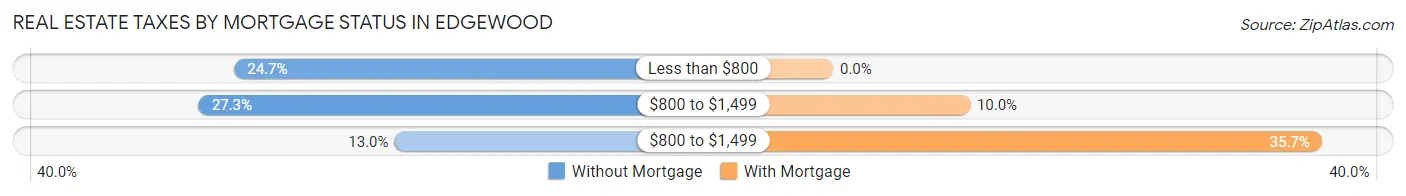
| Property Taxes | Without Mortgage | With Mortgage |
| Less than $800 | 19 (24.7%) | 0 (0.0%) |
| $800 to $1,499 | 21 (27.3%) | 7 (10.0%) |
| $800 to $1,499 | 10 (13.0%) | 25 (35.7%) |
| Total | 77 (100.0%) | 70 (100.0%) |
Health & Disability in Edgewood
Health Insurance Coverage by Age in Edgewood
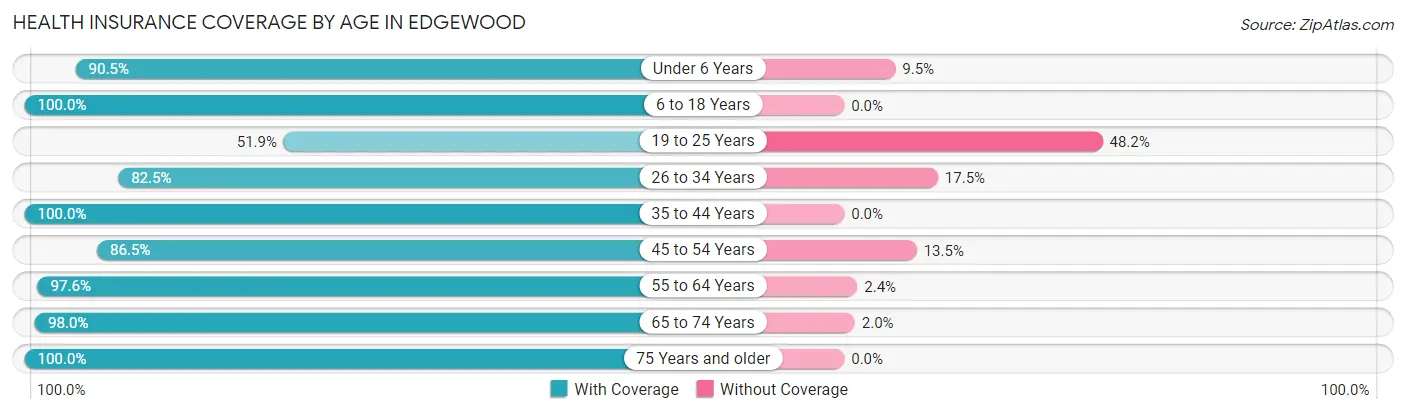
| Age Bracket | With Coverage | Without Coverage |
| Under 6 Years | 38 (90.5%) | 4 (9.5%) |
| 6 to 18 Years | 45 (100.0%) | 0 (0.0%) |
| 19 to 25 Years | 28 (51.8%) | 26 (48.1%) |
| 26 to 34 Years | 52 (82.5%) | 11 (17.5%) |
| 35 to 44 Years | 28 (100.0%) | 0 (0.0%) |
| 45 to 54 Years | 32 (86.5%) | 5 (13.5%) |
| 55 to 64 Years | 80 (97.6%) | 2 (2.4%) |
| 65 to 74 Years | 50 (98.0%) | 1 (2.0%) |
| 75 Years and older | 27 (100.0%) | 0 (0.0%) |
| Total | 380 (88.6%) | 49 (11.4%) |
Health Insurance Coverage by Citizenship Status in Edgewood
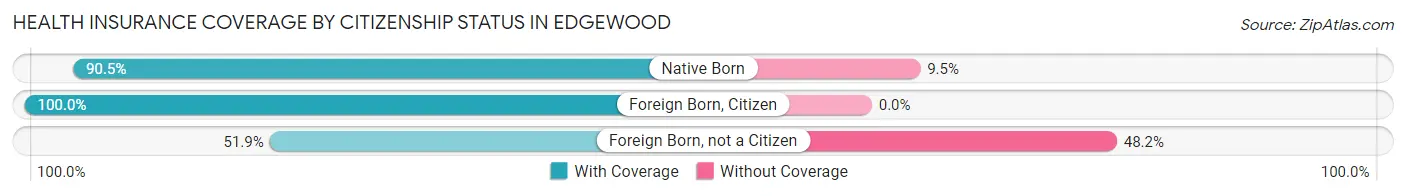
| Citizenship Status | With Coverage | Without Coverage |
| Native Born | 38 (90.5%) | 4 (9.5%) |
| Foreign Born, Citizen | 45 (100.0%) | 0 (0.0%) |
| Foreign Born, not a Citizen | 28 (51.8%) | 26 (48.1%) |
Health Insurance Coverage by Household Income in Edgewood
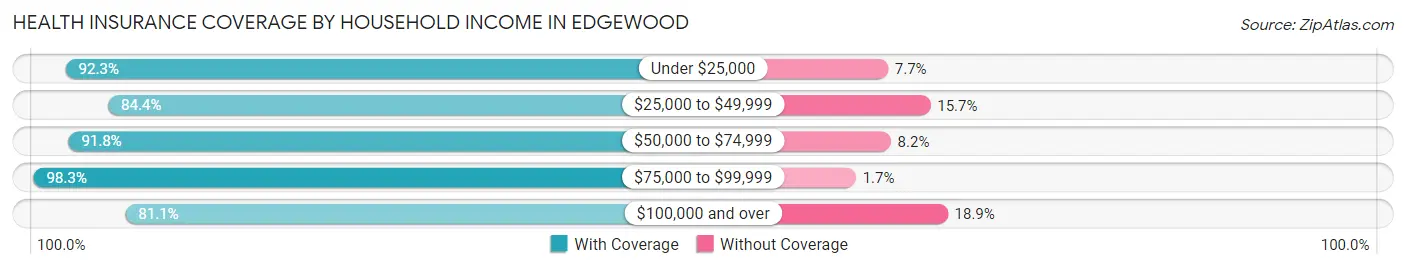
| Household Income | With Coverage | Without Coverage |
| Under $25,000 | 84 (92.3%) | 7 (7.7%) |
| $25,000 to $49,999 | 97 (84.4%) | 18 (15.7%) |
| $50,000 to $74,999 | 67 (91.8%) | 6 (8.2%) |
| $75,000 to $99,999 | 59 (98.3%) | 1 (1.7%) |
| $100,000 and over | 73 (81.1%) | 17 (18.9%) |
Public vs Private Health Insurance Coverage by Age in Edgewood
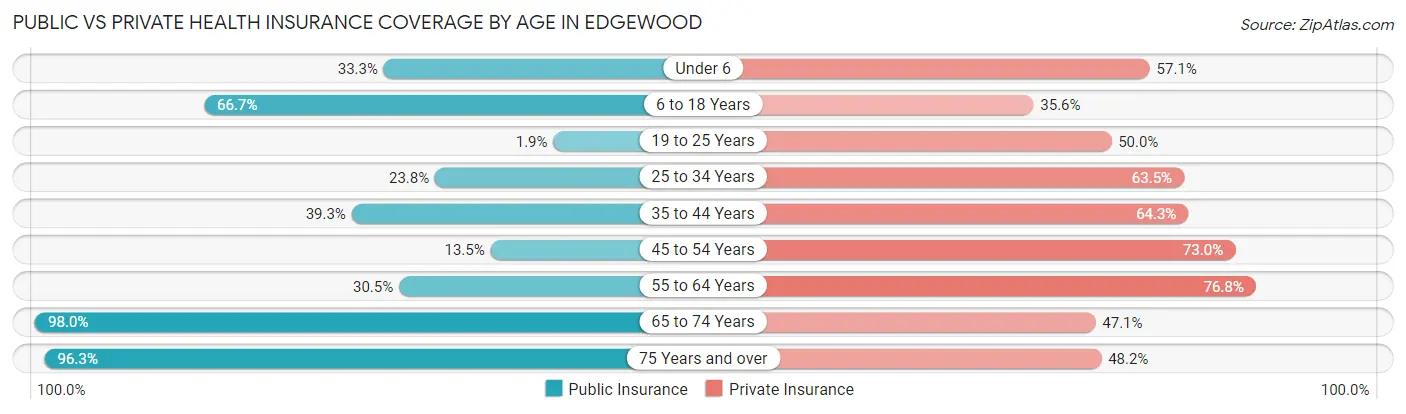
| Age Bracket | Public Insurance | Private Insurance |
| Under 6 | 14 (33.3%) | 24 (57.1%) |
| 6 to 18 Years | 30 (66.7%) | 16 (35.6%) |
| 19 to 25 Years | 1 (1.8%) | 27 (50.0%) |
| 25 to 34 Years | 15 (23.8%) | 40 (63.5%) |
| 35 to 44 Years | 11 (39.3%) | 18 (64.3%) |
| 45 to 54 Years | 5 (13.5%) | 27 (73.0%) |
| 55 to 64 Years | 25 (30.5%) | 63 (76.8%) |
| 65 to 74 Years | 50 (98.0%) | 24 (47.1%) |
| 75 Years and over | 26 (96.3%) | 13 (48.1%) |
| Total | 177 (41.3%) | 252 (58.7%) |
Disability Status by Sex by Age in Edgewood
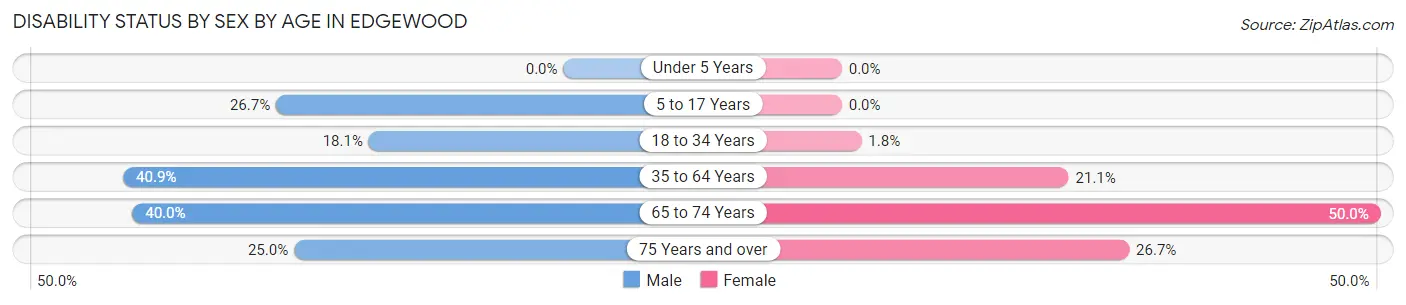
| Age Bracket | Male | Female |
| Under 5 Years | 0 (0.0%) | 0 (0.0%) |
| 5 to 17 Years | 4 (26.7%) | 0 (0.0%) |
| 18 to 34 Years | 13 (18.1%) | 1 (1.8%) |
| 35 to 64 Years | 29 (40.8%) | 16 (21.0%) |
| 65 to 74 Years | 10 (40.0%) | 13 (50.0%) |
| 75 Years and over | 3 (25.0%) | 4 (26.7%) |
Disability Class by Sex by Age in Edgewood
Disability Class: Hearing Difficulty
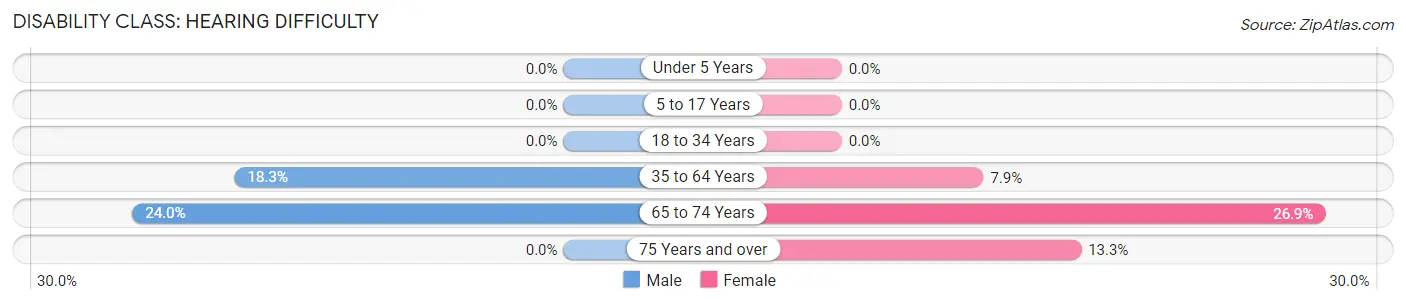
| Age Bracket | Male | Female |
| Under 5 Years | 0 (0.0%) | 0 (0.0%) |
| 5 to 17 Years | 0 (0.0%) | 0 (0.0%) |
| 18 to 34 Years | 0 (0.0%) | 0 (0.0%) |
| 35 to 64 Years | 13 (18.3%) | 6 (7.9%) |
| 65 to 74 Years | 6 (24.0%) | 7 (26.9%) |
| 75 Years and over | 0 (0.0%) | 2 (13.3%) |
Disability Class: Vision Difficulty
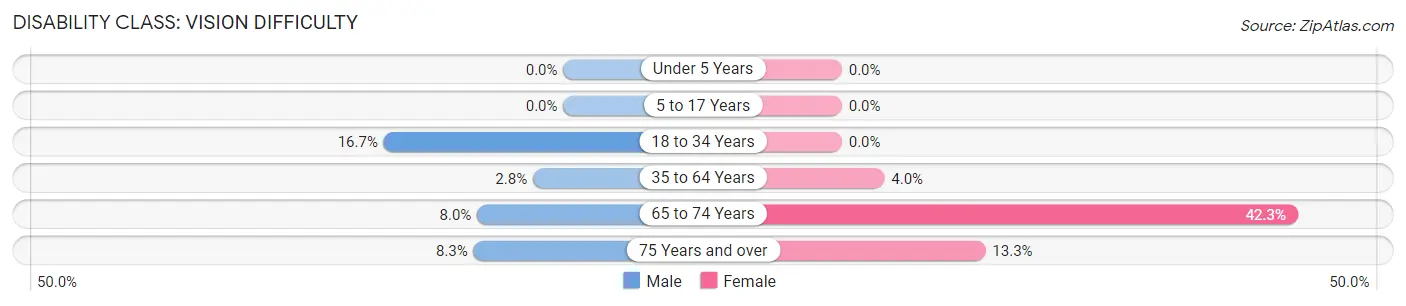
| Age Bracket | Male | Female |
| Under 5 Years | 0 (0.0%) | 0 (0.0%) |
| 5 to 17 Years | 0 (0.0%) | 0 (0.0%) |
| 18 to 34 Years | 12 (16.7%) | 0 (0.0%) |
| 35 to 64 Years | 2 (2.8%) | 3 (4.0%) |
| 65 to 74 Years | 2 (8.0%) | 11 (42.3%) |
| 75 Years and over | 1 (8.3%) | 2 (13.3%) |
Disability Class: Cognitive Difficulty
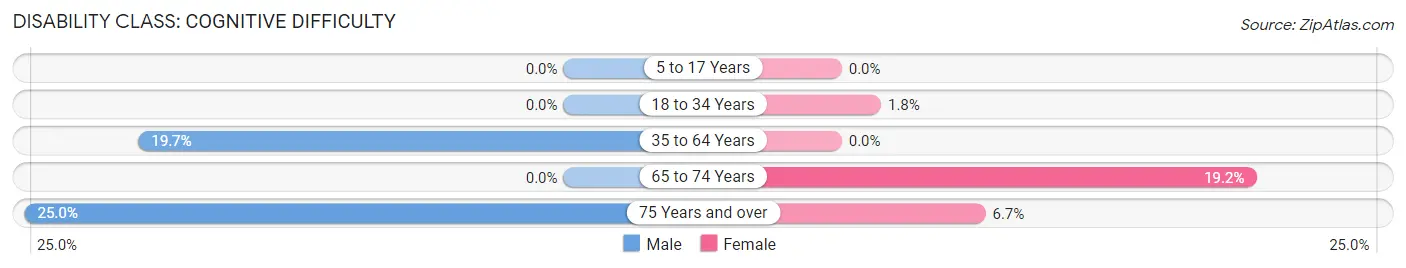
| Age Bracket | Male | Female |
| 5 to 17 Years | 0 (0.0%) | 0 (0.0%) |
| 18 to 34 Years | 0 (0.0%) | 1 (1.8%) |
| 35 to 64 Years | 14 (19.7%) | 0 (0.0%) |
| 65 to 74 Years | 0 (0.0%) | 5 (19.2%) |
| 75 Years and over | 3 (25.0%) | 1 (6.7%) |
Disability Class: Ambulatory Difficulty
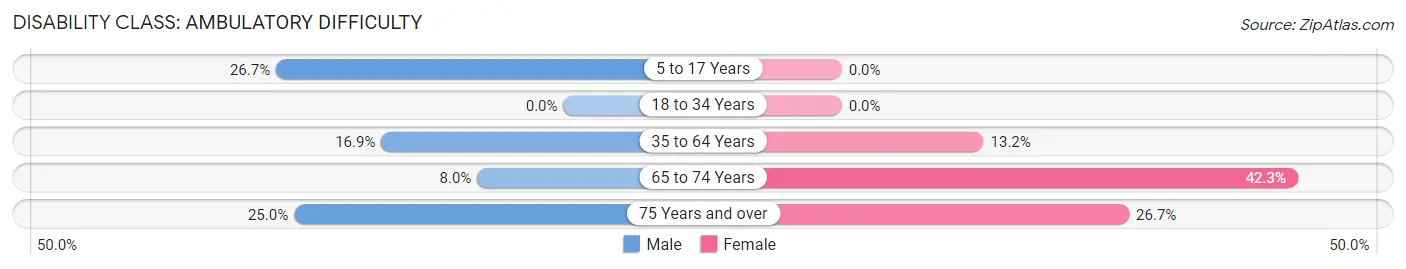
| Age Bracket | Male | Female |
| 5 to 17 Years | 4 (26.7%) | 0 (0.0%) |
| 18 to 34 Years | 0 (0.0%) | 0 (0.0%) |
| 35 to 64 Years | 12 (16.9%) | 10 (13.2%) |
| 65 to 74 Years | 2 (8.0%) | 11 (42.3%) |
| 75 Years and over | 3 (25.0%) | 4 (26.7%) |
Disability Class: Self-Care Difficulty
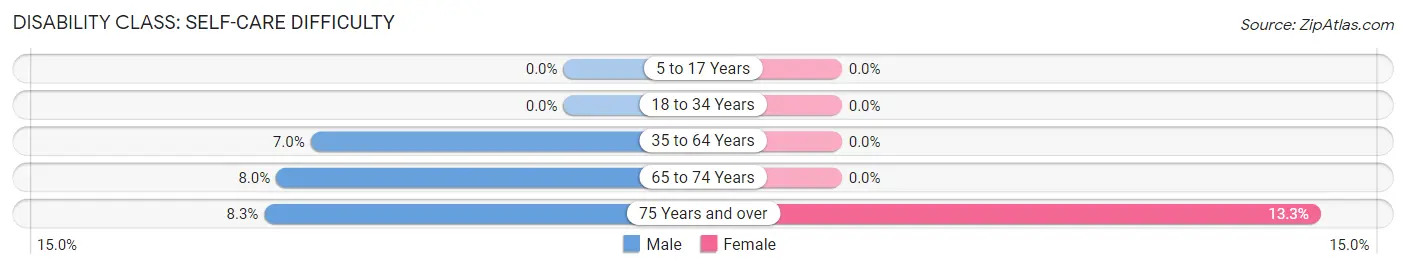
| Age Bracket | Male | Female |
| 5 to 17 Years | 0 (0.0%) | 0 (0.0%) |
| 18 to 34 Years | 0 (0.0%) | 0 (0.0%) |
| 35 to 64 Years | 5 (7.0%) | 0 (0.0%) |
| 65 to 74 Years | 2 (8.0%) | 0 (0.0%) |
| 75 Years and over | 1 (8.3%) | 2 (13.3%) |
Technology Access in Edgewood
Computing Device Access in Edgewood
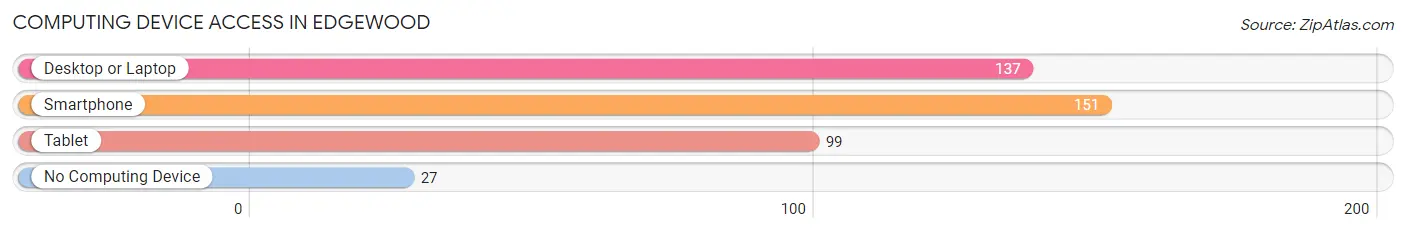
| Device Type | # Households | % Households |
| Desktop or Laptop | 137 | 68.5% |
| Smartphone | 151 | 75.5% |
| Tablet | 99 | 49.5% |
| No Computing Device | 27 | 13.5% |
| Total | 200 | 100.0% |
Internet Access in Edgewood
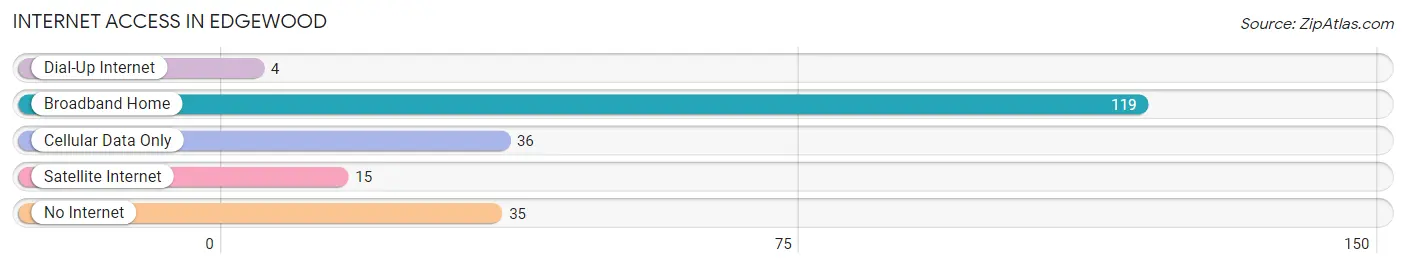
| Internet Type | # Households | % Households |
| Dial-Up Internet | 4 | 2.0% |
| Broadband Home | 119 | 59.5% |
| Cellular Data Only | 36 | 18.0% |
| Satellite Internet | 15 | 7.5% |
| No Internet | 35 | 17.5% |
| Total | 200 | 100.0% |
Edgewood Summary
Edgewood, Illinois is a small village located in Richland County, Illinois. It is situated in the southeastern corner of the state, about 25 miles from the Indiana border. The village has a population of just over 1,000 people, and is part of the Olney-Noble-Edgewood Consolidated School District.
History
Edgewood was founded in 1854 by a group of settlers from Ohio. The village was named after the nearby Edgewood Creek, which was named for its location on the edge of a wooded area. The first settlers were primarily farmers, and the village grew slowly over the years. In 1872, the village was incorporated, and the first post office was established.
In the late 19th century, Edgewood began to experience a period of growth. The village was connected to the railroad in 1887, and the first bank was established in 1889. The village also had a number of businesses, including a general store, a blacksmith shop, and a hotel.
In the early 20th century, Edgewood continued to grow. The village was connected to the electric grid in 1912, and the first telephone service was established in 1915. The village also had a number of churches, including the Methodist Episcopal Church, the Presbyterian Church, and the Catholic Church.
Geography
Edgewood is located in the southeastern corner of Richland County, Illinois. The village is situated on the edge of a wooded area, and is bordered by the Edgewood Creek to the east. The village is located about 25 miles from the Indiana border, and is about 90 miles from the state capital of Springfield.
The village is situated on a flat plain, and is surrounded by farmland. The climate in Edgewood is generally mild, with hot summers and cold winters. The average annual temperature is around 50 degrees Fahrenheit, and the average annual precipitation is around 40 inches.
Economy
The economy of Edgewood is largely based on agriculture. The village is surrounded by farmland, and many of the residents are involved in farming. The village also has a number of small businesses, including a general store, a hardware store, and a restaurant.
The village is also home to a number of manufacturing companies, including a furniture factory and a plastics factory. The village is also home to a number of service-based businesses, including a bank, a post office, and a number of medical and dental offices.
Demographics
As of the 2010 census, the population of Edgewood was 1,072. The population is largely white, with about 95% of the population being white. The median household income is around $45,000, and the median home value is around $90,000.
The village is served by the Olney-Noble-Edgewood Consolidated School District. The district has one elementary school, one middle school, and one high school. The village also has a number of churches, including the Methodist Episcopal Church, the Presbyterian Church, and the Catholic Church.
Common Questions
What is the Total Population of Edgewood?
Total Population of Edgewood is 429.
What is the Total Male Population of Edgewood?
Total Male Population of Edgewood is 222.
What is the Total Female Population of Edgewood?
Total Female Population of Edgewood is 207.
What is the Ratio of Males per 100 Females in Edgewood?
There are 107.25 Males per 100 Females in Edgewood.
What is the Ratio of Females per 100 Males in Edgewood?
There are 93.24 Females per 100 Males in Edgewood.
What is the Median Population Age in Edgewood?
Median Population Age in Edgewood is 37.2 Years.
What is the Average Family Size in Edgewood
Average Family Size in Edgewood is 2.5 People.
What is the Average Household Size in Edgewood
Average Household Size in Edgewood is 2.1 People.
What is Per Capita Income in Edgewood?
Per Capita income in Edgewood is $24,012.
What is the Median Family Income in Edgewood?
Median Family Income in Edgewood is $61,875.
What is the Median Household income in Edgewood?
Median Household Income in Edgewood is $41,250.
What is Income or Wage Gap in Edgewood?
Income or Wage Gap in Edgewood is 30.7%.
Women in Edgewood earn 69.3 cents for every dollar earned by a man.
What is Inequality or Gini Index in Edgewood?
Inequality or Gini Index in Edgewood is 0.42.
How Large is the Labor Force in Edgewood?
There are 222 People in the Labor Forcein in Edgewood.
What is the Percentage of People in the Labor Force in Edgewood?
61.8% of People are in the Labor Force in Edgewood.
What is the Unemployment Rate in Edgewood?
Unemployment Rate in Edgewood is 5.4%.