Cities with the Highest Percentage of Immigrants from Sweden in Illinois
RELATED REPORTS & OPTIONS
Sweden
Illinois
Compare Cities
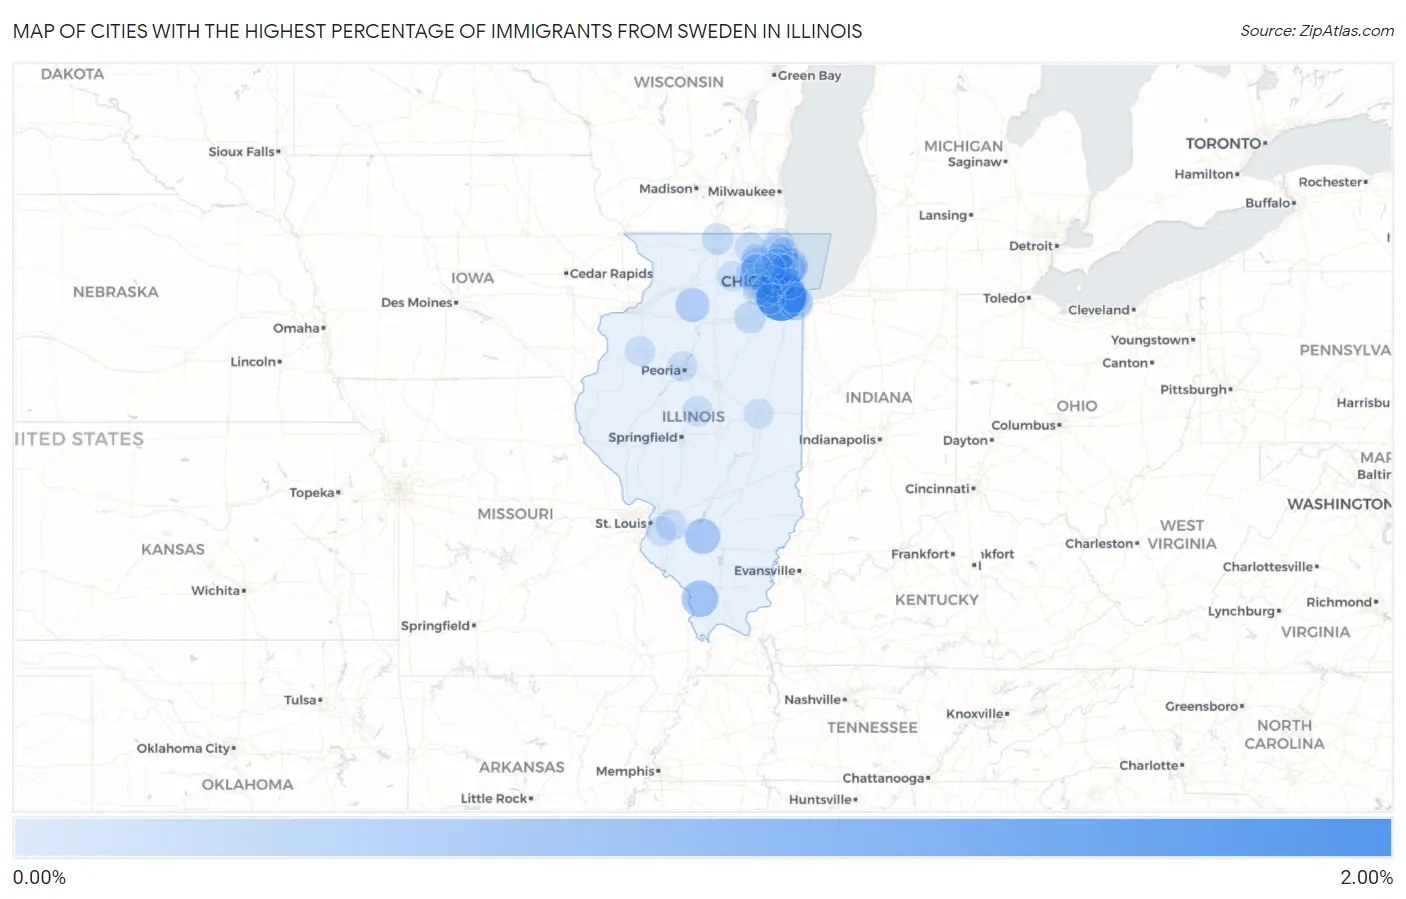
Map of Cities with the Highest Percentage of Immigrants from Sweden in Illinois
0.00%
2.00%
Cities with the Highest Percentage of Immigrants from Sweden in Illinois
| City | Sweden | vs State | vs National | |
| 1. | Palos Park | 1.61% | 0.0093%(+1.60)#1 | 0.014%(+1.60)#23 |
| 2. | Alto Pass | 0.52% | 0.0093%(+0.516)#2 | 0.014%(+0.511)#110 |
| 3. | Hoyleton | 0.42% | 0.0093%(+0.414)#3 | 0.014%(+0.409)#132 |
| 4. | Hinsdale | 0.37% | 0.0093%(+0.358)#4 | 0.014%(+0.353)#164 |
| 5. | South Elgin | 0.35% | 0.0093%(+0.339)#5 | 0.014%(+0.334)#171 |
| 6. | Ohio | 0.32% | 0.0093%(+0.312)#6 | 0.014%(+0.307)#180 |
| 7. | Kenilworth | 0.28% | 0.0093%(+0.267)#7 | 0.014%(+0.262)#212 |
| 8. | Thornton | 0.23% | 0.0093%(+0.221)#8 | 0.014%(+0.216)#259 |
| 9. | Sleepy Hollow | 0.19% | 0.0093%(+0.178)#9 | 0.014%(+0.173)#298 |
| 10. | Morris | 0.14% | 0.0093%(+0.129)#10 | 0.014%(+0.124)#379 |
| 11. | Roscoe | 0.099% | 0.0093%(+0.089)#11 | 0.014%(+0.085)#451 |
| 12. | Lisle | 0.085% | 0.0093%(+0.076)#12 | 0.014%(+0.071)#489 |
| 13. | Gurnee | 0.085% | 0.0093%(+0.076)#13 | 0.014%(+0.071)#493 |
| 14. | Skokie | 0.070% | 0.0093%(+0.061)#14 | 0.014%(+0.056)#548 |
| 15. | Lebanon | 0.064% | 0.0093%(+0.055)#15 | 0.014%(+0.050)#578 |
| 16. | Deerfield | 0.063% | 0.0093%(+0.053)#16 | 0.014%(+0.048)#588 |
| 17. | Campton Hills | 0.057% | 0.0093%(+0.048)#17 | 0.014%(+0.043)#616 |
| 18. | Woodstock | 0.054% | 0.0093%(+0.044)#18 | 0.014%(+0.040)#633 |
| 19. | Libertyville | 0.054% | 0.0093%(+0.044)#19 | 0.014%(+0.039)#634 |
| 20. | River Forest | 0.052% | 0.0093%(+0.043)#20 | 0.014%(+0.038)#639 |
| 21. | Evanston | 0.052% | 0.0093%(+0.043)#21 | 0.014%(+0.038)#640 |
| 22. | Wood Dale | 0.043% | 0.0093%(+0.034)#22 | 0.014%(+0.029)#708 |
| 23. | South Holland | 0.042% | 0.0093%(+0.033)#23 | 0.014%(+0.028)#721 |
| 24. | Lincoln | 0.037% | 0.0093%(+0.028)#24 | 0.014%(+0.023)#751 |
| 25. | Blue Island | 0.035% | 0.0093%(+0.026)#25 | 0.014%(+0.021)#774 |
| 26. | Buffalo Grove | 0.030% | 0.0093%(+0.021)#26 | 0.014%(+0.016)#806 |
| 27. | Lombard | 0.027% | 0.0093%(+0.018)#27 | 0.014%(+0.013)#837 |
| 28. | Algonquin | 0.027% | 0.0093%(+0.017)#28 | 0.014%(+0.013)#842 |
| 29. | Arlington Heights | 0.026% | 0.0093%(+0.017)#29 | 0.014%(+0.012)#852 |
| 30. | Lake Forest | 0.026% | 0.0093%(+0.016)#30 | 0.014%(+0.012)#856 |
| 31. | Dekalb | 0.025% | 0.0093%(+0.015)#31 | 0.014%(+0.010)#865 |
| 32. | Peoria | 0.022% | 0.0093%(+0.013)#32 | 0.014%(+0.008)#899 |
| 33. | Galesburg | 0.020% | 0.0093%(+0.011)#33 | 0.014%(+0.006)#921 |
| 34. | Des Plaines | 0.018% | 0.0093%(+0.009)#34 | 0.014%(+0.004)#948 |
| 35. | Batavia | 0.015% | 0.0093%(+0.006)#35 | 0.014%(+0.001)#992 |
| 36. | Aurora | 0.015% | 0.0093%(+0.006)#36 | 0.014%(+0.001)#996 |
| 37. | Chicago | 0.013% | 0.0093%(+0.004)#37 | 0.014%(-0.001)#1,023 |
| 38. | Park Ridge | 0.013% | 0.0093%(+0.003)#38 | 0.014%(-0.001)#1,032 |
| 39. | Elgin | 0.011% | 0.0093%(+0.001)#39 | 0.014%(-0.004)#1,074 |
| 40. | Schaumburg | 0.010% | 0.0093%(+0.001)#40 | 0.014%(-0.004)#1,077 |
| 41. | Belleville | 0.0095% | 0.0093%(+0.000)#41 | 0.014%(-0.005)#1,084 |
| 42. | Champaign | 0.0090% | 0.0093%(-0.000)#42 | 0.014%(-0.005)#1,093 |
| 43. | Naperville | 0.0054% | 0.0093%(-0.004)#43 | 0.014%(-0.009)#1,141 |
| 44. | Romeoville | 0.0050% | 0.0093%(-0.004)#44 | 0.014%(-0.009)#1,146 |
Common Questions
What are the Top 10 Cities with the Highest Percentage of Immigrants from Sweden in Illinois?
Top 10 Cities with the Highest Percentage of Immigrants from Sweden in Illinois are:
#1
1.61%
#2
0.52%
#3
0.42%
#4
0.37%
#5
0.35%
#6
0.32%
#7
0.28%
#8
0.23%
#9
0.19%
#10
0.14%
What city has the Highest Percentage of Immigrants from Sweden in Illinois?
Palos Park has the Highest Percentage of Immigrants from Sweden in Illinois with 1.61%.
What is the Percentage of Immigrants from Sweden in the State of Illinois?
Percentage of Immigrants from Sweden in Illinois is 0.0093%.
What is the Percentage of Immigrants from Sweden in the United States?
Percentage of Immigrants from Sweden in the United States is 0.014%.