Cities with the Highest Percentage of Immigrants from South Eastern Asia in Michigan
RELATED REPORTS & OPTIONS
South Eastern Asia
Michigan
Compare Cities
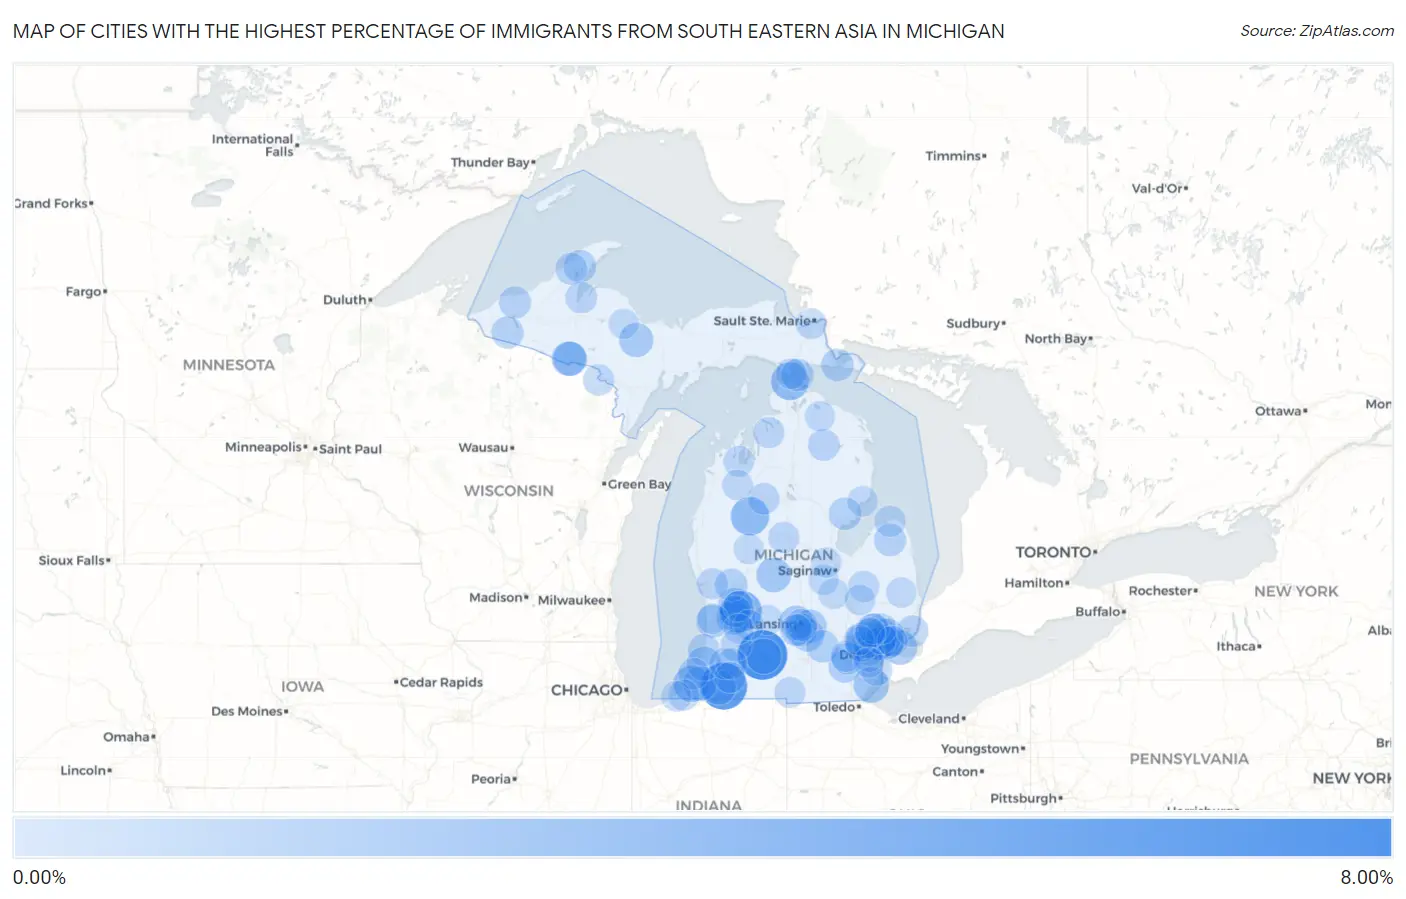
Map of Cities with the Highest Percentage of Immigrants from South Eastern Asia in Michigan
0.00%
8.00%
Cities with the Highest Percentage of Immigrants from South Eastern Asia in Michigan
| City | South Eastern Asia | vs State | vs National | |
| 1. | Springfield | 7.42% | 0.47%(+6.96)#-1 | 1.30%(+6.13)#0 |
| 2. | Vandalia | 6.43% | 0.47%(+5.96)#0 | 1.30%(+5.13)#1 |
| 3. | Kentwood | 4.36% | 0.47%(+3.90)#1 | 1.30%(+3.07)#2 |
| 4. | Tustin | 3.40% | 0.47%(+2.93)#2 | 1.30%(+2.10)#3 |
| 5. | Mackinaw City | 3.21% | 0.47%(+2.74)#3 | 1.30%(+1.91)#4 |
| 6. | Baroda | 2.57% | 0.47%(+2.10)#4 | 1.30%(+1.27)#5 |
| 7. | Cutlerville | 2.42% | 0.47%(+1.95)#5 | 1.30%(+1.12)#6 |
| 8. | Woodland Beach | 2.39% | 0.47%(+1.92)#6 | 1.30%(+1.09)#7 |
| 9. | Battle Creek | 2.36% | 0.47%(+1.90)#7 | 1.30%(+1.07)#8 |
| 10. | Village Of Grosse Pointe Shores | 2.11% | 0.47%(+1.64)#8 | 1.30%(+0.811)#9 |
| 11. | Cambria | 2.09% | 0.47%(+1.63)#9 | 1.30%(+0.798)#10 |
| 12. | Mcbride | 2.08% | 0.47%(+1.62)#10 | 1.30%(+0.787)#11 |
| 13. | Cassopolis | 2.00% | 0.47%(+1.53)#11 | 1.30%(+0.704)#12 |
| 14. | Berrien Springs | 1.98% | 0.47%(+1.51)#12 | 1.30%(+0.682)#13 |
| 15. | Caspian | 1.96% | 0.47%(+1.50)#13 | 1.30%(+0.668)#14 |
| 16. | Byron Center | 1.96% | 0.47%(+1.49)#14 | 1.30%(+0.664)#15 |
| 17. | Gwinn | 1.90% | 0.47%(+1.43)#15 | 1.30%(+0.601)#16 |
| 18. | Paw Paw Lake | 1.87% | 0.47%(+1.40)#16 | 1.30%(+0.570)#17 |
| 19. | Gaastra | 1.87% | 0.47%(+1.40)#17 | 1.30%(+0.569)#18 |
| 20. | Waverly | 1.84% | 0.47%(+1.38)#18 | 1.30%(+0.546)#19 |
| 21. | Walker | 1.83% | 0.47%(+1.37)#19 | 1.30%(+0.535)#20 |
| 22. | Warren | 1.82% | 0.47%(+1.36)#20 | 1.30%(+0.527)#21 |
| 23. | Okemos | 1.70% | 0.47%(+1.24)#21 | 1.30%(+0.406)#22 |
| 24. | Walled Lake | 1.65% | 0.47%(+1.19)#22 | 1.30%(+0.356)#23 |
| 25. | Mason | 1.56% | 0.47%(+1.09)#23 | 1.30%(+0.261)#24 |
| 26. | Troy | 1.51% | 0.47%(+1.04)#24 | 1.30%(+0.213)#25 |
| 27. | Holt | 1.51% | 0.47%(+1.04)#25 | 1.30%(+0.209)#26 |
| 28. | Holland | 1.50% | 0.47%(+1.04)#26 | 1.30%(+0.207)#27 |
| 29. | Pontiac | 1.49% | 0.47%(+1.03)#27 | 1.30%(+0.195)#28 |
| 30. | Saline | 1.48% | 0.47%(+1.02)#28 | 1.30%(+0.186)#29 |
| 31. | Sterling Heights | 1.46% | 0.47%(+0.992)#29 | 1.30%(+0.162)#30 |
| 32. | Casnovia | 1.39% | 0.47%(+0.919)#30 | 1.30%(+0.089)#31 |
| 33. | Turner | 1.35% | 0.47%(+0.886)#31 | 1.30%(+0.055)#32 |
| 34. | Stockbridge | 1.35% | 0.47%(+0.885)#32 | 1.30%(+0.054)#33 |
| 35. | De Tour Village | 1.33% | 0.47%(+0.862)#33 | 1.30%(+0.031)#34 |
| 36. | Mackinac Island | 1.32% | 0.47%(+0.850)#34 | 1.30%(+0.019)#35 |
| 37. | Hubbell | 1.30% | 0.47%(+0.835)#35 | 1.30%(+0.004)#36 |
| 38. | Madison Heights | 1.24% | 0.47%(+0.772)#36 | 1.30%(-0.059)#37 |
| 39. | Oak Park | 1.23% | 0.47%(+0.765)#37 | 1.30%(-0.066)#155 |
| 40. | Lansing | 1.23% | 0.47%(+0.765)#38 | 1.30%(-0.066)#156 |
| 41. | Center Line | 1.22% | 0.47%(+0.759)#39 | 1.30%(-0.072)#157 |
| 42. | Bad Axe | 1.22% | 0.47%(+0.757)#40 | 1.30%(-0.073)#158 |
| 43. | White Pine | 1.20% | 0.47%(+0.739)#41 | 1.30%(-0.091)#159 |
| 44. | Marenisco | 1.20% | 0.47%(+0.739)#42 | 1.30%(-0.091)#160 |
| 45. | Hancock | 1.13% | 0.47%(+0.661)#43 | 1.30%(-0.169)#161 |
| 46. | Novi | 1.11% | 0.47%(+0.647)#44 | 1.30%(-0.184)#162 |
| 47. | Dimondale | 1.11% | 0.47%(+0.646)#45 | 1.30%(-0.185)#163 |
| 48. | South Haven | 1.10% | 0.47%(+0.635)#46 | 1.30%(-0.196)#164 |
| 49. | Pearl Beach | 1.07% | 0.47%(+0.600)#47 | 1.30%(-0.230)#165 |
| 50. | Zeba | 1.05% | 0.47%(+0.581)#48 | 1.30%(-0.249)#166 |
| 51. | Atlanta | 1.04% | 0.47%(+0.576)#49 | 1.30%(-0.255)#167 |
| 52. | Otsego | 1.03% | 0.47%(+0.563)#50 | 1.30%(-0.268)#168 |
| 53. | Woodhaven | 1.01% | 0.47%(+0.545)#51 | 1.30%(-0.286)#169 |
| 54. | Ann Arbor | 1.00% | 0.47%(+0.534)#52 | 1.30%(-0.296)#170 |
| 55. | Lake City | 1.00% | 0.47%(+0.532)#53 | 1.30%(-0.299)#171 |
| 56. | Wyoming | 1.00% | 0.47%(+0.530)#54 | 1.30%(-0.301)#172 |
| 57. | Livonia | 0.99% | 0.47%(+0.524)#55 | 1.30%(-0.307)#173 |
| 58. | Fair Plain | 0.94% | 0.47%(+0.479)#56 | 1.30%(-0.352)#174 |
| 59. | Westland | 0.94% | 0.47%(+0.474)#57 | 1.30%(-0.357)#175 |
| 60. | Paw Paw | 0.93% | 0.47%(+0.469)#58 | 1.30%(-0.362)#176 |
| 61. | Barton Hills | 0.90% | 0.47%(+0.435)#59 | 1.30%(-0.395)#177 |
| 62. | Port Austin | 0.90% | 0.47%(+0.434)#60 | 1.30%(-0.397)#178 |
| 63. | Farmington Hills | 0.90% | 0.47%(+0.432)#61 | 1.30%(-0.399)#390 |
| 64. | Mattawan | 0.90% | 0.47%(+0.431)#62 | 1.30%(-0.400)#391 |
| 65. | Kingsford | 0.88% | 0.47%(+0.412)#63 | 1.30%(-0.419)#392 |
| 66. | Farwell | 0.87% | 0.47%(+0.406)#64 | 1.30%(-0.425)#393 |
| 67. | East Jordan | 0.85% | 0.47%(+0.387)#65 | 1.30%(-0.443)#394 |
| 68. | Wolf Lake | 0.85% | 0.47%(+0.382)#66 | 1.30%(-0.448)#395 |
| 69. | Northville | 0.84% | 0.47%(+0.372)#67 | 1.30%(-0.459)#396 |
| 70. | Marcellus | 0.83% | 0.47%(+0.366)#68 | 1.30%(-0.465)#397 |
| 71. | Otter Lake | 0.83% | 0.47%(+0.365)#69 | 1.30%(-0.465)#398 |
| 72. | Three Oaks | 0.83% | 0.47%(+0.363)#70 | 1.30%(-0.468)#399 |
| 73. | Clawson | 0.82% | 0.47%(+0.351)#71 | 1.30%(-0.480)#400 |
| 74. | Sault Ste Marie | 0.75% | 0.47%(+0.288)#72 | 1.30%(-0.543)#401 |
| 75. | Greilickville | 0.75% | 0.47%(+0.284)#73 | 1.30%(-0.546)#402 |
| 76. | Reading | 0.75% | 0.47%(+0.280)#74 | 1.30%(-0.551)#403 |
| 77. | Rochester Hills | 0.73% | 0.47%(+0.267)#75 | 1.30%(-0.564)#404 |
| 78. | Keego Harbor | 0.72% | 0.47%(+0.256)#76 | 1.30%(-0.575)#405 |
| 79. | St Ignace | 0.72% | 0.47%(+0.251)#77 | 1.30%(-0.580)#406 |
| 80. | Auburn Hills | 0.71% | 0.47%(+0.246)#78 | 1.30%(-0.585)#407 |
| 81. | Roseville | 0.69% | 0.47%(+0.225)#79 | 1.30%(-0.605)#408 |
| 82. | Buckley | 0.69% | 0.47%(+0.221)#80 | 1.30%(-0.610)#409 |
| 83. | Davison | 0.68% | 0.47%(+0.219)#81 | 1.30%(-0.612)#410 |
| 84. | Beechwood | 0.68% | 0.47%(+0.212)#82 | 1.30%(-0.618)#411 |
| 85. | East Tawas | 0.67% | 0.47%(+0.207)#83 | 1.30%(-0.624)#412 |
| 86. | New Buffalo | 0.66% | 0.47%(+0.195)#84 | 1.30%(-0.636)#413 |
| 87. | Lake Odessa | 0.66% | 0.47%(+0.192)#85 | 1.30%(-0.639)#414 |
| 88. | New Lothrop | 0.64% | 0.47%(+0.178)#86 | 1.30%(-0.652)#415 |
| 89. | St Charles | 0.64% | 0.47%(+0.178)#87 | 1.30%(-0.653)#416 |
| 90. | Grand Rapids | 0.64% | 0.47%(+0.175)#88 | 1.30%(-0.656)#417 |
| 91. | Yale | 0.63% | 0.47%(+0.169)#89 | 1.30%(-0.662)#418 |
| 92. | Wixom | 0.63% | 0.47%(+0.164)#90 | 1.30%(-0.667)#419 |
| 93. | Romulus | 0.62% | 0.47%(+0.157)#91 | 1.30%(-0.674)#420 |
| 94. | Onaway | 0.62% | 0.47%(+0.149)#92 | 1.30%(-0.681)#421 |
| 95. | Freeland | 0.61% | 0.47%(+0.146)#93 | 1.30%(-0.685)#422 |
| 96. | Middleville | 0.61% | 0.47%(+0.145)#94 | 1.30%(-0.686)#423 |
| 97. | Big Rapids | 0.59% | 0.47%(+0.128)#95 | 1.30%(-0.703)#424 |
| 98. | Wayland | 0.59% | 0.47%(+0.124)#96 | 1.30%(-0.707)#425 |
| 99. | Sylvan Lake | 0.58% | 0.47%(+0.113)#97 | 1.30%(-0.718)#426 |
| 100. | Ishpeming | 0.57% | 0.47%(+0.100)#98 | 1.30%(-0.731)#427 |
Common Questions
What are the Top 10 Cities with the Highest Percentage of Immigrants from South Eastern Asia in Michigan?
Top 10 Cities with the Highest Percentage of Immigrants from South Eastern Asia in Michigan are:
#1
7.42%
#2
6.43%
#3
4.36%
#4
3.40%
#5
3.21%
#6
2.57%
#7
2.42%
#8
2.39%
#9
2.36%
#10
2.11%
What city has the Highest Percentage of Immigrants from South Eastern Asia in Michigan?
Springfield has the Highest Percentage of Immigrants from South Eastern Asia in Michigan with 7.42%.
What is the Percentage of Immigrants from South Eastern Asia in the State of Michigan?
Percentage of Immigrants from South Eastern Asia in Michigan is 0.47%.
What is the Percentage of Immigrants from South Eastern Asia in the United States?
Percentage of Immigrants from South Eastern Asia in the United States is 1.30%.