Cities with the Highest Percentage of Immigrants from South Eastern Asia in Connecticut
RELATED REPORTS & OPTIONS
South Eastern Asia
Connecticut
Compare Cities
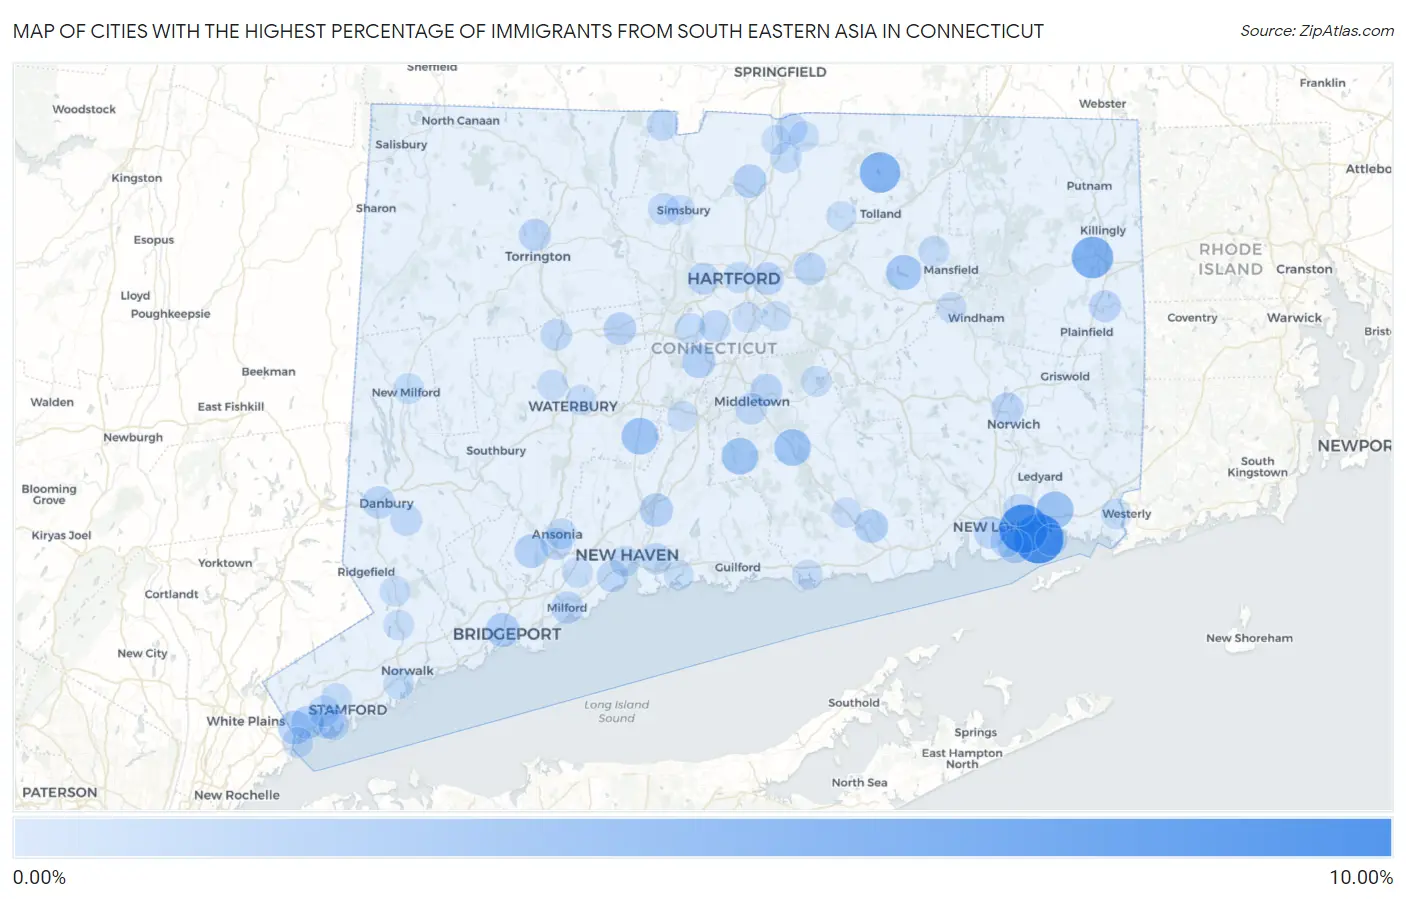
Map of Cities with the Highest Percentage of Immigrants from South Eastern Asia in Connecticut
0.00%
10.00%
Cities with the Highest Percentage of Immigrants from South Eastern Asia in Connecticut
| City | South Eastern Asia | vs State | vs National | |
| 1. | Poquonock Bridge | 8.92% | 0.66%(+8.26)#-1 | 1.30%(+7.62)#0 |
| 2. | Long Hill | 8.52% | 0.66%(+7.86)#0 | 1.30%(+7.22)#1 |
| 3. | East Brooklyn | 5.17% | 0.66%(+4.51)#1 | 1.30%(+3.87)#2 |
| 4. | Litchfield Borough | 4.87% | 0.66%(+4.21)#2 | 1.30%(+3.57)#3 |
| 5. | Crystal Lake | 4.76% | 0.66%(+4.10)#3 | 1.30%(+3.46)#4 |
| 6. | Old Mystic | 3.13% | 0.66%(+2.47)#4 | 1.30%(+1.84)#5 |
| 7. | Cheshire Village | 2.99% | 0.66%(+2.34)#5 | 1.30%(+1.70)#6 |
| 8. | Higganum | 2.95% | 0.66%(+2.30)#6 | 1.30%(+1.66)#7 |
| 9. | Durham | 2.88% | 0.66%(+2.23)#7 | 1.30%(+1.59)#8 |
| 10. | Daniels Farm | 2.75% | 0.66%(+2.10)#8 | 1.30%(+1.46)#9 |
| 11. | Noroton | 2.57% | 0.66%(+1.91)#9 | 1.30%(+1.27)#10 |
| 12. | South Coventry | 2.32% | 0.66%(+1.66)#10 | 1.30%(+1.02)#11 |
| 13. | Bigelow Corners | 2.03% | 0.66%(+1.37)#11 | 1.30%(+0.734)#12 |
| 14. | Tashua | 1.82% | 0.66%(+1.16)#12 | 1.30%(+0.525)#13 |
| 15. | Bridgeport | 1.76% | 0.66%(+1.11)#13 | 1.30%(+0.467)#14 |
| 16. | Groton | 1.75% | 0.66%(+1.09)#14 | 1.30%(+0.455)#15 |
| 17. | Pemberwick | 1.71% | 0.66%(+1.06)#15 | 1.30%(+0.416)#16 |
| 18. | North Haven | 1.55% | 0.66%(+0.890)#16 | 1.30%(+0.250)#17 |
| 19. | Kensington | 1.54% | 0.66%(+0.888)#17 | 1.30%(+0.249)#18 |
| 20. | Windsor Locks | 1.52% | 0.66%(+0.863)#18 | 1.30%(+0.224)#19 |
| 21. | Essex Village | 1.50% | 0.66%(+0.847)#19 | 1.30%(+0.208)#20 |
| 22. | Shelton | 1.50% | 0.66%(+0.843)#20 | 1.30%(+0.203)#21 |
| 23. | Lordship | 1.38% | 0.66%(+0.719)#21 | 1.30%(+0.080)#22 |
| 24. | Riverside | 1.36% | 0.66%(+0.706)#22 | 1.30%(+0.067)#23 |
| 25. | Greenwich | 1.35% | 0.66%(+0.688)#23 | 1.30%(+0.049)#24 |
| 26. | Saugatuck | 1.33% | 0.66%(+0.677)#24 | 1.30%(+0.037)#25 |
| 27. | Indian Field | 1.33% | 0.66%(+0.673)#25 | 1.30%(+0.034)#26 |
| 28. | East Hartford | 1.16% | 0.66%(+0.501)#26 | 1.30%(-0.138)#27 |
| 29. | Bristol | 1.15% | 0.66%(+0.491)#27 | 1.30%(-0.148)#28 |
| 30. | Danbury | 1.10% | 0.66%(+0.443)#28 | 1.30%(-0.196)#29 |
| 31. | Torrington | 1.06% | 0.66%(+0.399)#29 | 1.30%(-0.240)#30 |
| 32. | Botsford | 1.05% | 0.66%(+0.394)#30 | 1.30%(-0.246)#31 |
| 33. | Norwich | 1.05% | 0.66%(+0.389)#31 | 1.30%(-0.250)#32 |
| 34. | Waterford | 1.04% | 0.66%(+0.381)#32 | 1.30%(-0.258)#33 |
| 35. | Manchester | 1.03% | 0.66%(+0.369)#33 | 1.30%(-0.270)#34 |
| 36. | Portland | 1.00% | 0.66%(+0.340)#34 | 1.30%(-0.299)#35 |
| 37. | Milford City Balance | 0.97% | 0.66%(+0.312)#35 | 1.30%(-0.327)#36 |
| 38. | New London | 0.92% | 0.66%(+0.267)#36 | 1.30%(-0.372)#37 |
| 39. | Sandy Hook | 0.90% | 0.66%(+0.238)#37 | 1.30%(-0.401)#38 |
| 40. | Cornwall Bridge | 0.87% | 0.66%(+0.216)#38 | 1.30%(-0.423)#39 |
| 41. | Derby | 0.87% | 0.66%(+0.216)#39 | 1.30%(-0.423)#40 |
| 42. | Moosup | 0.85% | 0.66%(+0.193)#40 | 1.30%(-0.446)#41 |
| 43. | Noank | 0.82% | 0.66%(+0.162)#41 | 1.30%(-0.477)#42 |
| 44. | West Hartford | 0.82% | 0.66%(+0.162)#42 | 1.30%(-0.477)#350 |
| 45. | Bethel | 0.81% | 0.66%(+0.157)#43 | 1.30%(-0.483)#351 |
| 46. | Middletown | 0.79% | 0.66%(+0.128)#44 | 1.30%(-0.511)#352 |
| 47. | North Granby | 0.77% | 0.66%(+0.114)#45 | 1.30%(-0.525)#353 |
| 48. | Sherwood Manor | 0.77% | 0.66%(+0.110)#46 | 1.30%(-0.529)#354 |
| 49. | Newington | 0.76% | 0.66%(+0.108)#47 | 1.30%(-0.531)#355 |
| 50. | Conning Towers Nautilus Park | 0.76% | 0.66%(+0.099)#48 | 1.30%(-0.540)#356 |
| 51. | West Haven | 0.73% | 0.66%(+0.073)#49 | 1.30%(-0.566)#357 |
| 52. | East | 0.72% | 0.66%(+0.059)#50 | 1.30%(-0.580)#358 |
| 53. | South Wilton | 0.70% | 0.66%(+0.043)#51 | 1.30%(-0.596)#359 |
| 54. | East Haven | 0.67% | 0.66%(+0.017)#52 | 1.30%(-0.622)#360 |
| 55. | Thomaston | 0.67% | 0.66%(+0.014)#53 | 1.30%(-0.625)#361 |
| 56. | Stratford Downtown | 0.67% | 0.66%(+0.010)#54 | 1.30%(-0.629)#362 |
| 57. | Noroton Heights | 0.67% | 0.66%(+0.008)#55 | 1.30%(-0.631)#363 |
| 58. | Cos Cob | 0.65% | 0.66%(-0.008)#56 | 1.30%(-0.647)#364 |
| 59. | West Simsbury | 0.64% | 0.66%(-0.013)#57 | 1.30%(-0.653)#365 |
| 60. | Staples | 0.56% | 0.66%(-0.102)#58 | 1.30%(-0.741)#366 |
| 61. | Sacred Heart University | 0.55% | 0.66%(-0.106)#59 | 1.30%(-0.745)#367 |
| 62. | Hartford | 0.53% | 0.66%(-0.127)#60 | 1.30%(-0.766)#368 |
| 63. | New Britain | 0.51% | 0.66%(-0.149)#61 | 1.30%(-0.788)#369 |
| 64. | Stamford | 0.51% | 0.66%(-0.151)#62 | 1.30%(-0.790)#370 |
| 65. | Route 7 Gateway | 0.50% | 0.66%(-0.162)#63 | 1.30%(-0.801)#371 |
| 66. | Trumbull Center | 0.48% | 0.66%(-0.173)#64 | 1.30%(-0.813)#372 |
| 67. | Storrs | 0.48% | 0.66%(-0.174)#65 | 1.30%(-0.814)#373 |
| 68. | Naugatuck Borough | 0.47% | 0.66%(-0.187)#66 | 1.30%(-0.826)#374 |
| 69. | Newtown Borough | 0.46% | 0.66%(-0.198)#67 | 1.30%(-0.837)#375 |
| 70. | Norwalk | 0.43% | 0.66%(-0.227)#68 | 1.30%(-0.866)#385 |
| 71. | Byram | 0.42% | 0.66%(-0.241)#69 | 1.30%(-0.880)#386 |
| 72. | Southwood Acres | 0.42% | 0.66%(-0.241)#70 | 1.30%(-0.880)#387 |
| 73. | Pawcatuck | 0.41% | 0.66%(-0.244)#71 | 1.30%(-0.883)#388 |
| 74. | Westport | 0.41% | 0.66%(-0.245)#72 | 1.30%(-0.884)#389 |
| 75. | New Haven | 0.41% | 0.66%(-0.248)#73 | 1.30%(-0.887)#390 |
| 76. | Quinnipiac University | 0.41% | 0.66%(-0.251)#74 | 1.30%(-0.890)#391 |
| 77. | New Milford | 0.39% | 0.66%(-0.263)#75 | 1.30%(-0.902)#392 |
| 78. | Ansonia | 0.39% | 0.66%(-0.272)#76 | 1.30%(-0.911)#393 |
| 79. | Coleytown | 0.38% | 0.66%(-0.274)#77 | 1.30%(-0.913)#394 |
| 80. | Ridgebury | 0.37% | 0.66%(-0.291)#78 | 1.30%(-0.931)#395 |
| 81. | Oakville | 0.35% | 0.66%(-0.306)#79 | 1.30%(-0.945)#396 |
| 82. | Lake Pocotopaug | 0.34% | 0.66%(-0.321)#80 | 1.30%(-0.960)#397 |
| 83. | Old Greenwich | 0.31% | 0.66%(-0.346)#81 | 1.30%(-0.985)#398 |
| 84. | Georgetown | 0.30% | 0.66%(-0.355)#82 | 1.30%(-0.994)#399 |
| 85. | Waterbury | 0.29% | 0.66%(-0.368)#83 | 1.30%(-1.01)#400 |
| 86. | Clinton | 0.29% | 0.66%(-0.368)#84 | 1.30%(-1.01)#401 |
| 87. | Fairfield University | 0.25% | 0.66%(-0.405)#85 | 1.30%(-1.04)#402 |
| 88. | Meriden | 0.25% | 0.66%(-0.411)#86 | 1.30%(-1.05)#403 |
| 89. | Orange | 0.25% | 0.66%(-0.411)#87 | 1.30%(-1.05)#404 |
| 90. | Wilton Center | 0.24% | 0.66%(-0.414)#88 | 1.30%(-1.05)#405 |
| 91. | Hazardville | 0.21% | 0.66%(-0.445)#89 | 1.30%(-1.08)#406 |
| 92. | Wethersfield | 0.21% | 0.66%(-0.448)#90 | 1.30%(-1.09)#407 |
| 93. | Woodmont Borough | 0.19% | 0.66%(-0.472)#91 | 1.30%(-1.11)#408 |
| 94. | Deep River Center | 0.19% | 0.66%(-0.472)#92 | 1.30%(-1.11)#409 |
| 95. | Branford Center | 0.16% | 0.66%(-0.496)#93 | 1.30%(-1.14)#410 |
| 96. | Glastonbury Center | 0.15% | 0.66%(-0.506)#94 | 1.30%(-1.15)#411 |
| 97. | Simsbury Center | 0.15% | 0.66%(-0.510)#95 | 1.30%(-1.15)#412 |
| 98. | Willimantic | 0.13% | 0.66%(-0.528)#96 | 1.30%(-1.17)#413 |
| 99. | Rockville | 0.13% | 0.66%(-0.528)#97 | 1.30%(-1.17)#414 |
| 100. | Thompsonville | 0.049% | 0.66%(-0.608)#98 | 1.30%(-1.25)#415 |
1
2Common Questions
What are the Top 10 Cities with the Highest Percentage of Immigrants from South Eastern Asia in Connecticut?
Top 10 Cities with the Highest Percentage of Immigrants from South Eastern Asia in Connecticut are:
#1
8.92%
#2
8.52%
#3
5.17%
#4
4.76%
#5
3.13%
#6
2.99%
#7
2.95%
#8
2.88%
#9
2.32%
#10
1.76%
What city has the Highest Percentage of Immigrants from South Eastern Asia in Connecticut?
Poquonock Bridge has the Highest Percentage of Immigrants from South Eastern Asia in Connecticut with 8.92%.
What is the Percentage of Immigrants from South Eastern Asia in the State of Connecticut?
Percentage of Immigrants from South Eastern Asia in Connecticut is 0.66%.
What is the Percentage of Immigrants from South Eastern Asia in the United States?
Percentage of Immigrants from South Eastern Asia in the United States is 1.30%.