Cities with the Most Immigrants from Israel in Illinois
RELATED REPORTS & OPTIONS
Israel
Illinois
Compare Cities
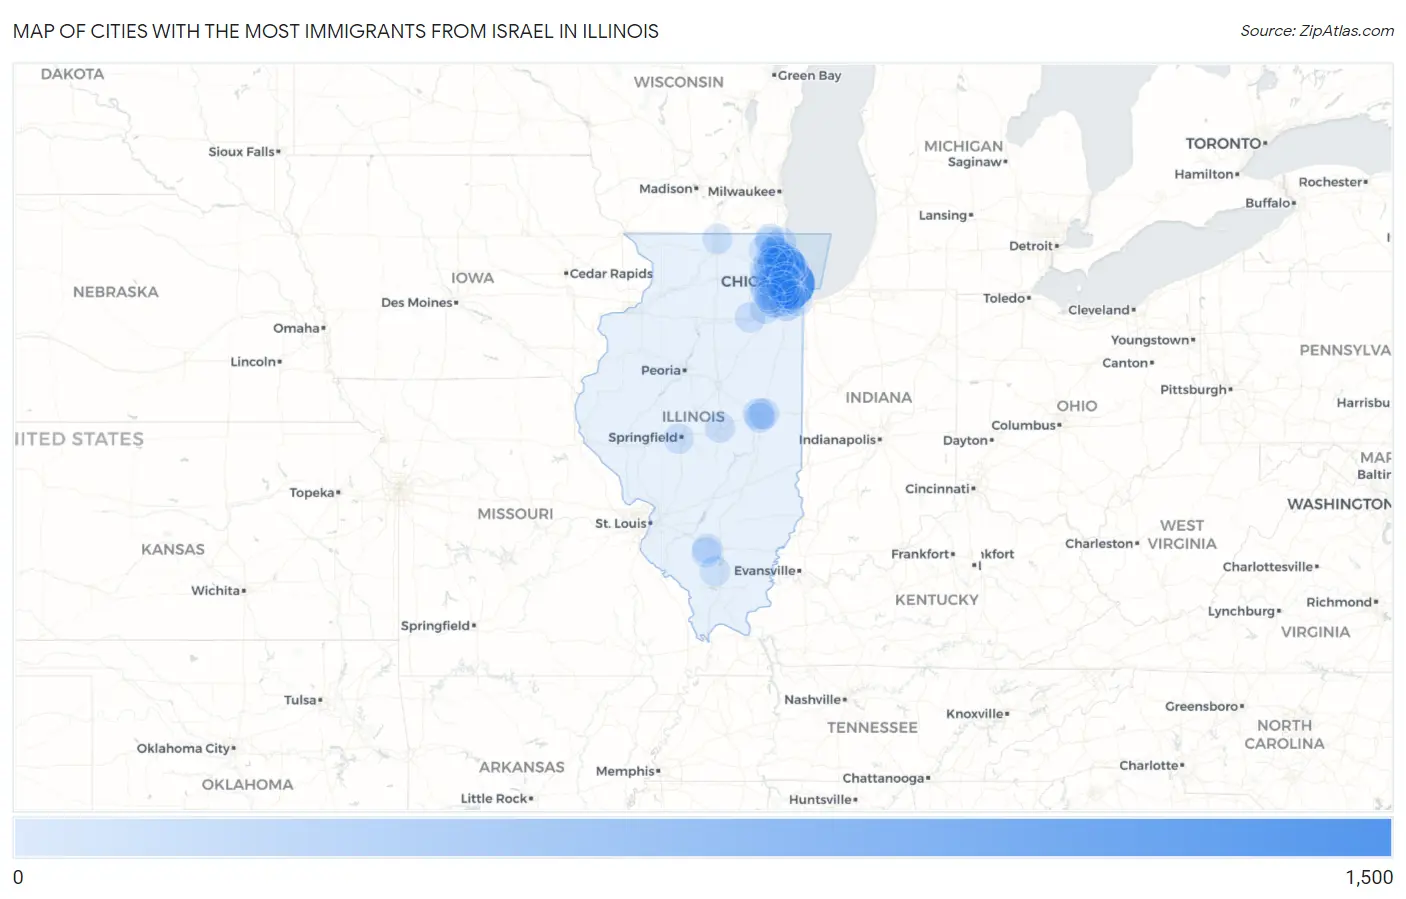
Map of Cities with the Most Immigrants from Israel in Illinois
0
1,500
Cities with the Most Immigrants from Israel in Illinois
| City | Israel | vs State | vs National | |
| 1. | Chicago | 1,417 | 4,177(33.92%)#1 | 139,089(1.02%)#6 |
| 2. | Skokie | 294 | 4,177(7.04%)#2 | 139,089(0.21%)#57 |
| 3. | Evanston | 178 | 4,177(4.26%)#3 | 139,089(0.13%)#100 |
| 4. | Tinley Park | 142 | 4,177(3.40%)#4 | 139,089(0.10%)#135 |
| 5. | Palos Heights | 109 | 4,177(2.61%)#5 | 139,089(0.08%)#193 |
| 6. | Cicero | 100 | 4,177(2.39%)#6 | 139,089(0.07%)#211 |
| 7. | Buffalo Grove | 93 | 4,177(2.23%)#7 | 139,089(0.07%)#223 |
| 8. | Lincolnwood | 76 | 4,177(1.82%)#8 | 139,089(0.05%)#271 |
| 9. | Champaign | 74 | 4,177(1.77%)#9 | 139,089(0.05%)#275 |
| 10. | Oak Lawn | 58 | 4,177(1.39%)#10 | 139,089(0.04%)#343 |
| 11. | Westmont | 58 | 4,177(1.39%)#11 | 139,089(0.04%)#345 |
| 12. | Wilmette | 57 | 4,177(1.36%)#12 | 139,089(0.04%)#351 |
| 13. | Urbana | 51 | 4,177(1.22%)#13 | 139,089(0.04%)#385 |
| 14. | Vernon Hills | 51 | 4,177(1.22%)#14 | 139,089(0.04%)#387 |
| 15. | Hickory Hills | 50 | 4,177(1.20%)#15 | 139,089(0.04%)#393 |
| 16. | Naperville | 48 | 4,177(1.15%)#16 | 139,089(0.03%)#402 |
| 17. | Bridgeview | 48 | 4,177(1.15%)#17 | 139,089(0.03%)#409 |
| 18. | Northbrook | 46 | 4,177(1.10%)#18 | 139,089(0.03%)#422 |
| 19. | Highland Park | 45 | 4,177(1.08%)#19 | 139,089(0.03%)#435 |
| 20. | Streamwood | 42 | 4,177(1.01%)#20 | 139,089(0.03%)#470 |
| 21. | Mount Prospect | 41 | 4,177(0.98%)#21 | 139,089(0.03%)#478 |
| 22. | Park Ridge | 41 | 4,177(0.98%)#22 | 139,089(0.03%)#480 |
| 23. | Alsip | 39 | 4,177(0.93%)#23 | 139,089(0.03%)#503 |
| 24. | Schiller Park | 37 | 4,177(0.89%)#24 | 139,089(0.03%)#518 |
| 25. | Glenview | 35 | 4,177(0.84%)#25 | 139,089(0.03%)#538 |
| 26. | Worth | 34 | 4,177(0.81%)#26 | 139,089(0.02%)#561 |
| 27. | Lincolnshire | 34 | 4,177(0.81%)#27 | 139,089(0.02%)#565 |
| 28. | Burbank | 31 | 4,177(0.74%)#28 | 139,089(0.02%)#609 |
| 29. | Homer Glen | 31 | 4,177(0.74%)#29 | 139,089(0.02%)#610 |
| 30. | Chicago Ridge | 31 | 4,177(0.74%)#30 | 139,089(0.02%)#611 |
| 31. | Lockport | 29 | 4,177(0.69%)#31 | 139,089(0.02%)#630 |
| 32. | Deerfield | 28 | 4,177(0.67%)#32 | 139,089(0.02%)#647 |
| 33. | Winnetka | 28 | 4,177(0.67%)#33 | 139,089(0.02%)#649 |
| 34. | Savoy | 27 | 4,177(0.65%)#34 | 139,089(0.02%)#674 |
| 35. | Orland Park | 25 | 4,177(0.60%)#35 | 139,089(0.02%)#702 |
| 36. | Kildeer | 24 | 4,177(0.57%)#36 | 139,089(0.02%)#735 |
| 37. | Libertyville | 23 | 4,177(0.55%)#37 | 139,089(0.02%)#751 |
| 38. | Crestwood | 23 | 4,177(0.55%)#38 | 139,089(0.02%)#754 |
| 39. | Oak Brook | 20 | 4,177(0.48%)#39 | 139,089(0.01%)#817 |
| 40. | Arlington Heights | 19 | 4,177(0.45%)#40 | 139,089(0.01%)#829 |
| 41. | Morton Grove | 19 | 4,177(0.45%)#41 | 139,089(0.01%)#847 |
| 42. | Glencoe | 18 | 4,177(0.43%)#42 | 139,089(0.01%)#874 |
| 43. | Wheaton | 17 | 4,177(0.41%)#43 | 139,089(0.01%)#896 |
| 44. | Villa Park | 17 | 4,177(0.41%)#44 | 139,089(0.01%)#903 |
| 45. | Morris | 17 | 4,177(0.41%)#45 | 139,089(0.01%)#905 |
| 46. | Elmhurst | 16 | 4,177(0.38%)#46 | 139,089(0.01%)#927 |
| 47. | Warrenville | 16 | 4,177(0.38%)#47 | 139,089(0.01%)#944 |
| 48. | Inverness | 16 | 4,177(0.38%)#48 | 139,089(0.01%)#946 |
| 49. | Joliet | 15 | 4,177(0.36%)#49 | 139,089(0.01%)#957 |
| 50. | Riverwoods | 15 | 4,177(0.36%)#50 | 139,089(0.01%)#986 |
| 51. | Forsyth | 15 | 4,177(0.36%)#51 | 139,089(0.01%)#987 |
| 52. | Palos Hills | 14 | 4,177(0.34%)#52 | 139,089(0.01%)#1,012 |
| 53. | Schaumburg | 13 | 4,177(0.31%)#53 | 139,089(0.01%)#1,029 |
| 54. | Des Plaines | 13 | 4,177(0.31%)#54 | 139,089(0.01%)#1,032 |
| 55. | Waukegan | 12 | 4,177(0.29%)#55 | 139,089(0.01%)#1,067 |
| 56. | Oak Park | 10 | 4,177(0.24%)#56 | 139,089(0.01%)#1,179 |
| 57. | Round Lake Beach | 10 | 4,177(0.24%)#57 | 139,089(0.01%)#1,188 |
| 58. | Hanover Park | 9 | 4,177(0.22%)#58 | 139,089(0.01%)#1,237 |
| 59. | Mundelein | 9 | 4,177(0.22%)#59 | 139,089(0.01%)#1,242 |
| 60. | La Grange | 9 | 4,177(0.22%)#60 | 139,089(0.01%)#1,250 |
| 61. | Justice | 9 | 4,177(0.22%)#61 | 139,089(0.01%)#1,256 |
| 62. | River Forest | 9 | 4,177(0.22%)#62 | 139,089(0.01%)#1,258 |
| 63. | Roscoe | 9 | 4,177(0.22%)#63 | 139,089(0.01%)#1,259 |
| 64. | Lyons | 9 | 4,177(0.22%)#64 | 139,089(0.01%)#1,262 |
| 65. | Lake Villa | 8 | 4,177(0.19%)#65 | 139,089(0.01%)#1,321 |
| 66. | Island Lake | 8 | 4,177(0.19%)#66 | 139,089(0.01%)#1,322 |
| 67. | Bolingbrook | 7 | 4,177(0.17%)#67 | 139,089(0.01%)#1,343 |
| 68. | Kenilworth | 7 | 4,177(0.17%)#68 | 139,089(0.01%)#1,372 |
| 69. | Wheeling | 6 | 4,177(0.14%)#69 | 139,089(0.00%)#1,385 |
| 70. | Glen Ellyn | 6 | 4,177(0.14%)#70 | 139,089(0.00%)#1,389 |
| 71. | Western Springs | 6 | 4,177(0.14%)#71 | 139,089(0.00%)#1,396 |
| 72. | Merrionette Park | 6 | 4,177(0.14%)#72 | 139,089(0.00%)#1,411 |
| 73. | Christopher | 5 | 4,177(0.12%)#73 | 139,089(0.00%)#1,448 |
| 74. | Palatine | 3 | 4,177(0.07%)#74 | 139,089(0.00%)#1,496 |
| 75. | Elmwood Park | 3 | 4,177(0.07%)#75 | 139,089(0.00%)#1,505 |
| 76. | Leland Grove | 3 | 4,177(0.07%)#76 | 139,089(0.00%)#1,523 |
| 77. | South Holland | 2 | 4,177(0.05%)#77 | 139,089(0.00%)#1,539 |
| 78. | Du Bois | 2 | 4,177(0.05%)#78 | 139,089(0.00%)#1,558 |
| 79. | Radom | 2 | 4,177(0.05%)#79 | 139,089(0.00%)#1,559 |
| 80. | Romeoville | 1 | 4,177(0.02%)#80 | 139,089(0.00%)#1,565 |
Common Questions
What are the Top 10 Cities with the Most Immigrants from Israel in Illinois?
Top 10 Cities with the Most Immigrants from Israel in Illinois are:
#1
1,417
#2
294
#3
178
#4
142
#5
109
#6
100
#7
93
#8
76
#9
74
#10
58
What city has the Most Immigrants from Israel in Illinois?
Chicago has the Most Immigrants from Israel in Illinois with 1,417.
What is the Total Immigrants from Israel in the State of Illinois?
Total Immigrants from Israel in Illinois is 4,177.
What is the Total Immigrants from Israel in the United States?
Total Immigrants from Israel in the United States is 139,089.