Cities with the Highest Percentage of Population Enrolled in Private School in Illinois
RELATED REPORTS & OPTIONS
In Private School
Illinois
Compare Cities
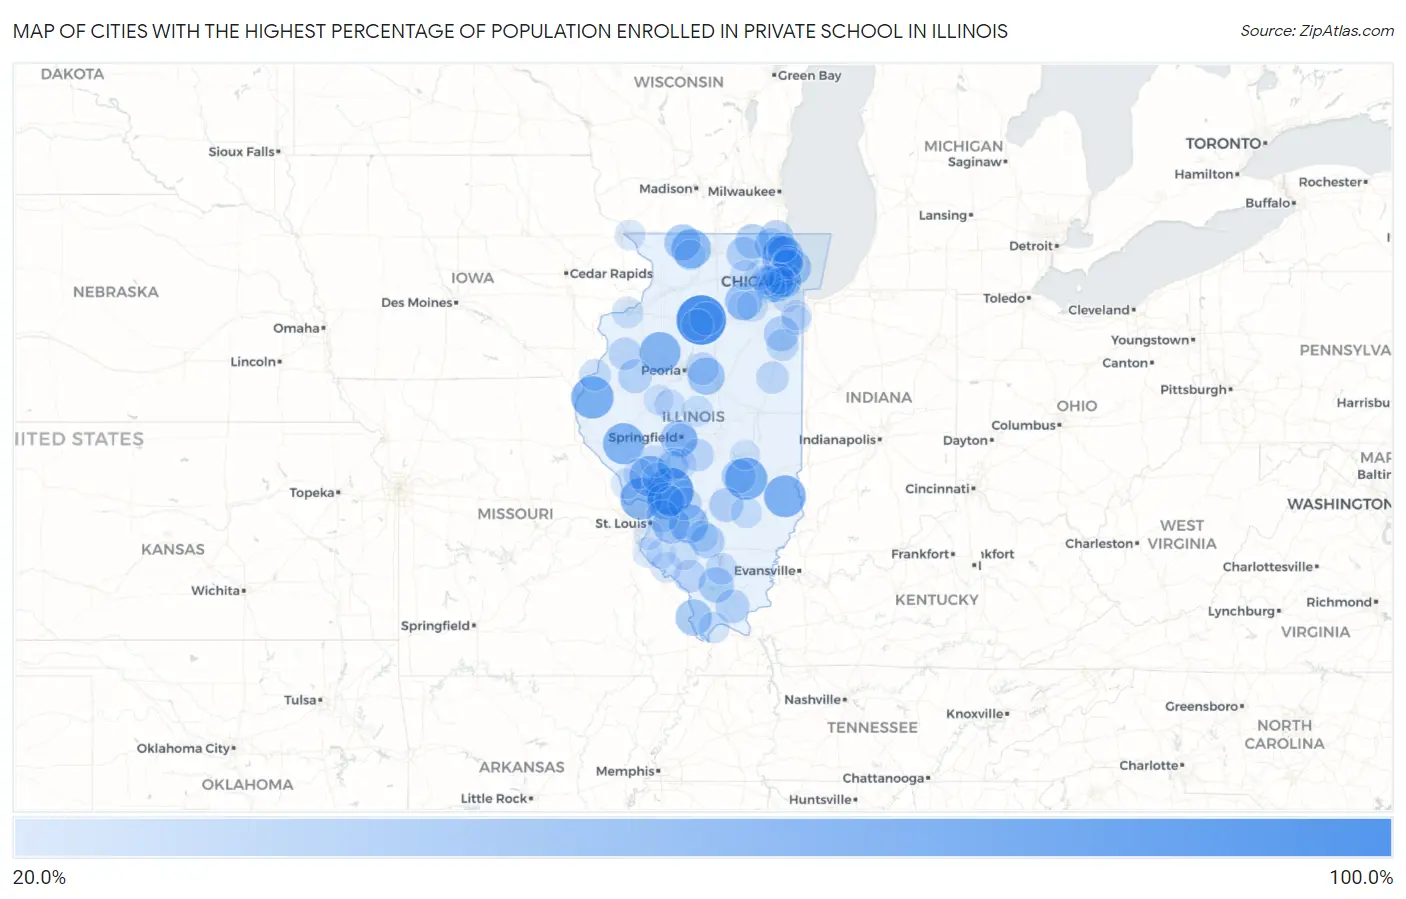
Map of Cities with the Highest Percentage of Population Enrolled in Private School in Illinois
0.0%
100.0%
Cities with the Highest Percentage of Population Enrolled in Private School in Illinois
| City | % in Private School | vs State | vs National | |
| 1. | Shirley | 100.0% | 19.3%(+80.7)#1 | 17.3%(+82.7)#200 |
| 2. | Hollowayville | 100.0% | 19.3%(+80.7)#3 | 17.3%(+82.7)#232 |
| 3. | Andres | 100.0% | 19.3%(+80.7)#4 | 17.3%(+82.7)#233 |
| 4. | Custer Park | 95.5% | 19.3%(+76.2)#5 | 17.3%(+78.2)#270 |
| 5. | Wilsonville | 90.4% | 19.3%(+71.1)#6 | 17.3%(+73.1)#297 |
| 6. | Basco | 72.7% | 19.3%(+53.4)#7 | 17.3%(+55.4)#473 |
| 7. | Sigel | 72.4% | 19.3%(+53.1)#8 | 17.3%(+55.1)#475 |
| 8. | Stoy | 71.1% | 19.3%(+51.8)#9 | 17.3%(+53.8)#498 |
| 9. | Elsah | 70.8% | 19.3%(+51.5)#10 | 17.3%(+53.5)#502 |
| 10. | Wilton Center | 70.6% | 19.3%(+51.3)#11 | 17.3%(+53.3)#506 |
| 11. | Valley City | 69.2% | 19.3%(+49.9)#12 | 17.3%(+51.9)#529 |
| 12. | Bannockburn | 69.0% | 19.3%(+49.7)#13 | 17.3%(+51.7)#533 |
| 13. | Williamsfield | 68.2% | 19.3%(+48.9)#14 | 17.3%(+50.9)#551 |
| 14. | Rockbridge | 67.9% | 19.3%(+48.6)#15 | 17.3%(+50.6)#557 |
| 15. | Argyle | 65.8% | 19.3%(+46.5)#16 | 17.3%(+48.5)#605 |
| 16. | Ridott | 61.9% | 19.3%(+42.6)#17 | 17.3%(+44.6)#702 |
| 17. | Oakbrook Terrace | 60.1% | 19.3%(+40.8)#18 | 17.3%(+42.8)#751 |
| 18. | Osco | 60.0% | 19.3%(+40.7)#19 | 17.3%(+42.7)#762 |
| 19. | Breese | 59.6% | 19.3%(+40.3)#20 | 17.3%(+42.3)#771 |
| 20. | Millbrook | 54.8% | 19.3%(+35.5)#21 | 17.3%(+37.5)#952 |
| 21. | Evanston | 53.7% | 19.3%(+34.4)#22 | 17.3%(+36.4)#999 |
| 22. | Lebanon | 53.5% | 19.3%(+34.2)#23 | 17.3%(+36.2)#1,008 |
| 23. | Congerville | 53.5% | 19.3%(+34.2)#24 | 17.3%(+36.2)#1,011 |
| 24. | Holiday Shores | 52.2% | 19.3%(+32.9)#25 | 17.3%(+34.9)#1,059 |
| 25. | Leland Grove | 52.1% | 19.3%(+32.8)#26 | 17.3%(+34.8)#1,062 |
| 26. | Mcclure | 51.2% | 19.3%(+31.9)#27 | 17.3%(+33.9)#1,099 |
| 27. | Sunnyland | 51.0% | 19.3%(+31.7)#28 | 17.3%(+33.7)#1,114 |
| 28. | Cedarville | 50.4% | 19.3%(+31.1)#29 | 17.3%(+33.1)#1,133 |
| 29. | Energy | 47.2% | 19.3%(+27.9)#30 | 17.3%(+29.9)#1,296 |
| 30. | Bourbonnais | 45.9% | 19.3%(+26.6)#31 | 17.3%(+28.6)#1,386 |
| 31. | Old Mill Creek | 44.4% | 19.3%(+25.1)#32 | 17.3%(+27.1)#1,507 |
| 32. | Greenwood | 43.8% | 19.3%(+24.5)#33 | 17.3%(+26.5)#1,551 |
| 33. | Stewardson | 43.5% | 19.3%(+24.2)#34 | 17.3%(+26.2)#1,573 |
| 34. | Union | 43.0% | 19.3%(+23.7)#35 | 17.3%(+25.7)#1,611 |
| 35. | St Peter | 42.9% | 19.3%(+23.6)#36 | 17.3%(+25.6)#1,622 |
| 36. | Richview | 42.9% | 19.3%(+23.6)#37 | 17.3%(+25.6)#1,625 |
| 37. | Mettawa | 42.6% | 19.3%(+23.3)#38 | 17.3%(+25.3)#1,653 |
| 38. | Hainesville | 42.2% | 19.3%(+22.9)#39 | 17.3%(+24.9)#1,680 |
| 39. | Prairie City | 42.1% | 19.3%(+22.8)#40 | 17.3%(+24.8)#1,688 |
| 40. | Simpson | 41.7% | 19.3%(+22.4)#41 | 17.3%(+24.4)#1,732 |
| 41. | Ladd | 40.5% | 19.3%(+21.2)#42 | 17.3%(+23.2)#1,818 |
| 42. | Forest Park | 39.4% | 19.3%(+20.1)#43 | 17.3%(+22.1)#1,924 |
| 43. | River Forest | 39.0% | 19.3%(+19.7)#44 | 17.3%(+21.7)#1,954 |
| 44. | Southern View | 38.8% | 19.3%(+19.5)#45 | 17.3%(+21.5)#1,978 |
| 45. | Old Ripley | 38.5% | 19.3%(+19.2)#46 | 17.3%(+21.2)#2,019 |
| 46. | Ava | 38.4% | 19.3%(+19.1)#47 | 17.3%(+21.1)#2,027 |
| 47. | Edgington | 38.1% | 19.3%(+18.8)#48 | 17.3%(+20.8)#2,068 |
| 48. | Eureka | 38.0% | 19.3%(+18.7)#49 | 17.3%(+20.7)#2,074 |
| 49. | Langleyville | 38.0% | 19.3%(+18.7)#50 | 17.3%(+20.7)#2,083 |
| 50. | Lake Forest | 37.8% | 19.3%(+18.5)#51 | 17.3%(+20.5)#2,100 |
| 51. | Monmouth | 37.8% | 19.3%(+18.5)#52 | 17.3%(+20.5)#2,102 |
| 52. | Golf | 37.7% | 19.3%(+18.4)#53 | 17.3%(+20.4)#2,123 |
| 53. | Maryville | 37.4% | 19.3%(+18.1)#54 | 17.3%(+20.1)#2,154 |
| 54. | Buckley | 37.3% | 19.3%(+18.0)#55 | 17.3%(+20.0)#2,164 |
| 55. | Wheaton | 36.5% | 19.3%(+17.2)#56 | 17.3%(+19.2)#2,247 |
| 56. | Sammons Point | 36.0% | 19.3%(+16.7)#57 | 17.3%(+18.7)#2,327 |
| 57. | Arbury Hills | 35.6% | 19.3%(+16.3)#58 | 17.3%(+18.3)#2,385 |
| 58. | Girard | 35.4% | 19.3%(+16.1)#59 | 17.3%(+18.1)#2,411 |
| 59. | Bureau Junction | 35.0% | 19.3%(+15.7)#60 | 17.3%(+17.7)#2,463 |
| 60. | Dallas City | 34.9% | 19.3%(+15.6)#61 | 17.3%(+17.6)#2,472 |
| 61. | West City | 34.5% | 19.3%(+15.2)#62 | 17.3%(+17.2)#2,551 |
| 62. | Oak Brook | 34.0% | 19.3%(+14.7)#63 | 17.3%(+16.7)#2,618 |
| 63. | Palos Heights | 33.3% | 19.3%(+14.0)#64 | 17.3%(+16.0)#2,734 |
| 64. | Willow Lake | 33.3% | 19.3%(+14.0)#65 | 17.3%(+16.0)#2,748 |
| 65. | Olmsted | 33.3% | 19.3%(+14.0)#66 | 17.3%(+16.0)#2,767 |
| 66. | Scottville | 33.3% | 19.3%(+14.0)#67 | 17.3%(+16.0)#2,799 |
| 67. | Hoyleton | 33.1% | 19.3%(+13.8)#68 | 17.3%(+15.8)#2,835 |
| 68. | Rock Island | 33.0% | 19.3%(+13.7)#69 | 17.3%(+15.7)#2,837 |
| 69. | Lisle | 32.8% | 19.3%(+13.5)#70 | 17.3%(+15.5)#2,868 |
| 70. | Plattville | 32.5% | 19.3%(+13.2)#71 | 17.3%(+15.2)#2,929 |
| 71. | Lincoln | 32.4% | 19.3%(+13.1)#72 | 17.3%(+15.1)#2,931 |
| 72. | Louisville | 32.4% | 19.3%(+13.1)#73 | 17.3%(+15.1)#2,937 |
| 73. | Easton | 32.1% | 19.3%(+12.8)#74 | 17.3%(+14.8)#2,990 |
| 74. | Glencoe | 32.0% | 19.3%(+12.7)#75 | 17.3%(+14.7)#2,993 |
| 75. | Farmersville | 31.6% | 19.3%(+12.3)#76 | 17.3%(+14.3)#3,077 |
| 76. | Northfield | 31.4% | 19.3%(+12.1)#77 | 17.3%(+14.1)#3,099 |
| 77. | Carrollton | 31.4% | 19.3%(+12.1)#78 | 17.3%(+14.1)#3,102 |
| 78. | Worden | 31.1% | 19.3%(+11.8)#79 | 17.3%(+13.8)#3,150 |
| 79. | Ellis Grove | 31.1% | 19.3%(+11.8)#80 | 17.3%(+13.8)#3,156 |
| 80. | Elmhurst | 31.0% | 19.3%(+11.7)#81 | 17.3%(+13.7)#3,162 |
| 81. | German Valley | 31.0% | 19.3%(+11.7)#82 | 17.3%(+13.7)#3,173 |
| 82. | Nilwood | 30.8% | 19.3%(+11.5)#83 | 17.3%(+13.5)#3,223 |
| 83. | Nachusa | 30.8% | 19.3%(+11.5)#84 | 17.3%(+13.5)#3,224 |
| 84. | Westchester | 30.7% | 19.3%(+11.4)#85 | 17.3%(+13.4)#3,232 |
| 85. | Hardin | 30.6% | 19.3%(+11.3)#86 | 17.3%(+13.3)#3,251 |
| 86. | Havana | 30.4% | 19.3%(+11.1)#87 | 17.3%(+13.1)#3,285 |
| 87. | Menominee | 30.2% | 19.3%(+10.9)#88 | 17.3%(+12.9)#3,363 |
| 88. | North Chicago | 29.9% | 19.3%(+10.6)#89 | 17.3%(+12.6)#3,418 |
| 89. | Wayne | 29.8% | 19.3%(+10.5)#90 | 17.3%(+12.5)#3,448 |
| 90. | Crete | 29.7% | 19.3%(+10.4)#91 | 17.3%(+12.4)#3,457 |
| 91. | Beecher | 29.6% | 19.3%(+10.3)#92 | 17.3%(+12.3)#3,477 |
| 92. | Coulterville | 29.5% | 19.3%(+10.2)#93 | 17.3%(+12.2)#3,510 |
| 93. | Winfield | 29.4% | 19.3%(+10.1)#94 | 17.3%(+12.1)#3,521 |
| 94. | Allenville | 29.4% | 19.3%(+10.1)#95 | 17.3%(+12.1)#3,539 |
| 95. | Maeystown | 29.4% | 19.3%(+10.1)#96 | 17.3%(+12.1)#3,540 |
| 96. | Red Bud | 29.3% | 19.3%(+10.00)#97 | 17.3%(+12.0)#3,551 |
| 97. | Virgil | 29.2% | 19.3%(+9.90)#98 | 17.3%(+11.9)#3,577 |
| 98. | Chesterfield | 29.1% | 19.3%(+9.80)#99 | 17.3%(+11.8)#3,604 |
| 99. | Newark | 29.0% | 19.3%(+9.70)#100 | 17.3%(+11.7)#3,618 |
| 100. | Columbia | 28.9% | 19.3%(+9.60)#101 | 17.3%(+11.6)#3,634 |
Common Questions
What are the Top 10 Cities with the Highest Percentage of Population Enrolled in Private School in Illinois?
Top 10 Cities with the Highest Percentage of Population Enrolled in Private School in Illinois are:
#1
100.0%
#2
90.4%
#3
72.7%
#4
72.4%
#5
71.1%
#6
70.8%
#7
69.2%
#8
69.0%
#9
68.2%
#10
67.9%
What city has the Highest Percentage of Population Enrolled in Private School in Illinois?
Hollowayville has the Highest Percentage of Population Enrolled in Private School in Illinois with 100.0%.
What is the Percentage of Population Enrolled in Private School in the State of Illinois?
Percentage of Population Enrolled in Private School in Illinois is 19.3%.
What is the Percentage of Population Enrolled in Private School in the United States?
Percentage of Population Enrolled in Private School in the United States is 17.3%.