Cities with the Highest Percentage of Immigrants from South Eastern Asia in Louisiana
RELATED REPORTS & OPTIONS
South Eastern Asia
Louisiana
Compare Cities
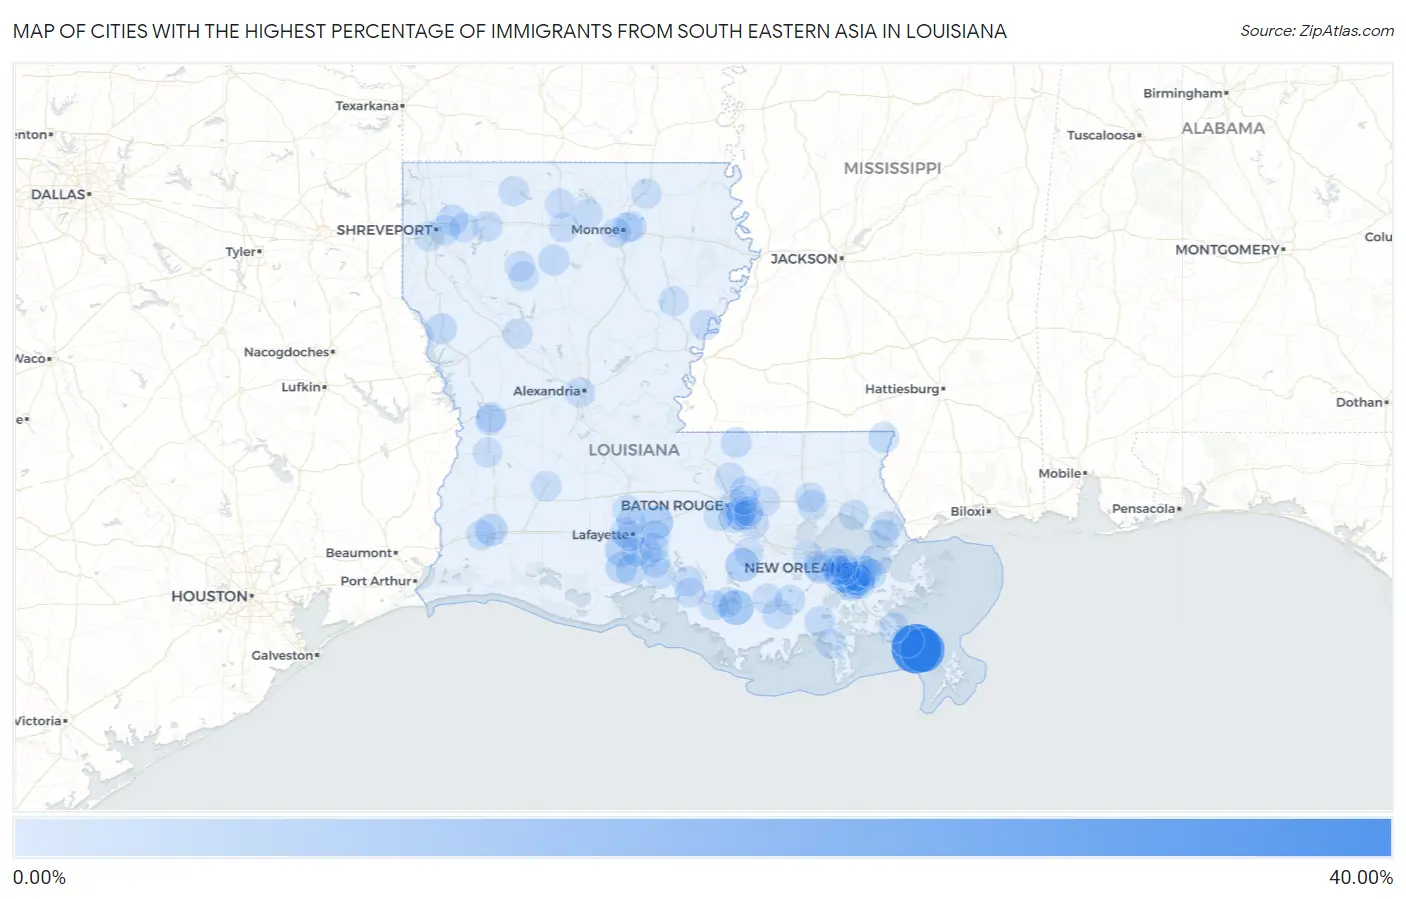
Map of Cities with the Highest Percentage of Immigrants from South Eastern Asia in Louisiana
0.00%
40.00%
Cities with the Highest Percentage of Immigrants from South Eastern Asia in Louisiana
| City | South Eastern Asia | vs State | vs National | |
| 1. | Buras | 32.90% | 0.61%(+32.3)#-1 | 1.30%(+31.6)#0 |
| 2. | Triumph | 24.55% | 0.61%(+23.9)#0 | 1.30%(+23.2)#1 |
| 3. | Amelia | 8.35% | 0.61%(+7.74)#1 | 1.30%(+7.05)#2 |
| 4. | Henderson | 6.44% | 0.61%(+5.83)#2 | 1.30%(+5.14)#3 |
| 5. | Avondale | 6.24% | 0.61%(+5.63)#3 | 1.30%(+4.95)#4 |
| 6. | Paincourtville | 6.02% | 0.61%(+5.41)#4 | 1.30%(+4.72)#5 |
| 7. | Maurice | 4.60% | 0.61%(+3.99)#5 | 1.30%(+3.31)#6 |
| 8. | Marrero | 4.35% | 0.61%(+3.74)#6 | 1.30%(+3.05)#7 |
| 9. | Empire | 4.10% | 0.61%(+3.49)#7 | 1.30%(+2.81)#8 |
| 10. | Westlake | 3.90% | 0.61%(+3.29)#8 | 1.30%(+2.60)#9 |
| 11. | Harvey | 3.70% | 0.61%(+3.09)#9 | 1.30%(+2.41)#10 |
| 12. | Abbeville | 2.79% | 0.61%(+2.18)#10 | 1.30%(+1.50)#11 |
| 13. | Estelle | 2.68% | 0.61%(+2.07)#11 | 1.30%(+1.38)#12 |
| 14. | Terrytown | 2.41% | 0.61%(+1.80)#12 | 1.30%(+1.12)#13 |
| 15. | Erath | 2.38% | 0.61%(+1.76)#13 | 1.30%(+1.08)#14 |
| 16. | Arabi | 2.21% | 0.61%(+1.60)#14 | 1.30%(+0.915)#15 |
| 17. | North Hodge | 2.17% | 0.61%(+1.56)#15 | 1.30%(+0.878)#16 |
| 18. | Woodmere | 2.04% | 0.61%(+1.43)#16 | 1.30%(+0.745)#17 |
| 19. | Timberlane | 2.03% | 0.61%(+1.41)#17 | 1.30%(+0.729)#18 |
| 20. | Converse | 2.02% | 0.61%(+1.41)#18 | 1.30%(+0.726)#19 |
| 21. | Red Chute | 1.87% | 0.61%(+1.26)#19 | 1.30%(+0.578)#20 |
| 22. | Angie | 1.85% | 0.61%(+1.24)#20 | 1.30%(+0.556)#21 |
| 23. | Westwego | 1.81% | 0.61%(+1.20)#21 | 1.30%(+0.511)#22 |
| 24. | New Orleans Station | 1.76% | 0.61%(+1.15)#22 | 1.30%(+0.462)#23 |
| 25. | New Sarpy | 1.75% | 0.61%(+1.14)#23 | 1.30%(+0.458)#24 |
| 26. | Baton Rouge | 1.53% | 0.61%(+0.919)#24 | 1.30%(+0.234)#25 |
| 27. | Wilson | 1.40% | 0.61%(+0.788)#25 | 1.30%(+0.102)#26 |
| 28. | Cade | 1.38% | 0.61%(+0.767)#26 | 1.30%(+0.081)#27 |
| 29. | Lucky | 1.29% | 0.61%(+0.679)#27 | 1.30%(-0.006)#28 |
| 30. | Larose | 1.24% | 0.61%(+0.625)#28 | 1.30%(-0.061)#29 |
| 31. | Mandeville | 1.18% | 0.61%(+0.571)#29 | 1.30%(-0.114)#30 |
| 32. | Belle Chasse | 1.14% | 0.61%(+0.530)#30 | 1.30%(-0.155)#31 |
| 33. | New Orleans | 1.11% | 0.61%(+0.501)#31 | 1.30%(-0.184)#32 |
| 34. | Harahan | 1.11% | 0.61%(+0.495)#32 | 1.30%(-0.190)#33 |
| 35. | Gretna | 1.10% | 0.61%(+0.489)#33 | 1.30%(-0.197)#34 |
| 36. | Slidell | 1.07% | 0.61%(+0.463)#34 | 1.30%(-0.223)#35 |
| 37. | Port Sulphur | 1.07% | 0.61%(+0.456)#35 | 1.30%(-0.229)#36 |
| 38. | Morgan City | 1.06% | 0.61%(+0.444)#36 | 1.30%(-0.241)#37 |
| 39. | New Llano | 1.05% | 0.61%(+0.437)#37 | 1.30%(-0.248)#38 |
| 40. | Lydia | 1.02% | 0.61%(+0.414)#38 | 1.30%(-0.272)#39 |
| 41. | Chalmette | 1.02% | 0.61%(+0.408)#39 | 1.30%(-0.278)#40 |
| 42. | Metairie | 1.00% | 0.61%(+0.394)#40 | 1.30%(-0.292)#284 |
| 43. | Sibley | 0.98% | 0.61%(+0.372)#41 | 1.30%(-0.314)#285 |
| 44. | Prairieville | 0.94% | 0.61%(+0.333)#42 | 1.30%(-0.352)#286 |
| 45. | Bayou Cane | 0.92% | 0.61%(+0.311)#43 | 1.30%(-0.374)#287 |
| 46. | Patterson | 0.89% | 0.61%(+0.275)#44 | 1.30%(-0.410)#288 |
| 47. | Youngsville | 0.88% | 0.61%(+0.271)#45 | 1.30%(-0.415)#289 |
| 48. | Bossier City | 0.87% | 0.61%(+0.258)#46 | 1.30%(-0.428)#290 |
| 49. | Gardere | 0.86% | 0.61%(+0.254)#47 | 1.30%(-0.432)#291 |
| 50. | Downsville | 0.86% | 0.61%(+0.251)#48 | 1.30%(-0.434)#292 |
| 51. | Scott | 0.86% | 0.61%(+0.248)#49 | 1.30%(-0.438)#293 |
| 52. | Charenton | 0.86% | 0.61%(+0.245)#50 | 1.30%(-0.440)#294 |
| 53. | Raceland | 0.83% | 0.61%(+0.218)#51 | 1.30%(-0.467)#295 |
| 54. | New Iberia | 0.83% | 0.61%(+0.214)#52 | 1.30%(-0.471)#296 |
| 55. | Meraux | 0.79% | 0.61%(+0.184)#53 | 1.30%(-0.501)#297 |
| 56. | Vienna Bend | 0.78% | 0.61%(+0.169)#54 | 1.30%(-0.516)#298 |
| 57. | Oak Hills Place | 0.76% | 0.61%(+0.149)#55 | 1.30%(-0.536)#299 |
| 58. | Kenner | 0.74% | 0.61%(+0.131)#56 | 1.30%(-0.555)#300 |
| 59. | Zachary | 0.72% | 0.61%(+0.111)#57 | 1.30%(-0.575)#301 |
| 60. | Village St George | 0.71% | 0.61%(+0.095)#58 | 1.30%(-0.590)#302 |
| 61. | Homer | 0.69% | 0.61%(+0.083)#59 | 1.30%(-0.603)#303 |
| 62. | Leesville | 0.69% | 0.61%(+0.076)#60 | 1.30%(-0.610)#304 |
| 63. | Alexandria | 0.68% | 0.61%(+0.074)#61 | 1.30%(-0.612)#305 |
| 64. | Central | 0.68% | 0.61%(+0.070)#62 | 1.30%(-0.615)#306 |
| 65. | Inniswold | 0.67% | 0.61%(+0.063)#63 | 1.30%(-0.623)#307 |
| 66. | Ruston | 0.66% | 0.61%(+0.053)#64 | 1.30%(-0.632)#308 |
| 67. | Waterproof | 0.66% | 0.61%(+0.051)#65 | 1.30%(-0.634)#309 |
| 68. | Old Jefferson | 0.65% | 0.61%(+0.038)#66 | 1.30%(-0.647)#310 |
| 69. | Parks | 0.63% | 0.61%(+0.016)#67 | 1.30%(-0.670)#311 |
| 70. | Jefferson | 0.62% | 0.61%(+0.010)#68 | 1.30%(-0.675)#312 |
| 71. | Oberlin | 0.60% | 0.61%(-0.014)#69 | 1.30%(-0.700)#313 |
| 72. | Schriever | 0.59% | 0.61%(-0.026)#70 | 1.30%(-0.711)#314 |
| 73. | Golden Meadow | 0.58% | 0.61%(-0.026)#71 | 1.30%(-0.712)#315 |
| 74. | Bastrop | 0.56% | 0.61%(-0.050)#72 | 1.30%(-0.735)#316 |
| 75. | River Ridge | 0.55% | 0.61%(-0.057)#73 | 1.30%(-0.743)#317 |
| 76. | St Martinville | 0.55% | 0.61%(-0.060)#74 | 1.30%(-0.746)#318 |
| 77. | Ponchatoula | 0.53% | 0.61%(-0.086)#75 | 1.30%(-0.771)#319 |
| 78. | Shreveport | 0.51% | 0.61%(-0.105)#76 | 1.30%(-0.791)#320 |
| 79. | Lafayette | 0.51% | 0.61%(-0.106)#77 | 1.30%(-0.791)#321 |
| 80. | Franklin | 0.50% | 0.61%(-0.116)#78 | 1.30%(-0.801)#322 |
| 81. | Wisner | 0.45% | 0.61%(-0.159)#79 | 1.30%(-0.845)#323 |
| 82. | Saline | 0.41% | 0.61%(-0.199)#80 | 1.30%(-0.885)#324 |
| 83. | Walker | 0.41% | 0.61%(-0.202)#81 | 1.30%(-0.887)#325 |
| 84. | Eden Isle | 0.40% | 0.61%(-0.215)#82 | 1.30%(-0.900)#326 |
| 85. | Lakeshore | 0.39% | 0.61%(-0.226)#83 | 1.30%(-0.911)#327 |
| 86. | Monroe | 0.35% | 0.61%(-0.256)#84 | 1.30%(-0.942)#328 |
| 87. | Sulphur | 0.34% | 0.61%(-0.268)#85 | 1.30%(-0.953)#329 |
| 88. | Destrehan | 0.34% | 0.61%(-0.271)#86 | 1.30%(-0.956)#330 |
| 89. | Addis | 0.34% | 0.61%(-0.272)#87 | 1.30%(-0.957)#331 |
| 90. | Haughton | 0.34% | 0.61%(-0.274)#88 | 1.30%(-0.959)#332 |
| 91. | Hammond | 0.34% | 0.61%(-0.275)#89 | 1.30%(-0.960)#333 |
| 92. | Sunset | 0.33% | 0.61%(-0.278)#90 | 1.30%(-0.964)#334 |
| 93. | Deridder | 0.30% | 0.61%(-0.306)#91 | 1.30%(-0.992)#335 |
| 94. | Dubach | 0.29% | 0.61%(-0.318)#92 | 1.30%(-1.00)#336 |
| 95. | Brownsville | 0.29% | 0.61%(-0.325)#93 | 1.30%(-1.01)#337 |
| 96. | Monticello | 0.27% | 0.61%(-0.338)#94 | 1.30%(-1.02)#338 |
| 97. | Laplace | 0.26% | 0.61%(-0.352)#95 | 1.30%(-1.04)#339 |
| 98. | Carencro | 0.26% | 0.61%(-0.356)#96 | 1.30%(-1.04)#340 |
| 99. | Shenandoah | 0.25% | 0.61%(-0.358)#97 | 1.30%(-1.04)#341 |
| 100. | Donaldsonville | 0.25% | 0.61%(-0.361)#98 | 1.30%(-1.05)#342 |
Common Questions
What are the Top 10 Cities with the Highest Percentage of Immigrants from South Eastern Asia in Louisiana?
Top 10 Cities with the Highest Percentage of Immigrants from South Eastern Asia in Louisiana are:
What city has the Highest Percentage of Immigrants from South Eastern Asia in Louisiana?
Buras has the Highest Percentage of Immigrants from South Eastern Asia in Louisiana with 32.90%.
What is the Percentage of Immigrants from South Eastern Asia in the State of Louisiana?
Percentage of Immigrants from South Eastern Asia in Louisiana is 0.61%.
What is the Percentage of Immigrants from South Eastern Asia in the United States?
Percentage of Immigrants from South Eastern Asia in the United States is 1.30%.