Cities with the Highest Percentage of Immigrants from South Eastern Asia in North Carolina
RELATED REPORTS & OPTIONS
South Eastern Asia
North Carolina
Compare Cities
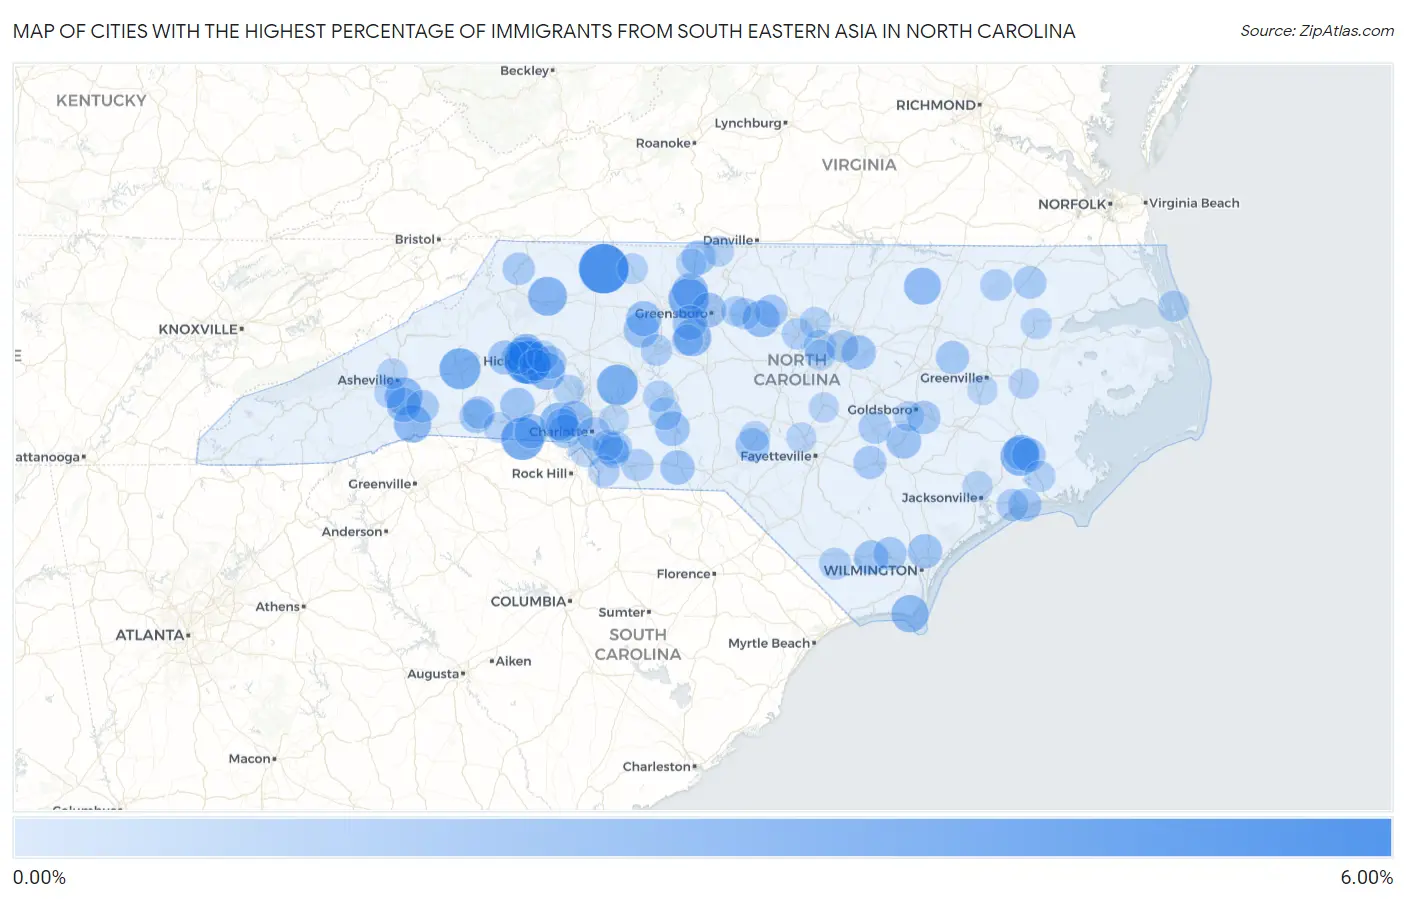
Map of Cities with the Highest Percentage of Immigrants from South Eastern Asia in North Carolina
0.00%
6.00%
Cities with the Highest Percentage of Immigrants from South Eastern Asia in North Carolina
| City | South Eastern Asia | vs State | vs National | |
| 1. | Dobson | 5.41% | 0.65%(+4.75)#-1 | 1.30%(+4.11)#0 |
| 2. | Long View | 3.88% | 0.65%(+3.22)#0 | 1.30%(+2.58)#1 |
| 3. | Grover | 3.68% | 0.65%(+3.02)#1 | 1.30%(+2.38)#2 |
| 4. | Hildebran | 3.64% | 0.65%(+2.98)#2 | 1.30%(+2.34)#3 |
| 5. | Marion | 3.32% | 0.65%(+2.66)#3 | 1.30%(+2.02)#4 |
| 6. | Landis | 3.30% | 0.65%(+2.65)#4 | 1.30%(+2.01)#5 |
| 7. | Oak Ridge | 3.18% | 0.65%(+2.53)#5 | 1.30%(+1.89)#6 |
| 8. | Brices Creek | 2.88% | 0.65%(+2.23)#6 | 1.30%(+1.59)#7 |
| 9. | Millers Creek | 2.85% | 0.65%(+2.19)#7 | 1.30%(+1.55)#8 |
| 10. | Rhodhiss | 2.79% | 0.65%(+2.14)#8 | 1.30%(+1.50)#9 |
| 11. | Royal Pines | 2.52% | 0.65%(+1.87)#9 | 1.30%(+1.22)#10 |
| 12. | East Flat Rock | 2.51% | 0.65%(+1.86)#10 | 1.30%(+1.21)#11 |
| 13. | Archdale | 2.50% | 0.65%(+1.85)#11 | 1.30%(+1.21)#12 |
| 14. | Newton | 2.48% | 0.65%(+1.83)#12 | 1.30%(+1.19)#13 |
| 15. | Jackson Springs | 2.46% | 0.65%(+1.80)#13 | 1.30%(+1.16)#14 |
| 16. | Caswell Beach | 2.45% | 0.65%(+1.80)#14 | 1.30%(+1.16)#15 |
| 17. | Ranlo | 2.41% | 0.65%(+1.75)#15 | 1.30%(+1.11)#16 |
| 18. | Hollister | 2.36% | 0.65%(+1.71)#16 | 1.30%(+1.06)#17 |
| 19. | Swepsonville | 2.31% | 0.65%(+1.66)#17 | 1.30%(+1.02)#18 |
| 20. | Stokesdale | 2.14% | 0.65%(+1.48)#18 | 1.30%(+0.839)#19 |
| 21. | Mount Holly | 2.07% | 0.65%(+1.42)#19 | 1.30%(+0.778)#20 |
| 22. | New Bern | 2.04% | 0.65%(+1.39)#20 | 1.30%(+0.747)#21 |
| 23. | Advance | 1.99% | 0.65%(+1.34)#21 | 1.30%(+0.697)#22 |
| 24. | Clemmons | 1.97% | 0.65%(+1.32)#22 | 1.30%(+0.677)#23 |
| 25. | Granite Falls | 1.88% | 0.65%(+1.23)#23 | 1.30%(+0.589)#24 |
| 26. | Calypso | 1.86% | 0.65%(+1.21)#24 | 1.30%(+0.568)#25 |
| 27. | Greensboro | 1.84% | 0.65%(+1.18)#25 | 1.30%(+0.543)#26 |
| 28. | Norwood | 1.82% | 0.65%(+1.17)#26 | 1.30%(+0.527)#27 |
| 29. | Fallston | 1.79% | 0.65%(+1.14)#27 | 1.30%(+0.495)#28 |
| 30. | Fletcher | 1.79% | 0.65%(+1.13)#28 | 1.30%(+0.491)#29 |
| 31. | Wadesboro | 1.78% | 0.65%(+1.12)#29 | 1.30%(+0.482)#30 |
| 32. | High Point | 1.78% | 0.65%(+1.12)#30 | 1.30%(+0.481)#31 |
| 33. | Knightdale | 1.77% | 0.65%(+1.11)#31 | 1.30%(+0.471)#32 |
| 34. | Castle Hayne | 1.75% | 0.65%(+1.10)#32 | 1.30%(+0.456)#33 |
| 35. | Kings Mountain | 1.73% | 0.65%(+1.08)#33 | 1.30%(+0.438)#34 |
| 36. | Bolton | 1.72% | 0.65%(+1.07)#34 | 1.30%(+0.425)#35 |
| 37. | Stoneville | 1.71% | 0.65%(+1.06)#35 | 1.30%(+0.415)#36 |
| 38. | Drexel | 1.70% | 0.65%(+1.04)#36 | 1.30%(+0.401)#37 |
| 39. | Aberdeen | 1.67% | 0.65%(+1.02)#37 | 1.30%(+0.375)#38 |
| 40. | Forest City | 1.62% | 0.65%(+0.963)#38 | 1.30%(+0.321)#39 |
| 41. | James City | 1.60% | 0.65%(+0.946)#39 | 1.30%(+0.304)#40 |
| 42. | Cramerton | 1.55% | 0.65%(+0.894)#40 | 1.30%(+0.253)#41 |
| 43. | Elroy | 1.55% | 0.65%(+0.891)#41 | 1.30%(+0.249)#42 |
| 44. | Riegelwood | 1.52% | 0.65%(+0.865)#42 | 1.30%(+0.223)#43 |
| 45. | Macclesfield | 1.49% | 0.65%(+0.838)#43 | 1.30%(+0.196)#44 |
| 46. | Lowell | 1.49% | 0.65%(+0.835)#44 | 1.30%(+0.193)#45 |
| 47. | Charlotte | 1.49% | 0.65%(+0.832)#45 | 1.30%(+0.190)#419 |
| 48. | Bogue | 1.47% | 0.65%(+0.818)#46 | 1.30%(+0.176)#420 |
| 49. | Bonnetsville | 1.46% | 0.65%(+0.810)#47 | 1.30%(+0.169)#421 |
| 50. | Mebane | 1.42% | 0.65%(+0.765)#48 | 1.30%(+0.123)#422 |
| 51. | Ahoskie | 1.38% | 0.65%(+0.729)#49 | 1.30%(+0.088)#423 |
| 52. | Edneyville | 1.38% | 0.65%(+0.724)#50 | 1.30%(+0.082)#424 |
| 53. | Newton Grove | 1.37% | 0.65%(+0.711)#51 | 1.30%(+0.069)#425 |
| 54. | Connelly Springs | 1.36% | 0.65%(+0.704)#52 | 1.30%(+0.062)#426 |
| 55. | Stallings | 1.36% | 0.65%(+0.704)#53 | 1.30%(+0.062)#427 |
| 56. | Albemarle | 1.36% | 0.65%(+0.702)#54 | 1.30%(+0.060)#428 |
| 57. | Conover | 1.35% | 0.65%(+0.693)#55 | 1.30%(+0.052)#429 |
| 58. | West Jefferson | 1.33% | 0.65%(+0.672)#56 | 1.30%(+0.030)#430 |
| 59. | Bostic | 1.32% | 0.65%(+0.661)#57 | 1.30%(+0.019)#431 |
| 60. | Morrisville | 1.29% | 0.65%(+0.636)#58 | 1.30%(-0.006)#432 |
| 61. | Swansboro | 1.28% | 0.65%(+0.622)#59 | 1.30%(-0.019)#433 |
| 62. | Raleigh | 1.26% | 0.65%(+0.605)#60 | 1.30%(-0.037)#434 |
| 63. | Wingate | 1.23% | 0.65%(+0.577)#61 | 1.30%(-0.065)#435 |
| 64. | Brunswick | 1.22% | 0.65%(+0.562)#62 | 1.30%(-0.080)#436 |
| 65. | Pineville | 1.22% | 0.65%(+0.561)#63 | 1.30%(-0.081)#437 |
| 66. | Rich Square | 1.21% | 0.65%(+0.552)#64 | 1.30%(-0.090)#438 |
| 67. | Hemby Bridge | 1.20% | 0.65%(+0.541)#65 | 1.30%(-0.101)#439 |
| 68. | Lexington | 1.17% | 0.65%(+0.514)#66 | 1.30%(-0.128)#440 |
| 69. | Brookford | 1.15% | 0.65%(+0.495)#67 | 1.30%(-0.147)#441 |
| 70. | St Stephens | 1.11% | 0.65%(+0.457)#68 | 1.30%(-0.185)#442 |
| 71. | Chapel Hill | 1.11% | 0.65%(+0.454)#69 | 1.30%(-0.188)#443 |
| 72. | Bent Creek | 1.11% | 0.65%(+0.452)#70 | 1.30%(-0.190)#444 |
| 73. | Richfield | 1.09% | 0.65%(+0.431)#71 | 1.30%(-0.211)#445 |
| 74. | Burlington | 1.08% | 0.65%(+0.424)#72 | 1.30%(-0.218)#446 |
| 75. | Indian Trail | 1.07% | 0.65%(+0.414)#73 | 1.30%(-0.227)#447 |
| 76. | Waxhaw | 1.05% | 0.65%(+0.396)#74 | 1.30%(-0.246)#448 |
| 77. | Trinity | 1.04% | 0.65%(+0.387)#75 | 1.30%(-0.255)#449 |
| 78. | Southern Shores | 1.03% | 0.65%(+0.378)#76 | 1.30%(-0.263)#450 |
| 79. | Windsor | 1.00% | 0.65%(+0.347)#77 | 1.30%(-0.295)#451 |
| 80. | Havelock | 0.99% | 0.65%(+0.336)#78 | 1.30%(-0.306)#452 |
| 81. | Durham | 0.97% | 0.65%(+0.319)#79 | 1.30%(-0.323)#453 |
| 82. | Matthews | 0.97% | 0.65%(+0.318)#80 | 1.30%(-0.324)#454 |
| 83. | Pilot Mountain | 0.96% | 0.65%(+0.305)#81 | 1.30%(-0.337)#455 |
| 84. | Eden | 0.94% | 0.65%(+0.284)#82 | 1.30%(-0.358)#456 |
| 85. | Denver | 0.91% | 0.65%(+0.258)#83 | 1.30%(-0.384)#457 |
| 86. | Cary | 0.91% | 0.65%(+0.256)#84 | 1.30%(-0.386)#458 |
| 87. | Brandywine Bay | 0.90% | 0.65%(+0.242)#85 | 1.30%(-0.400)#459 |
| 88. | Woodfin | 0.89% | 0.65%(+0.231)#86 | 1.30%(-0.410)#460 |
| 89. | Mar Mac | 0.89% | 0.65%(+0.231)#87 | 1.30%(-0.411)#461 |
| 90. | Half Moon | 0.88% | 0.65%(+0.228)#88 | 1.30%(-0.413)#462 |
| 91. | Washington | 0.87% | 0.65%(+0.216)#89 | 1.30%(-0.425)#463 |
| 92. | Whitsett | 0.86% | 0.65%(+0.209)#90 | 1.30%(-0.433)#464 |
| 93. | Boiling Springs | 0.84% | 0.65%(+0.189)#91 | 1.30%(-0.453)#465 |
| 94. | Harrisburg | 0.84% | 0.65%(+0.185)#92 | 1.30%(-0.457)#466 |
| 95. | Spout Springs | 0.84% | 0.65%(+0.183)#93 | 1.30%(-0.458)#467 |
| 96. | Lillington | 0.83% | 0.65%(+0.178)#94 | 1.30%(-0.464)#468 |
| 97. | Mayodan | 0.82% | 0.65%(+0.166)#95 | 1.30%(-0.476)#469 |
| 98. | Winterville | 0.81% | 0.65%(+0.154)#96 | 1.30%(-0.488)#470 |
| 99. | Spring Lake | 0.80% | 0.65%(+0.148)#97 | 1.30%(-0.494)#471 |
| 100. | Southern Pines | 0.80% | 0.65%(+0.148)#98 | 1.30%(-0.494)#472 |
Common Questions
What are the Top 10 Cities with the Highest Percentage of Immigrants from South Eastern Asia in North Carolina?
Top 10 Cities with the Highest Percentage of Immigrants from South Eastern Asia in North Carolina are:
#1
5.41%
#2
3.88%
#3
3.68%
#4
3.64%
#5
3.32%
#6
3.30%
#7
3.18%
#8
2.88%
#9
2.85%
#10
2.79%
What city has the Highest Percentage of Immigrants from South Eastern Asia in North Carolina?
Dobson has the Highest Percentage of Immigrants from South Eastern Asia in North Carolina with 5.41%.
What is the Percentage of Immigrants from South Eastern Asia in the State of North Carolina?
Percentage of Immigrants from South Eastern Asia in North Carolina is 0.65%.
What is the Percentage of Immigrants from South Eastern Asia in the United States?
Percentage of Immigrants from South Eastern Asia in the United States is 1.30%.