Cities with the Highest Percentage of Immigrants from China in Illinois
RELATED REPORTS & OPTIONS
China
Illinois
Compare Cities
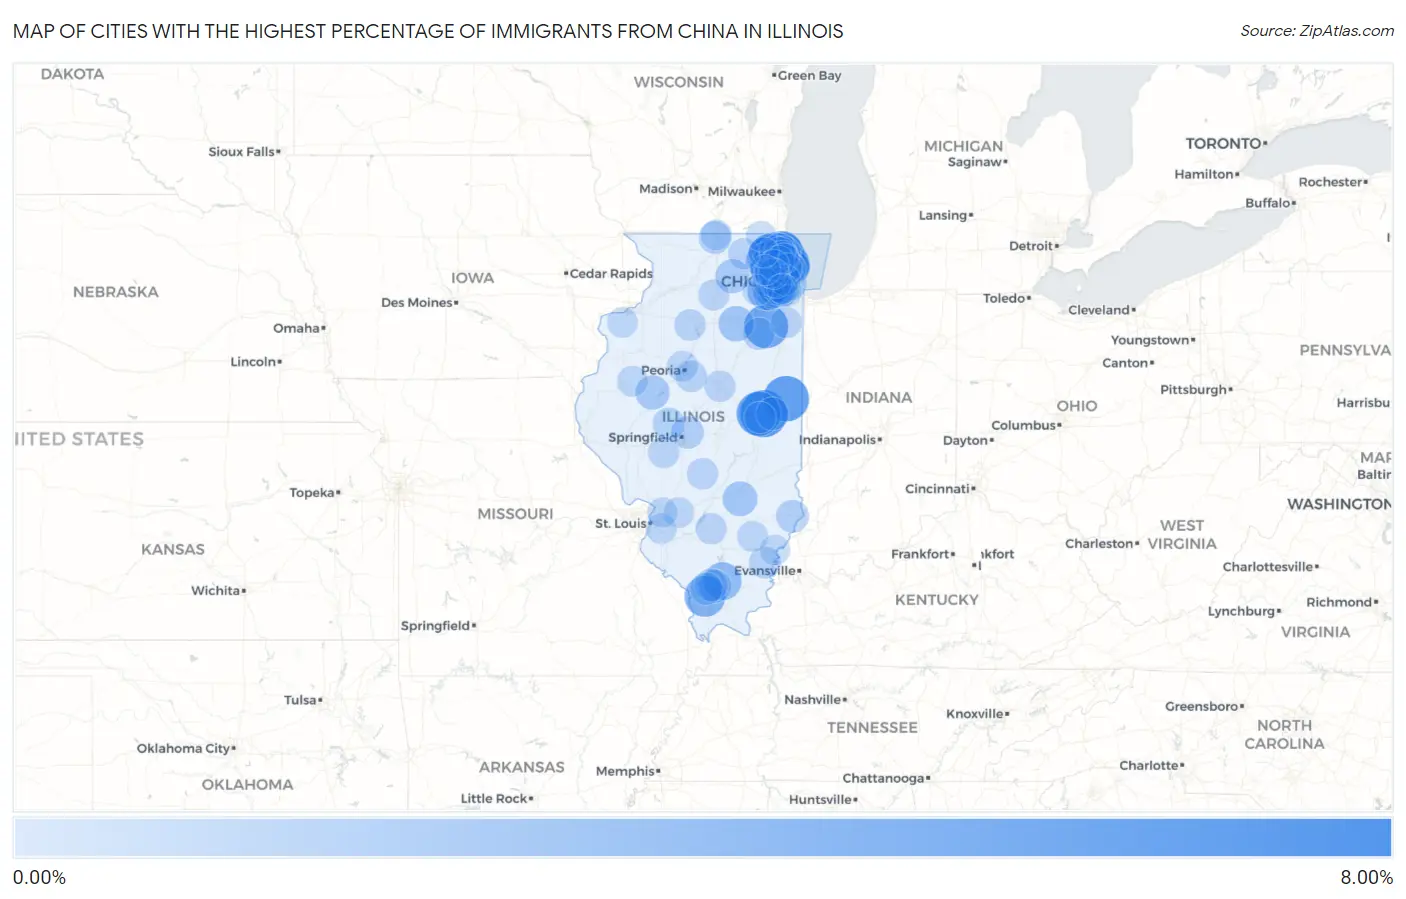
Map of Cities with the Highest Percentage of Immigrants from China in Illinois
0.00%
8.00%
Cities with the Highest Percentage of Immigrants from China in Illinois
| City | China | vs State | vs National | |
| 1. | Lincolnshire | 6.44% | 0.69%(+5.75)#1 | 0.85%(+5.58)#175 |
| 2. | Kildeer | 6.27% | 0.69%(+5.58)#2 | 0.85%(+5.41)#182 |
| 3. | Urbana | 5.63% | 0.69%(+4.95)#3 | 0.85%(+4.78)#218 |
| 4. | Potomac | 5.24% | 0.69%(+4.55)#4 | 0.85%(+4.38)#240 |
| 5. | Champaign | 4.80% | 0.69%(+4.12)#5 | 0.85%(+3.95)#274 |
| 6. | Lakewood Shores | 4.73% | 0.69%(+4.04)#6 | 0.85%(+3.87)#278 |
| 7. | Northfield | 4.66% | 0.69%(+3.97)#7 | 0.85%(+3.81)#287 |
| 8. | Vernon Hills | 3.94% | 0.69%(+3.25)#8 | 0.85%(+3.09)#370 |
| 9. | Makanda | 3.80% | 0.69%(+3.11)#9 | 0.85%(+2.95)#396 |
| 10. | Hinsdale | 3.64% | 0.69%(+2.95)#10 | 0.85%(+2.79)#413 |
| 11. | Oak Brook | 3.37% | 0.69%(+2.69)#11 | 0.85%(+2.52)#460 |
| 12. | Wilmette | 3.33% | 0.69%(+2.65)#12 | 0.85%(+2.48)#466 |
| 13. | North Barrington | 3.11% | 0.69%(+2.42)#13 | 0.85%(+2.26)#507 |
| 14. | Johnston City | 2.87% | 0.69%(+2.19)#14 | 0.85%(+2.02)#569 |
| 15. | Naperville | 2.80% | 0.69%(+2.12)#15 | 0.85%(+1.95)#598 |
| 16. | Long Grove | 2.73% | 0.69%(+2.04)#16 | 0.85%(+1.88)#612 |
| 17. | Hawthorn Woods | 2.61% | 0.69%(+1.93)#17 | 0.85%(+1.76)#639 |
| 18. | Northbrook | 2.49% | 0.69%(+1.80)#18 | 0.85%(+1.63)#674 |
| 19. | Lisle | 2.48% | 0.69%(+1.79)#19 | 0.85%(+1.63)#677 |
| 20. | Westmont | 2.38% | 0.69%(+1.69)#20 | 0.85%(+1.53)#702 |
| 21. | Buffalo Grove | 2.27% | 0.69%(+1.58)#21 | 0.85%(+1.41)#749 |
| 22. | Barrington Hills | 2.24% | 0.69%(+1.55)#22 | 0.85%(+1.38)#758 |
| 23. | Marseilles | 2.12% | 0.69%(+1.43)#23 | 0.85%(+1.26)#801 |
| 24. | Barrington | 2.11% | 0.69%(+1.42)#24 | 0.85%(+1.25)#810 |
| 25. | Lake Bluff | 2.08% | 0.69%(+1.39)#25 | 0.85%(+1.22)#824 |
| 26. | Evanston | 1.96% | 0.69%(+1.27)#26 | 0.85%(+1.11)#892 |
| 27. | South Barrington | 1.94% | 0.69%(+1.25)#27 | 0.85%(+1.09)#905 |
| 28. | Mason | 1.89% | 0.69%(+1.20)#28 | 0.85%(+1.03)#936 |
| 29. | Libertyville | 1.80% | 0.69%(+1.11)#29 | 0.85%(+0.941)#984 |
| 30. | Lewistown | 1.75% | 0.69%(+1.07)#30 | 0.85%(+0.900)#1,011 |
| 31. | Dekalb | 1.70% | 0.69%(+1.02)#31 | 0.85%(+0.848)#1,047 |
| 32. | Glenview | 1.70% | 0.69%(+1.01)#32 | 0.85%(+0.845)#1,051 |
| 33. | Chicago | 1.43% | 0.69%(+0.748)#33 | 0.85%(+0.581)#1,257 |
| 34. | Riverwoods | 1.42% | 0.69%(+0.736)#34 | 0.85%(+0.568)#1,265 |
| 35. | Lake Forest | 1.40% | 0.69%(+0.718)#35 | 0.85%(+0.550)#1,280 |
| 36. | Darien | 1.34% | 0.69%(+0.657)#36 | 0.85%(+0.489)#1,337 |
| 37. | Lawrenceville | 1.33% | 0.69%(+0.643)#37 | 0.85%(+0.476)#1,355 |
| 38. | St Joseph | 1.32% | 0.69%(+0.636)#38 | 0.85%(+0.468)#1,360 |
| 39. | Crainville | 1.32% | 0.69%(+0.634)#39 | 0.85%(+0.466)#1,364 |
| 40. | Downers Grove | 1.32% | 0.69%(+0.631)#40 | 0.85%(+0.464)#1,369 |
| 41. | Cambria | 1.30% | 0.69%(+0.613)#41 | 0.85%(+0.445)#1,397 |
| 42. | Inverness | 1.30% | 0.69%(+0.608)#42 | 0.85%(+0.441)#1,406 |
| 43. | Rockton | 1.25% | 0.69%(+0.563)#43 | 0.85%(+0.395)#1,458 |
| 44. | Spaulding | 1.24% | 0.69%(+0.557)#44 | 0.85%(+0.389)#1,461 |
| 45. | Lake Zurich | 1.23% | 0.69%(+0.539)#45 | 0.85%(+0.371)#1,488 |
| 46. | Carbondale | 1.23% | 0.69%(+0.538)#46 | 0.85%(+0.371)#1,489 |
| 47. | Hoffman Estates | 1.21% | 0.69%(+0.525)#47 | 0.85%(+0.357)#1,499 |
| 48. | Lake Petersburg | 1.18% | 0.69%(+0.493)#48 | 0.85%(+0.325)#1,541 |
| 49. | Schaumburg | 1.13% | 0.69%(+0.441)#49 | 0.85%(+0.274)#1,598 |
| 50. | South Wilmington | 1.12% | 0.69%(+0.435)#50 | 0.85%(+0.267)#1,609 |
| 51. | Golf | 1.10% | 0.69%(+0.412)#51 | 0.85%(+0.244)#1,629 |
| 52. | Palatine | 1.08% | 0.69%(+0.398)#52 | 0.85%(+0.230)#1,657 |
| 53. | Willow Lake | 1.08% | 0.69%(+0.392)#53 | 0.85%(+0.225)#1,668 |
| 54. | Skokie | 1.06% | 0.69%(+0.378)#54 | 0.85%(+0.210)#1,688 |
| 55. | Woodridge | 1.06% | 0.69%(+0.374)#55 | 0.85%(+0.206)#1,698 |
| 56. | Carmi | 1.05% | 0.69%(+0.364)#56 | 0.85%(+0.197)#1,712 |
| 57. | Clarendon Hills | 0.99% | 0.69%(+0.307)#57 | 0.85%(+0.139)#1,807 |
| 58. | Wauconda | 0.98% | 0.69%(+0.296)#58 | 0.85%(+0.128)#1,823 |
| 59. | Morton | 0.98% | 0.69%(+0.295)#59 | 0.85%(+0.127)#1,826 |
| 60. | Tiskilwa | 0.94% | 0.69%(+0.252)#60 | 0.85%(+0.084)#1,899 |
| 61. | Savoy | 0.92% | 0.69%(+0.235)#61 | 0.85%(+0.067)#1,931 |
| 62. | Nokomis | 0.91% | 0.69%(+0.221)#62 | 0.85%(+0.053)#1,955 |
| 63. | Green Oaks | 0.90% | 0.69%(+0.217)#63 | 0.85%(+0.049)#1,960 |
| 64. | Peotone | 0.89% | 0.69%(+0.200)#64 | 0.85%(+0.033)#1,984 |
| 65. | Union | 0.88% | 0.69%(+0.194)#65 | 0.85%(+0.026)#1,998 |
| 66. | Mundelein | 0.88% | 0.69%(+0.193)#66 | 0.85%(+0.026)#1,999 |
| 67. | Bloomington | 0.87% | 0.69%(+0.186)#67 | 0.85%(+0.019)#2,013 |
| 68. | Waverly | 0.87% | 0.69%(+0.182)#68 | 0.85%(+0.014)#2,021 |
| 69. | Central City | 0.87% | 0.69%(+0.180)#69 | 0.85%(+0.012)#2,028 |
| 70. | Bannockburn | 0.85% | 0.69%(+0.158)#70 | 0.85%(-0.009)#2,072 |
| 71. | Mettawa | 0.83% | 0.69%(+0.145)#71 | 0.85%(-0.022)#2,095 |
| 72. | Compton | 0.81% | 0.69%(+0.123)#72 | 0.85%(-0.045)#2,132 |
| 73. | Lombard | 0.79% | 0.69%(+0.105)#73 | 0.85%(-0.062)#2,186 |
| 74. | Peoria | 0.78% | 0.69%(+0.095)#74 | 0.85%(-0.073)#2,202 |
| 75. | Jeffersonville | 0.78% | 0.69%(+0.094)#75 | 0.85%(-0.073)#2,205 |
| 76. | Wheeling | 0.78% | 0.69%(+0.094)#76 | 0.85%(-0.074)#2,207 |
| 77. | Bushnell | 0.77% | 0.69%(+0.085)#77 | 0.85%(-0.083)#2,226 |
| 78. | Wheaton | 0.77% | 0.69%(+0.085)#78 | 0.85%(-0.083)#2,227 |
| 79. | Bloomingdale | 0.76% | 0.69%(+0.071)#79 | 0.85%(-0.097)#2,266 |
| 80. | Bridgeview | 0.76% | 0.69%(+0.069)#80 | 0.85%(-0.099)#2,275 |
| 81. | Bolingbrook | 0.75% | 0.69%(+0.060)#81 | 0.85%(-0.107)#2,288 |
| 82. | Morton Grove | 0.74% | 0.69%(+0.056)#82 | 0.85%(-0.112)#2,301 |
| 83. | River Forest | 0.72% | 0.69%(+0.031)#83 | 0.85%(-0.137)#2,367 |
| 84. | Highland | 0.71% | 0.69%(+0.028)#84 | 0.85%(-0.140)#2,375 |
| 85. | Burr Ridge | 0.71% | 0.69%(+0.023)#85 | 0.85%(-0.145)#2,385 |
| 86. | Oakbrook Terrace | 0.71% | 0.69%(+0.018)#86 | 0.85%(-0.149)#2,394 |
| 87. | Swansea | 0.70% | 0.69%(+0.012)#87 | 0.85%(-0.156)#2,414 |
| 88. | Aurora | 0.69% | 0.69%(+0.006)#88 | 0.85%(-0.162)#2,427 |
| 89. | Deerfield | 0.68% | 0.69%(-0.004)#89 | 0.85%(-0.171)#2,450 |
| 90. | Reynolds | 0.67% | 0.69%(-0.016)#90 | 0.85%(-0.183)#2,476 |
| 91. | Roselle | 0.67% | 0.69%(-0.017)#91 | 0.85%(-0.185)#2,481 |
| 92. | Rolling Meadows | 0.67% | 0.69%(-0.017)#92 | 0.85%(-0.185)#2,483 |
| 93. | Itasca | 0.66% | 0.69%(-0.022)#93 | 0.85%(-0.190)#2,492 |
| 94. | South Beloit | 0.65% | 0.69%(-0.032)#94 | 0.85%(-0.200)#2,523 |
| 95. | Spring Grove | 0.65% | 0.69%(-0.037)#95 | 0.85%(-0.205)#2,538 |
| 96. | Grayville | 0.65% | 0.69%(-0.038)#96 | 0.85%(-0.206)#2,543 |
| 97. | Streamwood | 0.60% | 0.69%(-0.083)#97 | 0.85%(-0.250)#2,678 |
| 98. | Glen Carbon | 0.59% | 0.69%(-0.094)#98 | 0.85%(-0.261)#2,712 |
| 99. | Port Barrington | 0.58% | 0.69%(-0.109)#99 | 0.85%(-0.276)#2,767 |
| 100. | Countryside | 0.57% | 0.69%(-0.117)#100 | 0.85%(-0.285)#2,802 |
Common Questions
What are the Top 10 Cities with the Highest Percentage of Immigrants from China in Illinois?
Top 10 Cities with the Highest Percentage of Immigrants from China in Illinois are:
#1
6.44%
#2
6.27%
#3
5.63%
#4
5.24%
#5
4.80%
#6
4.73%
#7
4.66%
#8
3.94%
#9
3.80%
#10
3.64%
What city has the Highest Percentage of Immigrants from China in Illinois?
Lincolnshire has the Highest Percentage of Immigrants from China in Illinois with 6.44%.
What is the Percentage of Immigrants from China in the State of Illinois?
Percentage of Immigrants from China in Illinois is 0.69%.
What is the Percentage of Immigrants from China in the United States?
Percentage of Immigrants from China in the United States is 0.85%.