Cities with the Most Immigrants from Trinidad and Tobago in Illinois
RELATED REPORTS & OPTIONS
Trinidad and Tobago
Illinois
Compare Cities
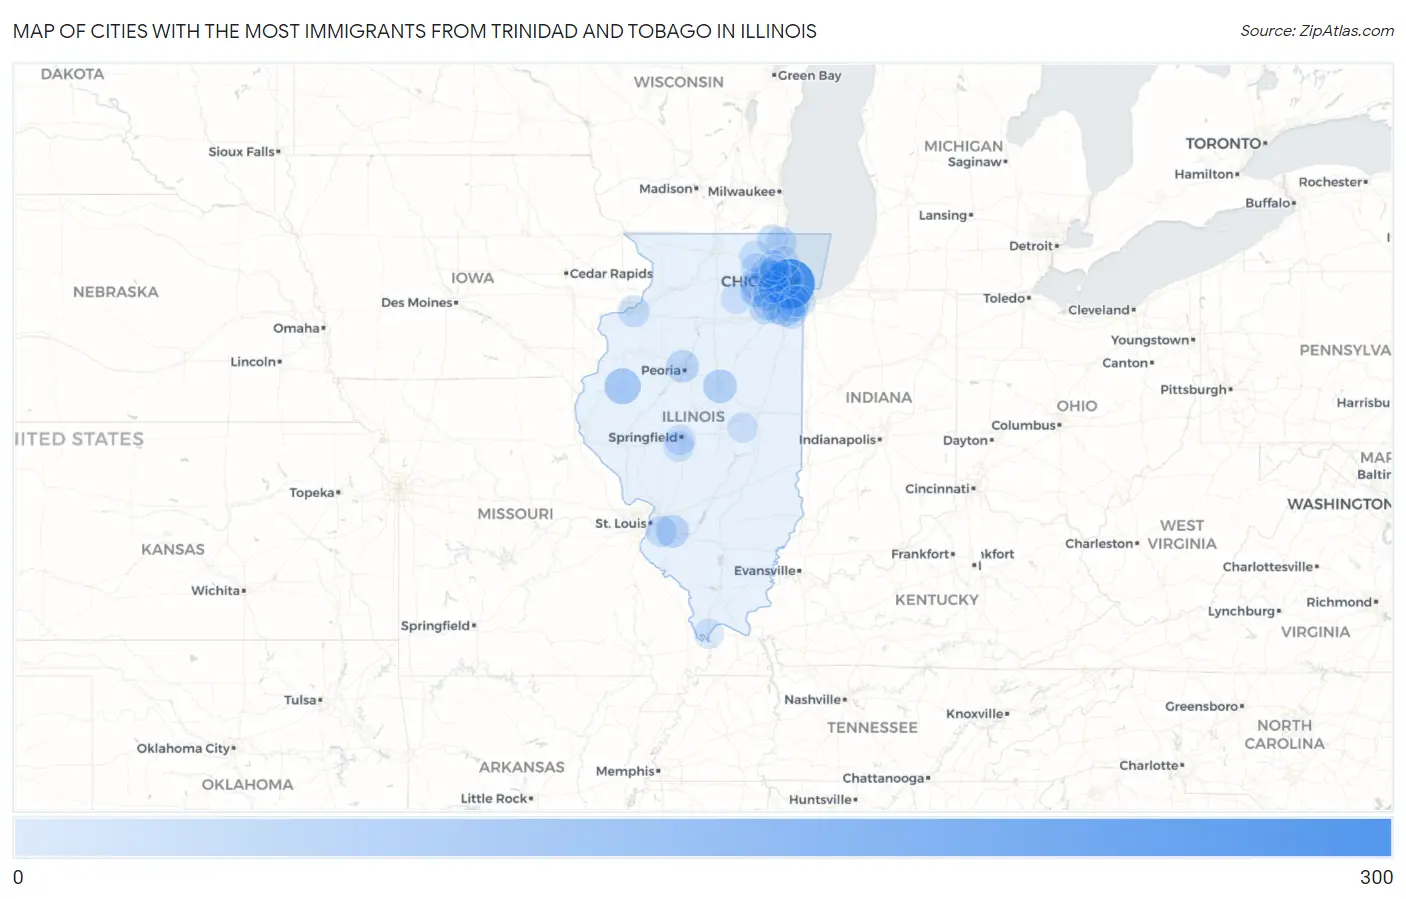
Map of Cities with the Most Immigrants from Trinidad and Tobago in Illinois
0
300
Cities with the Most Immigrants from Trinidad and Tobago in Illinois
| City | Trinidad and Tobago | vs State | vs National | |
| 1. | Chicago | 299 | 1,224(24.43%)#1 | 231,222(0.13%)#69 |
| 2. | Macomb | 85 | 1,224(6.94%)#2 | 231,222(0.04%)#331 |
| 3. | Maywood | 73 | 1,224(5.96%)#3 | 231,222(0.03%)#391 |
| 4. | Aurora | 66 | 1,224(5.39%)#4 | 231,222(0.03%)#435 |
| 5. | Glendale Heights | 56 | 1,224(4.58%)#5 | 231,222(0.02%)#494 |
| 6. | Bloomington | 53 | 1,224(4.33%)#6 | 231,222(0.02%)#509 |
| 7. | Frankfort | 49 | 1,224(4.00%)#7 | 231,222(0.02%)#537 |
| 8. | Batavia | 44 | 1,224(3.59%)#8 | 231,222(0.02%)#575 |
| 9. | Mascoutah | 41 | 1,224(3.35%)#9 | 231,222(0.02%)#607 |
| 10. | Crest Hill | 37 | 1,224(3.02%)#10 | 231,222(0.02%)#658 |
| 11. | Peoria | 36 | 1,224(2.94%)#11 | 231,222(0.02%)#663 |
| 12. | Flossmoor | 28 | 1,224(2.29%)#12 | 231,222(0.01%)#802 |
| 13. | Bolingbrook | 23 | 1,224(1.88%)#13 | 231,222(0.01%)#898 |
| 14. | Moline | 22 | 1,224(1.80%)#14 | 231,222(0.01%)#928 |
| 15. | Oak Park | 18 | 1,224(1.47%)#15 | 231,222(0.01%)#1,026 |
| 16. | Calumet City | 18 | 1,224(1.47%)#16 | 231,222(0.01%)#1,027 |
| 17. | Harvey | 17 | 1,224(1.39%)#17 | 231,222(0.01%)#1,075 |
| 18. | Belleville | 16 | 1,224(1.31%)#18 | 231,222(0.01%)#1,106 |
| 19. | Addison | 16 | 1,224(1.31%)#19 | 231,222(0.01%)#1,108 |
| 20. | Joliet | 15 | 1,224(1.23%)#20 | 231,222(0.01%)#1,127 |
| 21. | Waukegan | 15 | 1,224(1.23%)#21 | 231,222(0.01%)#1,130 |
| 22. | New Lenox | 15 | 1,224(1.23%)#22 | 231,222(0.01%)#1,142 |
| 23. | Downers Grove | 14 | 1,224(1.14%)#23 | 231,222(0.01%)#1,169 |
| 24. | Lake In The Hills | 13 | 1,224(1.06%)#24 | 231,222(0.01%)#1,211 |
| 25. | Chatham | 12 | 1,224(0.98%)#25 | 231,222(0.01%)#1,255 |
| 26. | Elgin | 11 | 1,224(0.90%)#26 | 231,222(0.00%)#1,286 |
| 27. | Hanover Park | 11 | 1,224(0.90%)#27 | 231,222(0.00%)#1,291 |
| 28. | Venetian Village | 9 | 1,224(0.74%)#28 | 231,222(0.00%)#1,416 |
| 29. | Northbrook | 7 | 1,224(0.57%)#29 | 231,222(0.00%)#1,469 |
| 30. | Rolling Meadows | 7 | 1,224(0.57%)#30 | 231,222(0.00%)#1,477 |
| 31. | Somonauk | 7 | 1,224(0.57%)#31 | 231,222(0.00%)#1,513 |
| 32. | Springfield | 6 | 1,224(0.49%)#32 | 231,222(0.00%)#1,519 |
| 33. | University Park | 5 | 1,224(0.41%)#33 | 231,222(0.00%)#1,590 |
| 34. | Bement | 3 | 1,224(0.25%)#34 | 231,222(0.00%)#1,671 |
| 35. | Mound City | 2 | 1,224(0.16%)#35 | 231,222(0.00%)#1,692 |
| 36. | Elk Grove Village | 1 | 1,224(0.08%)#36 | 231,222(0.00%)#1,701 |
Common Questions
What are the Top 10 Cities with the Most Immigrants from Trinidad and Tobago in Illinois?
Top 10 Cities with the Most Immigrants from Trinidad and Tobago in Illinois are:
#1
299
#2
85
#3
73
#4
66
#5
56
#6
53
#7
49
#8
44
#9
41
#10
37
What city has the Most Immigrants from Trinidad and Tobago in Illinois?
Chicago has the Most Immigrants from Trinidad and Tobago in Illinois with 299.
What is the Total Immigrants from Trinidad and Tobago in the State of Illinois?
Total Immigrants from Trinidad and Tobago in Illinois is 1,224.
What is the Total Immigrants from Trinidad and Tobago in the United States?
Total Immigrants from Trinidad and Tobago in the United States is 231,222.