Cities with the Highest Female Poverty Level in Illinois
RELATED REPORTS & OPTIONS
Highest Poverty | Female
Illinois
Compare Cities
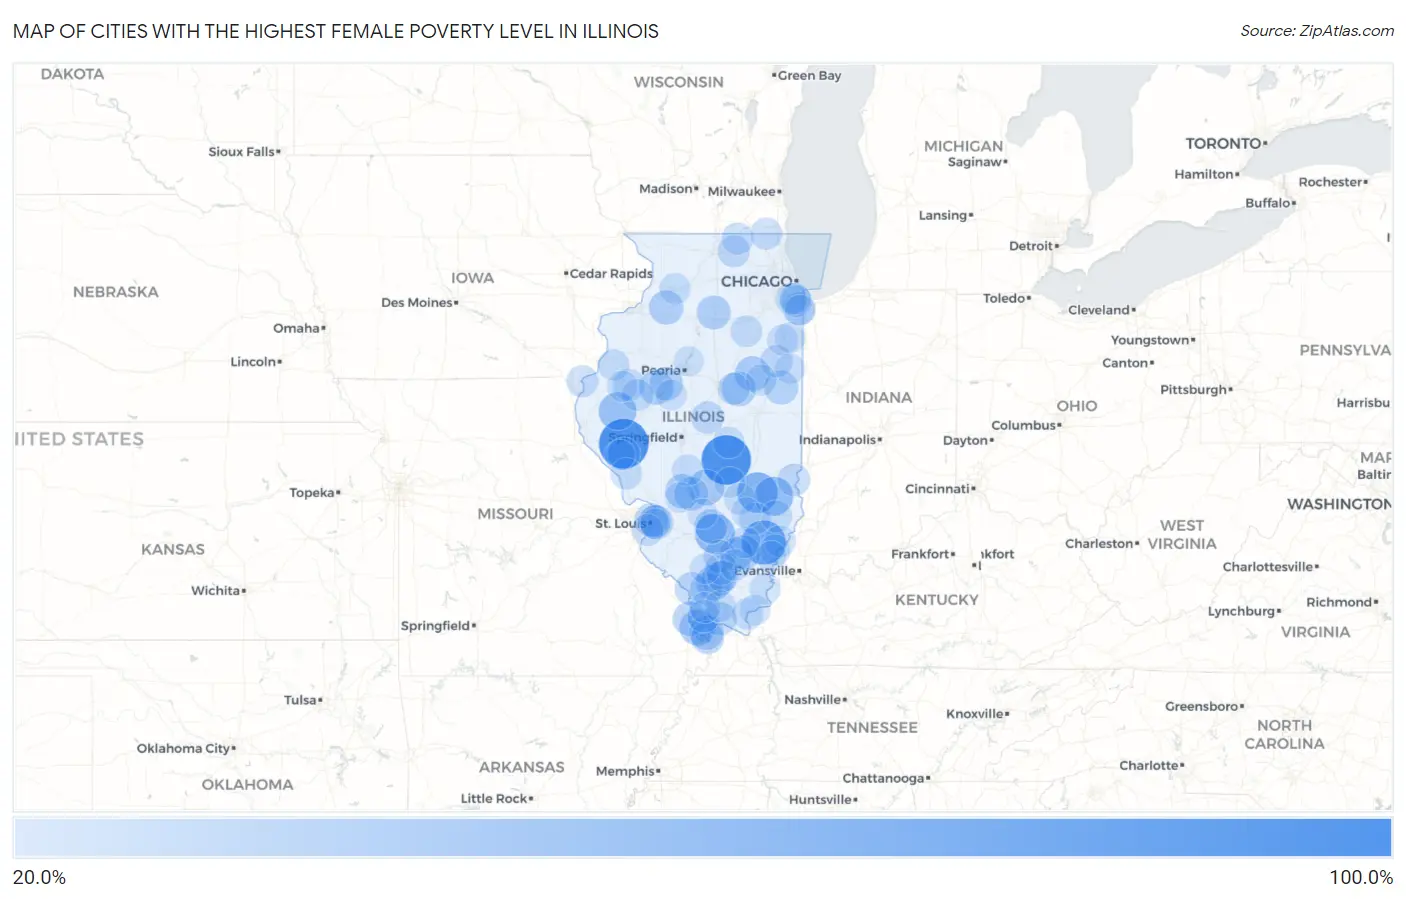
Map of Cities with the Highest Female Poverty Level in Illinois
0.0%
100.0%
Cities with the Highest Female Poverty Level in Illinois
| City | Female Poverty | vs State | vs National | |
| 1. | Alden | 100.0% | 12.9%(+87.1)#1 | 13.7%(+86.3)#24 |
| 2. | Valley City | 100.0% | 12.9%(+87.1)#2 | 13.7%(+86.3)#88 |
| 3. | Westervelt | 100.0% | 12.9%(+87.1)#3 | 13.7%(+86.3)#101 |
| 4. | Golden Gate | 80.0% | 12.9%(+67.1)#4 | 13.7%(+66.3)#261 |
| 5. | Harding | 77.5% | 12.9%(+64.6)#5 | 13.7%(+63.8)#290 |
| 6. | Illinois | 67.9% | 12.9%(+54.9)#6 | 13.7%(+54.2)#451 |
| 7. | Wheeler | 66.7% | 12.9%(+53.8)#7 | 13.7%(+53.0)#467 |
| 8. | Millersburg | 65.2% | 12.9%(+52.3)#8 | 13.7%(+51.5)#503 |
| 9. | Walnut Hill | 63.8% | 12.9%(+50.9)#9 | 13.7%(+50.1)#554 |
| 10. | Willow Hill | 60.4% | 12.9%(+47.5)#10 | 13.7%(+46.7)#650 |
| 11. | Camden | 56.1% | 12.9%(+43.2)#11 | 13.7%(+42.4)#813 |
| 12. | Ophiem | 52.8% | 12.9%(+39.9)#12 | 13.7%(+39.1)#987 |
| 13. | Niota | 50.0% | 12.9%(+37.1)#13 | 13.7%(+36.3)#1,187 |
| 14. | Bingham | 49.2% | 12.9%(+36.3)#14 | 13.7%(+35.5)#1,236 |
| 15. | Olive Branch | 49.1% | 12.9%(+36.2)#15 | 13.7%(+35.4)#1,249 |
| 16. | Strawn | 47.2% | 12.9%(+34.3)#16 | 13.7%(+33.5)#1,371 |
| 17. | Colp | 47.2% | 12.9%(+34.3)#17 | 13.7%(+33.5)#1,375 |
| 18. | Cahokia Heights | 45.9% | 12.9%(+33.0)#18 | 13.7%(+32.2)#1,455 |
| 19. | Arrowsmith | 45.2% | 12.9%(+32.3)#19 | 13.7%(+31.5)#1,518 |
| 20. | Walshville | 45.0% | 12.9%(+32.1)#20 | 13.7%(+31.3)#1,537 |
| 21. | Belle Prairie City | 44.8% | 12.9%(+31.9)#21 | 13.7%(+31.1)#1,556 |
| 22. | Freeman Spur | 44.6% | 12.9%(+31.7)#22 | 13.7%(+30.9)#1,583 |
| 23. | Bryant | 44.6% | 12.9%(+31.6)#23 | 13.7%(+30.9)#1,584 |
| 24. | East Cape Girardeau | 44.5% | 12.9%(+31.6)#24 | 13.7%(+30.8)#1,588 |
| 25. | Mounds | 44.3% | 12.9%(+31.4)#25 | 13.7%(+30.6)#1,605 |
| 26. | Hooppole | 43.7% | 12.9%(+30.8)#26 | 13.7%(+30.0)#1,667 |
| 27. | Troy Grove | 43.0% | 12.9%(+30.1)#27 | 13.7%(+29.3)#1,737 |
| 28. | Washington Park | 43.0% | 12.9%(+30.0)#28 | 13.7%(+29.3)#1,738 |
| 29. | Rankin | 42.7% | 12.9%(+29.8)#29 | 13.7%(+29.0)#1,776 |
| 30. | Junction City | 42.3% | 12.9%(+29.4)#30 | 13.7%(+28.6)#1,829 |
| 31. | Holcomb | 42.2% | 12.9%(+29.3)#31 | 13.7%(+28.5)#1,838 |
| 32. | Donnellson | 42.1% | 12.9%(+29.2)#32 | 13.7%(+28.4)#1,850 |
| 33. | Venice | 41.4% | 12.9%(+28.5)#33 | 13.7%(+27.7)#1,935 |
| 34. | Banner | 41.1% | 12.9%(+28.2)#34 | 13.7%(+27.4)#1,966 |
| 35. | Karnak | 40.4% | 12.9%(+27.5)#35 | 13.7%(+26.7)#2,050 |
| 36. | Cairo | 39.9% | 12.9%(+27.0)#36 | 13.7%(+26.2)#2,133 |
| 37. | Gorham | 39.9% | 12.9%(+27.0)#37 | 13.7%(+26.2)#2,134 |
| 38. | Dahlgren | 39.4% | 12.9%(+26.5)#38 | 13.7%(+25.7)#2,170 |
| 39. | Ford Heights | 38.5% | 12.9%(+25.6)#39 | 13.7%(+24.8)#2,296 |
| 40. | Nason | 38.3% | 12.9%(+25.4)#40 | 13.7%(+24.6)#2,323 |
| 41. | Carbondale | 38.2% | 12.9%(+25.3)#41 | 13.7%(+24.5)#2,332 |
| 42. | Mill Creek | 38.1% | 12.9%(+25.2)#42 | 13.7%(+24.4)#2,360 |
| 43. | Chestnut | 37.9% | 12.9%(+25.0)#43 | 13.7%(+24.2)#2,390 |
| 44. | Milton | 37.4% | 12.9%(+24.5)#44 | 13.7%(+23.7)#2,460 |
| 45. | West Union | 37.3% | 12.9%(+24.3)#45 | 13.7%(+23.6)#2,481 |
| 46. | Danforth | 37.0% | 12.9%(+24.1)#46 | 13.7%(+23.3)#2,514 |
| 47. | Fairmont City | 36.8% | 12.9%(+23.9)#47 | 13.7%(+23.1)#2,567 |
| 48. | Ellsworth | 36.4% | 12.9%(+23.5)#48 | 13.7%(+22.7)#2,645 |
| 49. | Garden Prairie | 36.3% | 12.9%(+23.4)#49 | 13.7%(+22.6)#2,662 |
| 50. | West City | 36.2% | 12.9%(+23.3)#50 | 13.7%(+22.5)#2,692 |
| 51. | Unity | 36.0% | 12.9%(+23.1)#51 | 13.7%(+22.3)#2,723 |
| 52. | Nauvoo | 35.8% | 12.9%(+22.9)#52 | 13.7%(+22.1)#2,772 |
| 53. | Chemung | 35.8% | 12.9%(+22.9)#53 | 13.7%(+22.1)#2,777 |
| 54. | Bardolph | 35.8% | 12.9%(+22.9)#54 | 13.7%(+22.1)#2,785 |
| 55. | Clay City | 35.7% | 12.9%(+22.8)#55 | 13.7%(+22.0)#2,802 |
| 56. | Table Grove | 35.6% | 12.9%(+22.7)#56 | 13.7%(+21.9)#2,812 |
| 57. | East Carondelet | 35.5% | 12.9%(+22.6)#57 | 13.7%(+21.8)#2,834 |
| 58. | Channel Lake | 35.5% | 12.9%(+22.6)#58 | 13.7%(+21.8)#2,837 |
| 59. | Verona | 35.2% | 12.9%(+22.3)#59 | 13.7%(+21.5)#2,900 |
| 60. | Phoenix | 35.2% | 12.9%(+22.3)#60 | 13.7%(+21.5)#2,906 |
| 61. | West Frankfort | 35.1% | 12.9%(+22.2)#61 | 13.7%(+21.4)#2,923 |
| 62. | Claremont | 34.6% | 12.9%(+21.7)#62 | 13.7%(+20.9)#3,037 |
| 63. | Buncombe | 34.5% | 12.9%(+21.6)#63 | 13.7%(+20.8)#3,053 |
| 64. | Bellmont | 34.5% | 12.9%(+21.5)#64 | 13.7%(+20.8)#3,059 |
| 65. | Robbins | 34.4% | 12.9%(+21.5)#65 | 13.7%(+20.7)#3,063 |
| 66. | Kampsville | 34.2% | 12.9%(+21.3)#66 | 13.7%(+20.5)#3,108 |
| 67. | Harvel | 34.2% | 12.9%(+21.3)#67 | 13.7%(+20.5)#3,117 |
| 68. | Mason | 34.1% | 12.9%(+21.2)#68 | 13.7%(+20.4)#3,123 |
| 69. | Riverdale | 34.1% | 12.9%(+21.2)#69 | 13.7%(+20.4)#3,137 |
| 70. | Media | 34.0% | 12.9%(+21.1)#70 | 13.7%(+20.3)#3,160 |
| 71. | Dalton City | 33.8% | 12.9%(+20.9)#71 | 13.7%(+20.1)#3,177 |
| 72. | Golconda | 33.8% | 12.9%(+20.9)#72 | 13.7%(+20.1)#3,195 |
| 73. | Serena | 33.6% | 12.9%(+20.7)#73 | 13.7%(+19.9)#3,216 |
| 74. | Shawneetown | 33.4% | 12.9%(+20.5)#74 | 13.7%(+19.7)#3,274 |
| 75. | Como | 33.3% | 12.9%(+20.4)#75 | 13.7%(+19.6)#3,290 |
| 76. | Sims | 33.3% | 12.9%(+20.4)#76 | 13.7%(+19.6)#3,300 |
| 77. | Macedonia | 33.3% | 12.9%(+20.4)#77 | 13.7%(+19.6)#3,323 |
| 78. | Melvin | 32.8% | 12.9%(+19.9)#78 | 13.7%(+19.1)#3,421 |
| 79. | Grayville | 32.6% | 12.9%(+19.7)#79 | 13.7%(+18.9)#3,452 |
| 80. | Kankakee | 32.3% | 12.9%(+19.4)#80 | 13.7%(+18.6)#3,540 |
| 81. | Sun River Terrace | 32.1% | 12.9%(+19.2)#81 | 13.7%(+18.4)#3,588 |
| 82. | Anna | 32.0% | 12.9%(+19.1)#82 | 13.7%(+18.3)#3,598 |
| 83. | Macomb | 32.0% | 12.9%(+19.1)#83 | 13.7%(+18.3)#3,601 |
| 84. | Rosiclare | 31.8% | 12.9%(+18.9)#84 | 13.7%(+18.1)#3,654 |
| 85. | Forest City | 31.7% | 12.9%(+18.8)#85 | 13.7%(+18.0)#3,663 |
| 86. | Beecher City | 31.6% | 12.9%(+18.7)#86 | 13.7%(+17.9)#3,698 |
| 87. | Riggston | 31.2% | 12.9%(+18.3)#87 | 13.7%(+17.6)#3,781 |
| 88. | Sauk Village | 31.2% | 12.9%(+18.3)#88 | 13.7%(+17.5)#3,793 |
| 89. | Campbell's Island | 30.8% | 12.9%(+17.9)#89 | 13.7%(+17.1)#3,911 |
| 90. | Louisville | 30.7% | 12.9%(+17.8)#90 | 13.7%(+17.0)#3,939 |
| 91. | New Douglas | 30.5% | 12.9%(+17.6)#91 | 13.7%(+16.8)#3,997 |
| 92. | East St Louis | 30.4% | 12.9%(+17.5)#92 | 13.7%(+16.7)#4,023 |
| 93. | Du Quoin | 30.3% | 12.9%(+17.4)#93 | 13.7%(+16.6)#4,068 |
| 94. | Woodland | 30.3% | 12.9%(+17.4)#94 | 13.7%(+16.6)#4,071 |
| 95. | Central City | 30.2% | 12.9%(+17.3)#95 | 13.7%(+16.5)#4,077 |
| 96. | Crossville | 30.1% | 12.9%(+17.2)#96 | 13.7%(+16.4)#4,117 |
| 97. | Bay View Gardens | 30.1% | 12.9%(+17.2)#97 | 13.7%(+16.4)#4,133 |
| 98. | Time | 30.0% | 12.9%(+17.1)#98 | 13.7%(+16.3)#4,156 |
| 99. | Gulfport | 29.6% | 12.9%(+16.7)#99 | 13.7%(+15.9)#4,248 |
| 100. | Keyesport | 29.4% | 12.9%(+16.5)#100 | 13.7%(+15.7)#4,313 |
Common Questions
What are the Top 10 Cities with the Highest Female Poverty Level in Illinois?
Top 10 Cities with the Highest Female Poverty Level in Illinois are:
#1
100.0%
#2
100.0%
#3
80.0%
#4
66.7%
#5
63.8%
#6
60.4%
#7
56.1%
#8
49.2%
#9
49.1%
#10
47.2%
What city has the Highest Female Poverty Level in Illinois?
Valley City has the Highest Female Poverty Level in Illinois with 100.0%.
What is the Poverty Level Among Females in the State of Illinois?
Poverty Level Among Females in Illinois is 12.9%.
What is the Poverty Level Among Females in the United States?
Poverty Level Among Females in the United States is 13.7%.