Cities with the Lowest Poverty Level Among Single Males in Illinois
RELATED REPORTS & OPTIONS
Lowest Poverty | Single Male
Illinois
Compare Cities
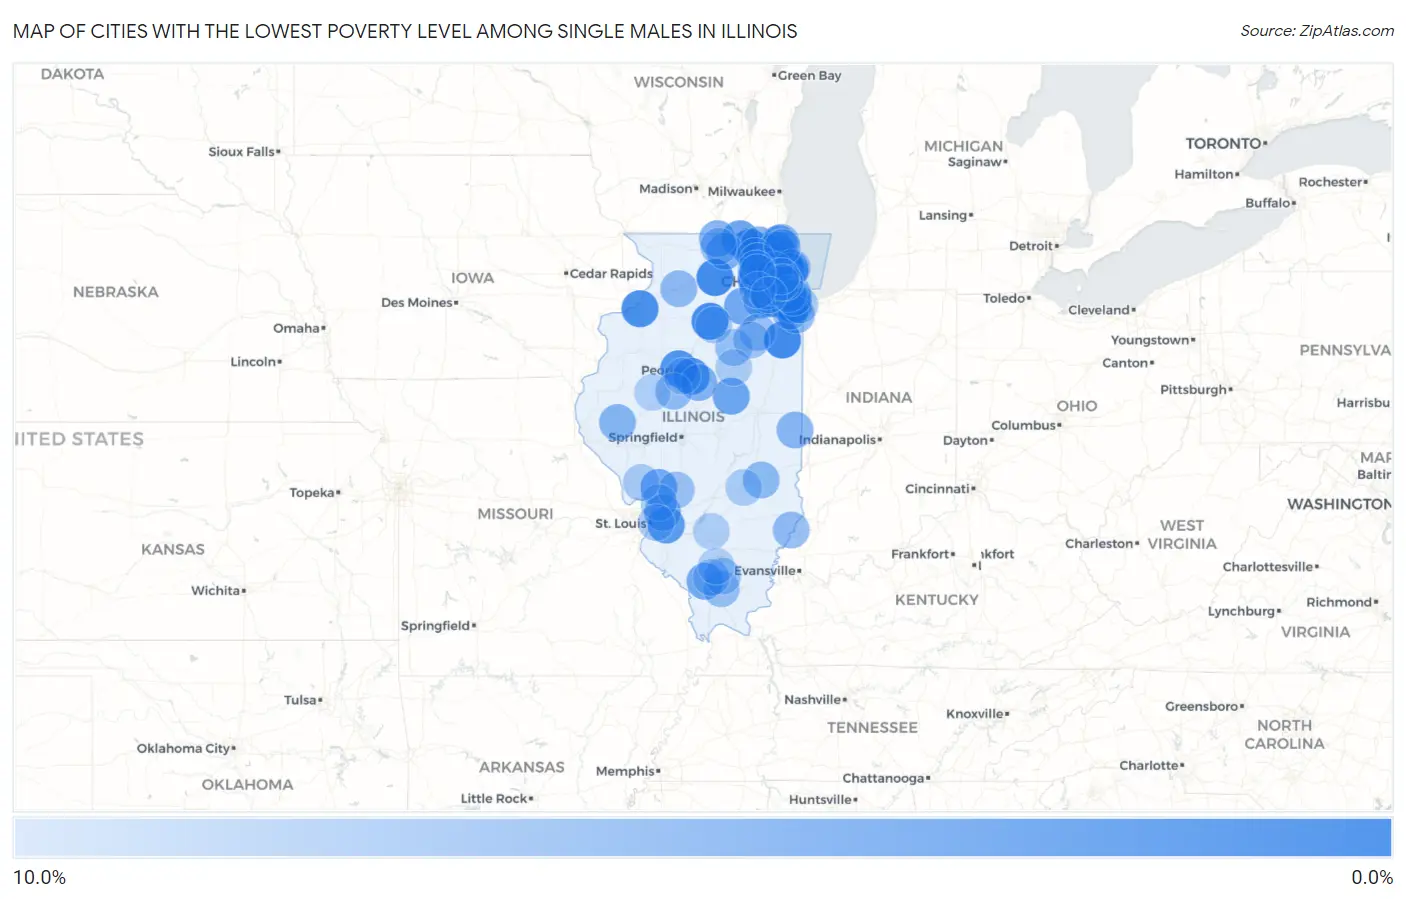
Map of Cities with the Lowest Poverty Level Among Single Males in Illinois
10.0%
0.0%
Cities with the Lowest Poverty Level Among Single Males in Illinois
| City | Single Male Poverty | vs State | vs National | |
| 1. | St Charles | 0.55% | 12.2%(-11.6)#1 | 12.4%(-11.9)#11 |
| 2. | Romeoville | 1.1% | 12.2%(-11.1)#2 | 12.4%(-11.3)#47 |
| 3. | Kankakee | 1.1% | 12.2%(-11.1)#3 | 12.4%(-11.3)#48 |
| 4. | Bensenville | 1.2% | 12.2%(-11.0)#4 | 12.4%(-11.3)#56 |
| 5. | Rochelle | 1.2% | 12.2%(-11.0)#5 | 12.4%(-11.2)#58 |
| 6. | Peru | 1.3% | 12.2%(-10.9)#6 | 12.4%(-11.1)#71 |
| 7. | Hazel Crest | 1.4% | 12.2%(-10.8)#7 | 12.4%(-11.1)#80 |
| 8. | Crystal Lake | 1.4% | 12.2%(-10.8)#8 | 12.4%(-11.0)#86 |
| 9. | Wheeling | 1.5% | 12.2%(-10.7)#9 | 12.4%(-11.0)#94 |
| 10. | Oak Forest | 1.5% | 12.2%(-10.7)#10 | 12.4%(-10.9)#101 |
| 11. | Woodstock | 1.7% | 12.2%(-10.5)#11 | 12.4%(-10.7)#126 |
| 12. | East Moline | 1.7% | 12.2%(-10.5)#12 | 12.4%(-10.7)#130 |
| 13. | Woodridge | 1.8% | 12.2%(-10.4)#13 | 12.4%(-10.7)#138 |
| 14. | Downers Grove | 2.0% | 12.2%(-10.2)#14 | 12.4%(-10.5)#175 |
| 15. | Cahokia Heights | 2.2% | 12.2%(-9.98)#15 | 12.4%(-10.2)#214 |
| 16. | Norwood | 2.2% | 12.2%(-9.97)#16 | 12.4%(-10.2)#218 |
| 17. | Mount Prospect | 2.3% | 12.2%(-9.91)#17 | 12.4%(-10.1)#235 |
| 18. | Park Ridge | 2.3% | 12.2%(-9.85)#18 | 12.4%(-10.1)#244 |
| 19. | Villa Park | 2.4% | 12.2%(-9.82)#19 | 12.4%(-10.1)#249 |
| 20. | Morton | 2.4% | 12.2%(-9.77)#20 | 12.4%(-10.0)#255 |
| 21. | Vernon Hills | 2.4% | 12.2%(-9.76)#21 | 12.4%(-10.00)#257 |
| 22. | Skokie | 2.7% | 12.2%(-9.47)#22 | 12.4%(-9.71)#301 |
| 23. | O Fallon | 2.8% | 12.2%(-9.36)#23 | 12.4%(-9.60)#316 |
| 24. | Glenview | 2.9% | 12.2%(-9.33)#24 | 12.4%(-9.57)#325 |
| 25. | Bloomingdale | 2.9% | 12.2%(-9.28)#25 | 12.4%(-9.52)#341 |
| 26. | West Chicago | 3.0% | 12.2%(-9.15)#26 | 12.4%(-9.39)#364 |
| 27. | Glendale Heights | 3.2% | 12.2%(-9.03)#27 | 12.4%(-9.27)#388 |
| 28. | Geneva | 3.2% | 12.2%(-9.01)#28 | 12.4%(-9.25)#393 |
| 29. | Schaumburg | 3.2% | 12.2%(-8.96)#29 | 12.4%(-9.20)#402 |
| 30. | Melrose Park | 3.4% | 12.2%(-8.81)#30 | 12.4%(-9.05)#434 |
| 31. | Harvard | 3.6% | 12.2%(-8.58)#31 | 12.4%(-8.82)#492 |
| 32. | Arlington Heights | 3.6% | 12.2%(-8.56)#32 | 12.4%(-8.80)#497 |
| 33. | Niles | 3.8% | 12.2%(-8.38)#33 | 12.4%(-8.62)#532 |
| 34. | Le Roy | 3.9% | 12.2%(-8.26)#34 | 12.4%(-8.50)#562 |
| 35. | Country Club Hills | 4.1% | 12.2%(-8.11)#35 | 12.4%(-8.35)#600 |
| 36. | Newark | 4.2% | 12.2%(-8.03)#36 | 12.4%(-8.27)#625 |
| 37. | Shipman | 4.2% | 12.2%(-8.03)#37 | 12.4%(-8.27)#629 |
| 38. | De Soto | 4.3% | 12.2%(-7.91)#38 | 12.4%(-8.15)#653 |
| 39. | Gurnee | 4.3% | 12.2%(-7.85)#39 | 12.4%(-8.09)#661 |
| 40. | Streamwood | 4.5% | 12.2%(-7.74)#40 | 12.4%(-7.98)#691 |
| 41. | Elmhurst | 4.5% | 12.2%(-7.74)#41 | 12.4%(-7.97)#693 |
| 42. | Glen Carbon | 4.6% | 12.2%(-7.62)#42 | 12.4%(-7.86)#718 |
| 43. | Belvidere | 4.8% | 12.2%(-7.39)#43 | 12.4%(-7.63)#785 |
| 44. | Roscoe | 5.0% | 12.2%(-7.23)#44 | 12.4%(-7.47)#823 |
| 45. | Mchenry | 5.2% | 12.2%(-7.03)#45 | 12.4%(-7.27)#876 |
| 46. | Libertyville | 5.2% | 12.2%(-6.97)#46 | 12.4%(-7.21)#892 |
| 47. | Mackinaw | 5.3% | 12.2%(-6.93)#47 | 12.4%(-7.17)#904 |
| 48. | Hoffman Estates | 5.3% | 12.2%(-6.91)#48 | 12.4%(-7.15)#917 |
| 49. | Plainfield | 5.5% | 12.2%(-6.70)#49 | 12.4%(-6.94)#966 |
| 50. | Mount Sterling | 5.6% | 12.2%(-6.64)#50 | 12.4%(-6.88)#976 |
| 51. | Homewood | 5.7% | 12.2%(-6.49)#51 | 12.4%(-6.73)#1,009 |
| 52. | Evergreen Park | 5.7% | 12.2%(-6.49)#52 | 12.4%(-6.73)#1,011 |
| 53. | Ridge Farm | 5.7% | 12.2%(-6.48)#53 | 12.4%(-6.72)#1,019 |
| 54. | Lisle | 5.7% | 12.2%(-6.47)#54 | 12.4%(-6.70)#1,021 |
| 55. | Jewett | 5.9% | 12.2%(-6.31)#55 | 12.4%(-6.55)#1,071 |
| 56. | Crete | 5.9% | 12.2%(-6.28)#56 | 12.4%(-6.51)#1,081 |
| 57. | Rock Falls | 6.1% | 12.2%(-6.09)#57 | 12.4%(-6.33)#1,123 |
| 58. | Waukegan | 6.1% | 12.2%(-6.06)#58 | 12.4%(-6.30)#1,131 |
| 59. | Richton Park | 6.2% | 12.2%(-5.95)#59 | 12.4%(-6.19)#1,153 |
| 60. | Manito | 6.2% | 12.2%(-5.95)#60 | 12.4%(-6.19)#1,159 |
| 61. | Allendale | 6.2% | 12.2%(-5.95)#61 | 12.4%(-6.19)#1,163 |
| 62. | Oak Park | 6.3% | 12.2%(-5.87)#62 | 12.4%(-6.11)#1,180 |
| 63. | Oak Brook | 6.6% | 12.2%(-5.59)#63 | 12.4%(-5.83)#1,255 |
| 64. | Westmont | 6.6% | 12.2%(-5.57)#64 | 12.4%(-5.81)#1,258 |
| 65. | Marion | 6.6% | 12.2%(-5.56)#65 | 12.4%(-5.80)#1,263 |
| 66. | Cornell | 6.7% | 12.2%(-5.53)#66 | 12.4%(-5.77)#1,284 |
| 67. | Loves Park | 6.7% | 12.2%(-5.45)#67 | 12.4%(-5.69)#1,303 |
| 68. | Mount Olive | 6.8% | 12.2%(-5.42)#68 | 12.4%(-5.66)#1,310 |
| 69. | Gardner | 6.8% | 12.2%(-5.42)#69 | 12.4%(-5.66)#1,312 |
| 70. | Naperville | 6.8% | 12.2%(-5.37)#70 | 12.4%(-5.61)#1,333 |
| 71. | Lincolnwood | 6.9% | 12.2%(-5.33)#71 | 12.4%(-5.57)#1,338 |
| 72. | Lake In The Hills | 6.9% | 12.2%(-5.32)#72 | 12.4%(-5.56)#1,341 |
| 73. | Addison | 6.9% | 12.2%(-5.27)#73 | 12.4%(-5.51)#1,358 |
| 74. | Evanston | 7.0% | 12.2%(-5.21)#74 | 12.4%(-5.45)#1,379 |
| 75. | Elk Grove Village | 7.0% | 12.2%(-5.15)#75 | 12.4%(-5.39)#1,393 |
| 76. | Dwight | 7.1% | 12.2%(-5.05)#76 | 12.4%(-5.29)#1,411 |
| 77. | Carpentersville | 7.2% | 12.2%(-5.01)#77 | 12.4%(-5.25)#1,441 |
| 78. | West Frankfort | 7.2% | 12.2%(-4.99)#78 | 12.4%(-5.23)#1,443 |
| 79. | Lansing | 7.4% | 12.2%(-4.77)#79 | 12.4%(-5.01)#1,502 |
| 80. | North Chicago | 7.4% | 12.2%(-4.75)#80 | 12.4%(-4.99)#1,505 |
| 81. | Oak Lawn | 7.5% | 12.2%(-4.71)#81 | 12.4%(-4.95)#1,512 |
| 82. | Royalton | 7.5% | 12.2%(-4.70)#82 | 12.4%(-4.94)#1,524 |
| 83. | Bethalto | 7.5% | 12.2%(-4.65)#83 | 12.4%(-4.89)#1,537 |
| 84. | Elgin | 7.6% | 12.2%(-4.63)#84 | 12.4%(-4.87)#1,541 |
| 85. | Washington Park | 7.6% | 12.2%(-4.60)#85 | 12.4%(-4.84)#1,547 |
| 86. | Kane | 7.7% | 12.2%(-4.50)#86 | 12.4%(-4.74)#1,601 |
| 87. | Oglesby | 7.9% | 12.2%(-4.30)#87 | 12.4%(-4.54)#1,645 |
| 88. | Blue Island | 7.9% | 12.2%(-4.29)#88 | 12.4%(-4.53)#1,654 |
| 89. | Effingham | 7.9% | 12.2%(-4.28)#89 | 12.4%(-4.51)#1,657 |
| 90. | North Riverside | 8.0% | 12.2%(-4.20)#90 | 12.4%(-4.44)#1,682 |
| 91. | Chenoa | 8.0% | 12.2%(-4.20)#91 | 12.4%(-4.44)#1,686 |
| 92. | Centralia | 8.1% | 12.2%(-4.11)#92 | 12.4%(-4.35)#1,711 |
| 93. | Lewistown | 8.2% | 12.2%(-4.00)#93 | 12.4%(-4.24)#1,743 |
| 94. | Westchester | 8.2% | 12.2%(-3.98)#94 | 12.4%(-4.22)#1,745 |
| 95. | Franklin Park | 8.3% | 12.2%(-3.92)#95 | 12.4%(-4.16)#1,761 |
| 96. | Aurora | 8.3% | 12.2%(-3.89)#96 | 12.4%(-4.12)#1,775 |
| 97. | South Elgin | 8.3% | 12.2%(-3.89)#97 | 12.4%(-4.12)#1,776 |
| 98. | North Pekin | 8.3% | 12.2%(-3.86)#98 | 12.4%(-4.10)#1,786 |
| 99. | Valier | 8.3% | 12.2%(-3.86)#99 | 12.4%(-4.10)#1,800 |
| 100. | Bolingbrook | 8.6% | 12.2%(-3.55)#100 | 12.4%(-3.79)#1,891 |
Common Questions
What are the Top 10 Cities with the Lowest Poverty Level Among Single Males in Illinois?
Top 10 Cities with the Lowest Poverty Level Among Single Males in Illinois are:
#1
0.55%
#2
1.1%
#3
1.1%
#4
1.2%
#5
1.2%
#6
1.3%
#7
1.4%
#8
1.4%
#9
1.5%
#10
1.5%
What city has the Lowest Poverty Level Among Single Males in Illinois?
St Charles has the Lowest Poverty Level Among Single Males in Illinois with 0.55%.
What is the Poverty Level Among Single Males in the State of Illinois?
Poverty Level Among Single Males in Illinois is 12.2%.
What is the Poverty Level Among Single Males in the United States?
Poverty Level Among Single Males in the United States is 12.4%.