Cities with the Most Immigrants from Serbia in Illinois
RELATED REPORTS & OPTIONS
Serbia
Illinois
Compare Cities
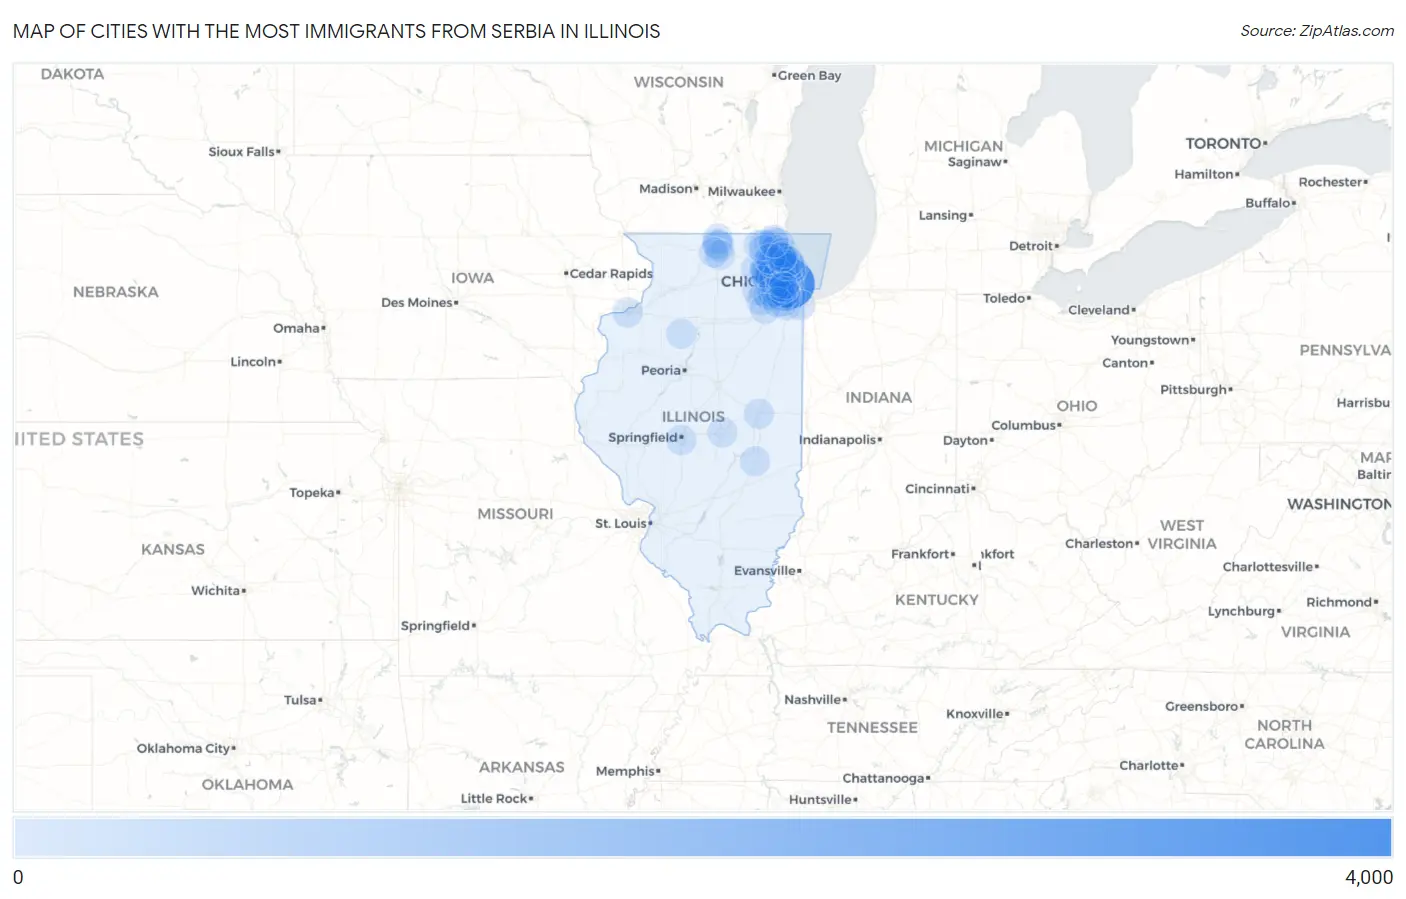
Map of Cities with the Most Immigrants from Serbia in Illinois
0
4,000
Cities with the Most Immigrants from Serbia in Illinois
| City | Serbia | vs State | vs National | |
| 1. | Chicago | 3,094 | 8,574(36.09%)#1 | 42,332(7.31%)#2 |
| 2. | Hoffman Estates | 319 | 8,574(3.72%)#2 | 42,332(0.75%)#8 |
| 3. | Niles | 241 | 8,574(2.81%)#3 | 42,332(0.57%)#15 |
| 4. | Naperville | 228 | 8,574(2.66%)#4 | 42,332(0.54%)#17 |
| 5. | Des Plaines | 209 | 8,574(2.44%)#5 | 42,332(0.49%)#21 |
| 6. | Lyons | 207 | 8,574(2.41%)#6 | 42,332(0.49%)#23 |
| 7. | Countryside | 188 | 8,574(2.19%)#7 | 42,332(0.44%)#27 |
| 8. | Prospect Heights | 170 | 8,574(1.98%)#8 | 42,332(0.40%)#30 |
| 9. | Brookfield | 165 | 8,574(1.92%)#9 | 42,332(0.39%)#33 |
| 10. | Skokie | 164 | 8,574(1.91%)#10 | 42,332(0.39%)#35 |
| 11. | Indian Head Park | 146 | 8,574(1.70%)#11 | 42,332(0.34%)#40 |
| 12. | Addison | 144 | 8,574(1.68%)#12 | 42,332(0.34%)#41 |
| 13. | Park Ridge | 141 | 8,574(1.64%)#13 | 42,332(0.33%)#42 |
| 14. | Loves Park | 135 | 8,574(1.57%)#14 | 42,332(0.32%)#45 |
| 15. | Norridge | 123 | 8,574(1.43%)#15 | 42,332(0.29%)#49 |
| 16. | Arlington Heights | 115 | 8,574(1.34%)#16 | 42,332(0.27%)#52 |
| 17. | La Grange | 103 | 8,574(1.20%)#17 | 42,332(0.24%)#63 |
| 18. | Lincolnwood | 100 | 8,574(1.17%)#18 | 42,332(0.24%)#66 |
| 19. | Wood Dale | 98 | 8,574(1.14%)#19 | 42,332(0.23%)#67 |
| 20. | Hinsdale | 82 | 8,574(0.96%)#20 | 42,332(0.19%)#83 |
| 21. | Elk Grove Village | 81 | 8,574(0.94%)#21 | 42,332(0.19%)#84 |
| 22. | Westmont | 80 | 8,574(0.93%)#22 | 42,332(0.19%)#85 |
| 23. | Tinley Park | 67 | 8,574(0.78%)#23 | 42,332(0.16%)#115 |
| 24. | Alsip | 66 | 8,574(0.77%)#24 | 42,332(0.16%)#119 |
| 25. | Gurnee | 62 | 8,574(0.72%)#25 | 42,332(0.15%)#126 |
| 26. | Palos Hills | 61 | 8,574(0.71%)#26 | 42,332(0.14%)#128 |
| 27. | Morton Grove | 59 | 8,574(0.69%)#27 | 42,332(0.14%)#135 |
| 28. | Wheaton | 57 | 8,574(0.66%)#28 | 42,332(0.13%)#141 |
| 29. | Downers Grove | 54 | 8,574(0.63%)#29 | 42,332(0.13%)#149 |
| 30. | Glendale Heights | 52 | 8,574(0.61%)#30 | 42,332(0.12%)#155 |
| 31. | Harwood Heights | 51 | 8,574(0.59%)#31 | 42,332(0.12%)#164 |
| 32. | Schaumburg | 49 | 8,574(0.57%)#32 | 42,332(0.12%)#173 |
| 33. | Aurora | 48 | 8,574(0.56%)#33 | 42,332(0.11%)#174 |
| 34. | Plainfield | 47 | 8,574(0.55%)#34 | 42,332(0.11%)#177 |
| 35. | Elgin | 45 | 8,574(0.52%)#35 | 42,332(0.11%)#189 |
| 36. | Bolingbrook | 45 | 8,574(0.52%)#36 | 42,332(0.11%)#190 |
| 37. | Carol Stream | 42 | 8,574(0.49%)#37 | 42,332(0.10%)#205 |
| 38. | Darien | 39 | 8,574(0.45%)#38 | 42,332(0.09%)#222 |
| 39. | Mundelein | 38 | 8,574(0.44%)#39 | 42,332(0.09%)#223 |
| 40. | Lansing | 34 | 8,574(0.40%)#40 | 42,332(0.08%)#250 |
| 41. | Westchester | 34 | 8,574(0.40%)#41 | 42,332(0.08%)#252 |
| 42. | Bartlett | 31 | 8,574(0.36%)#42 | 42,332(0.07%)#274 |
| 43. | Cicero | 30 | 8,574(0.35%)#43 | 42,332(0.07%)#277 |
| 44. | Libertyville | 29 | 8,574(0.34%)#44 | 42,332(0.07%)#288 |
| 45. | Bloomingdale | 27 | 8,574(0.31%)#45 | 42,332(0.06%)#305 |
| 46. | Oak Park | 26 | 8,574(0.30%)#46 | 42,332(0.06%)#313 |
| 47. | Orland Park | 25 | 8,574(0.29%)#47 | 42,332(0.06%)#321 |
| 48. | Mount Prospect | 25 | 8,574(0.29%)#48 | 42,332(0.06%)#322 |
| 49. | Streamwood | 25 | 8,574(0.29%)#49 | 42,332(0.06%)#323 |
| 50. | Lindenhurst | 25 | 8,574(0.29%)#50 | 42,332(0.06%)#326 |
| 51. | Burr Ridge | 25 | 8,574(0.29%)#51 | 42,332(0.06%)#327 |
| 52. | Northbrook | 24 | 8,574(0.28%)#52 | 42,332(0.06%)#332 |
| 53. | Champaign | 23 | 8,574(0.27%)#53 | 42,332(0.05%)#341 |
| 54. | Mchenry | 23 | 8,574(0.27%)#54 | 42,332(0.05%)#348 |
| 55. | Vernon Hills | 23 | 8,574(0.27%)#55 | 42,332(0.05%)#349 |
| 56. | Deerfield | 23 | 8,574(0.27%)#56 | 42,332(0.05%)#350 |
| 57. | Roscoe | 23 | 8,574(0.27%)#57 | 42,332(0.05%)#352 |
| 58. | Franklin Park | 22 | 8,574(0.26%)#58 | 42,332(0.05%)#360 |
| 59. | Rock Island | 21 | 8,574(0.24%)#59 | 42,332(0.05%)#372 |
| 60. | Palos Heights | 21 | 8,574(0.24%)#60 | 42,332(0.05%)#374 |
| 61. | Evanston | 19 | 8,574(0.22%)#61 | 42,332(0.04%)#397 |
| 62. | Hanover Park | 19 | 8,574(0.22%)#62 | 42,332(0.04%)#400 |
| 63. | Palos Park | 19 | 8,574(0.22%)#63 | 42,332(0.04%)#411 |
| 64. | Machesney Park | 18 | 8,574(0.21%)#64 | 42,332(0.04%)#421 |
| 65. | Decatur | 17 | 8,574(0.20%)#65 | 42,332(0.04%)#431 |
| 66. | Round Lake | 17 | 8,574(0.20%)#66 | 42,332(0.04%)#440 |
| 67. | Lombard | 16 | 8,574(0.19%)#67 | 42,332(0.04%)#454 |
| 68. | Hillside | 16 | 8,574(0.19%)#68 | 42,332(0.04%)#463 |
| 69. | Woodridge | 15 | 8,574(0.17%)#69 | 42,332(0.04%)#472 |
| 70. | Cherry Valley | 14 | 8,574(0.16%)#70 | 42,332(0.03%)#499 |
| 71. | Palatine | 13 | 8,574(0.15%)#71 | 42,332(0.03%)#508 |
| 72. | Bensenville | 12 | 8,574(0.14%)#72 | 42,332(0.03%)#535 |
| 73. | Western Springs | 11 | 8,574(0.13%)#73 | 42,332(0.03%)#555 |
| 74. | Mattoon | 10 | 8,574(0.12%)#74 | 42,332(0.02%)#585 |
| 75. | Island Lake | 10 | 8,574(0.12%)#75 | 42,332(0.02%)#592 |
| 76. | Lakemoor | 10 | 8,574(0.12%)#76 | 42,332(0.02%)#594 |
| 77. | Southern View | 10 | 8,574(0.12%)#77 | 42,332(0.02%)#604 |
| 78. | Rockford | 9 | 8,574(0.10%)#78 | 42,332(0.02%)#607 |
| 79. | Hickory Hills | 9 | 8,574(0.10%)#79 | 42,332(0.02%)#618 |
| 80. | Glenview | 8 | 8,574(0.09%)#80 | 42,332(0.02%)#636 |
| 81. | Wilmette | 8 | 8,574(0.09%)#81 | 42,332(0.02%)#641 |
| 82. | Lake Forest | 8 | 8,574(0.09%)#82 | 42,332(0.02%)#645 |
| 83. | Joliet | 7 | 8,574(0.08%)#83 | 42,332(0.02%)#658 |
| 84. | Homer Glen | 7 | 8,574(0.08%)#84 | 42,332(0.02%)#668 |
| 85. | Riverside | 7 | 8,574(0.08%)#85 | 42,332(0.02%)#676 |
| 86. | Bannockburn | 5 | 8,574(0.06%)#86 | 42,332(0.01%)#733 |
| 87. | Glencoe | 4 | 8,574(0.05%)#87 | 42,332(0.01%)#740 |
| 88. | Deer Park | 4 | 8,574(0.05%)#88 | 42,332(0.01%)#744 |
| 89. | Riverwoods | 3 | 8,574(0.03%)#89 | 42,332(0.01%)#756 |
| 90. | Mccook | 3 | 8,574(0.03%)#90 | 42,332(0.01%)#761 |
| 91. | Third Lake | 2 | 8,574(0.02%)#91 | 42,332(0.00%)#768 |
| 92. | Bradford | 1 | 8,574(0.01%)#92 | 42,332(0.00%)#772 |
Common Questions
What are the Top 10 Cities with the Most Immigrants from Serbia in Illinois?
Top 10 Cities with the Most Immigrants from Serbia in Illinois are:
#1
3,094
#2
319
#3
241
#4
228
#5
209
#6
207
#7
188
#8
170
#9
165
#10
164
What city has the Most Immigrants from Serbia in Illinois?
Chicago has the Most Immigrants from Serbia in Illinois with 3,094.
What is the Total Immigrants from Serbia in the State of Illinois?
Total Immigrants from Serbia in Illinois is 8,574.
What is the Total Immigrants from Serbia in the United States?
Total Immigrants from Serbia in the United States is 42,332.