Cities with the Highest Percentage of Immigrants from Eastern Asia in Illinois
RELATED REPORTS & OPTIONS
Eastern Asia
Illinois
Compare Cities
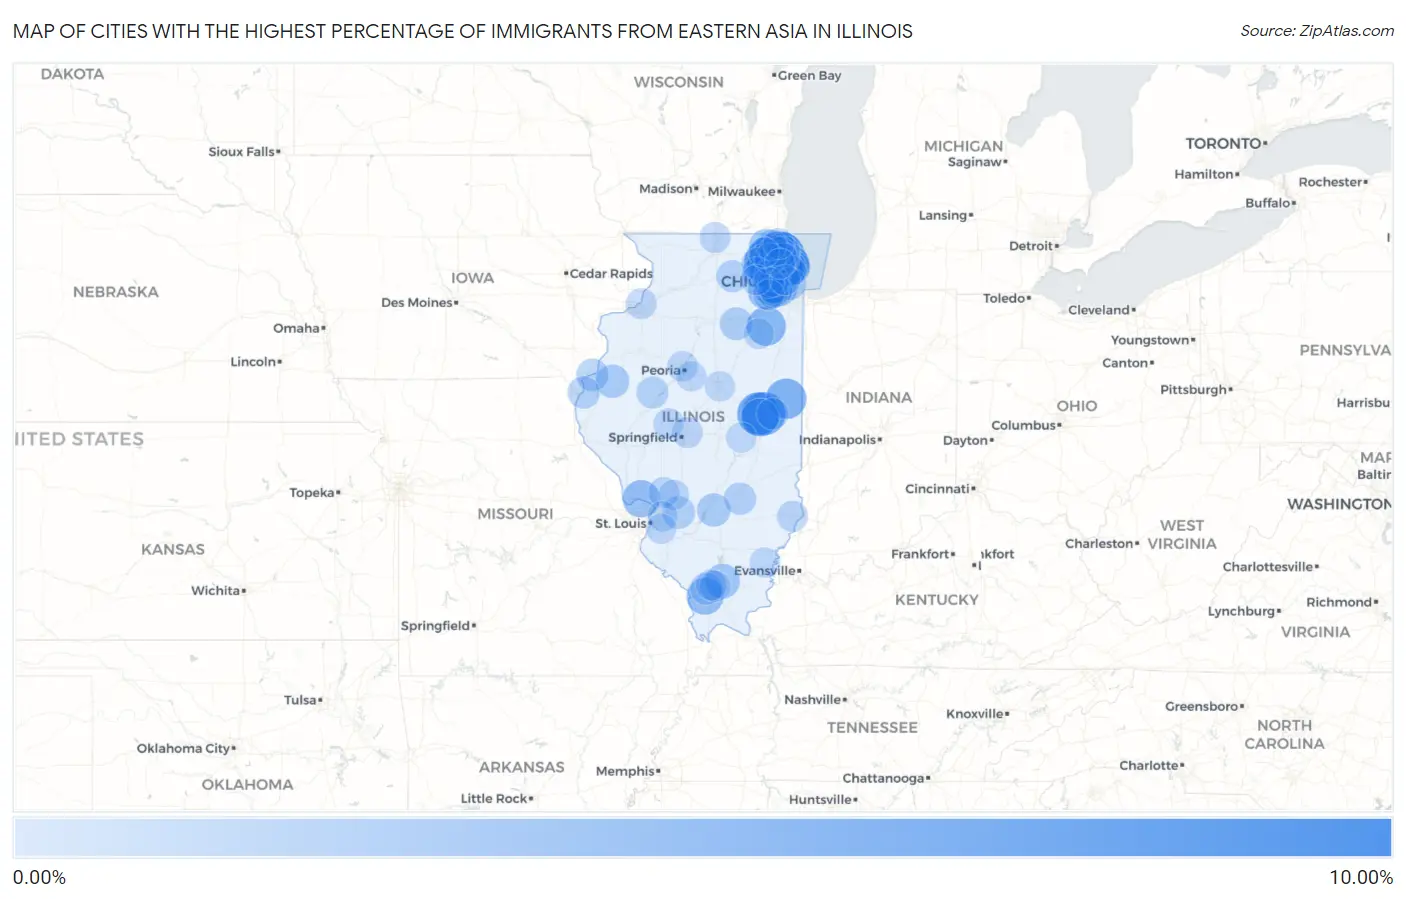
Map of Cities with the Highest Percentage of Immigrants from Eastern Asia in Illinois
0.00%
10.00%
Cities with the Highest Percentage of Immigrants from Eastern Asia in Illinois
| City | Eastern Asia | vs State | vs National | |
| 1. | Lincolnshire | 9.18% | 1.12%(+8.06)#1 | 1.28%(+7.91)#191 |
| 2. | Inverness | 8.84% | 1.12%(+7.72)#2 | 1.28%(+7.57)#206 |
| 3. | Kildeer | 6.70% | 1.12%(+5.58)#3 | 1.28%(+5.43)#315 |
| 4. | Vernon Hills | 6.61% | 1.12%(+5.49)#4 | 1.28%(+5.33)#318 |
| 5. | Urbana | 6.55% | 1.12%(+5.43)#5 | 1.28%(+5.27)#324 |
| 6. | Champaign | 6.34% | 1.12%(+5.21)#6 | 1.28%(+5.06)#342 |
| 7. | Northfield | 6.06% | 1.12%(+4.94)#7 | 1.28%(+4.79)#368 |
| 8. | Buffalo Grove | 5.90% | 1.12%(+4.78)#8 | 1.28%(+4.62)#382 |
| 9. | Northbrook | 5.86% | 1.12%(+4.74)#9 | 1.28%(+4.58)#391 |
| 10. | Glenview | 5.57% | 1.12%(+4.45)#10 | 1.28%(+4.29)#426 |
| 11. | South Barrington | 5.30% | 1.12%(+4.18)#11 | 1.28%(+4.02)#451 |
| 12. | Potomac | 5.24% | 1.12%(+4.11)#12 | 1.28%(+3.96)#460 |
| 13. | Wilmette | 4.97% | 1.12%(+3.84)#13 | 1.28%(+3.69)#494 |
| 14. | Lakewood Shores | 4.73% | 1.12%(+3.60)#14 | 1.28%(+3.45)#531 |
| 15. | Hoffman Estates | 4.46% | 1.12%(+3.34)#15 | 1.28%(+3.19)#581 |
| 16. | Long Grove | 4.30% | 1.12%(+3.18)#16 | 1.28%(+3.02)#608 |
| 17. | Savoy | 4.25% | 1.12%(+3.13)#17 | 1.28%(+2.97)#621 |
| 18. | Schaumburg | 4.22% | 1.12%(+3.10)#18 | 1.28%(+2.95)#625 |
| 19. | Hinsdale | 4.09% | 1.12%(+2.97)#19 | 1.28%(+2.81)#651 |
| 20. | Elsah | 3.97% | 1.12%(+2.85)#20 | 1.28%(+2.70)#667 |
| 21. | Oak Brook | 3.86% | 1.12%(+2.73)#21 | 1.28%(+2.58)#693 |
| 22. | Hawthorn Woods | 3.81% | 1.12%(+2.69)#22 | 1.28%(+2.53)#710 |
| 23. | Makanda | 3.80% | 1.12%(+2.68)#23 | 1.28%(+2.52)#714 |
| 24. | Naperville | 3.68% | 1.12%(+2.55)#24 | 1.28%(+2.40)#749 |
| 25. | North Barrington | 3.49% | 1.12%(+2.37)#25 | 1.28%(+2.22)#794 |
| 26. | Rolling Meadows | 3.36% | 1.12%(+2.24)#26 | 1.28%(+2.09)#848 |
| 27. | Barrington | 3.28% | 1.12%(+2.16)#27 | 1.28%(+2.01)#872 |
| 28. | Itasca | 3.24% | 1.12%(+2.12)#28 | 1.28%(+1.97)#890 |
| 29. | Wheeling | 3.16% | 1.12%(+2.03)#29 | 1.28%(+1.88)#910 |
| 30. | Palatine | 3.15% | 1.12%(+2.03)#30 | 1.28%(+1.88)#911 |
| 31. | Niles | 3.12% | 1.12%(+2.00)#31 | 1.28%(+1.84)#918 |
| 32. | Golf | 3.11% | 1.12%(+1.99)#32 | 1.28%(+1.84)#920 |
| 33. | Lisle | 2.95% | 1.12%(+1.83)#33 | 1.28%(+1.68)#976 |
| 34. | Evanston | 2.94% | 1.12%(+1.82)#34 | 1.28%(+1.66)#984 |
| 35. | Johnston City | 2.87% | 1.12%(+1.75)#35 | 1.28%(+1.60)#1,017 |
| 36. | Volo | 2.81% | 1.12%(+1.69)#36 | 1.28%(+1.54)#1,040 |
| 37. | Morton Grove | 2.74% | 1.12%(+1.62)#37 | 1.28%(+1.47)#1,067 |
| 38. | Arlington Heights | 2.58% | 1.12%(+1.46)#38 | 1.28%(+1.31)#1,143 |
| 39. | Westmont | 2.58% | 1.12%(+1.46)#39 | 1.28%(+1.30)#1,145 |
| 40. | Lake Zurich | 2.58% | 1.12%(+1.45)#40 | 1.28%(+1.30)#1,146 |
| 41. | Bannockburn | 2.54% | 1.12%(+1.41)#41 | 1.28%(+1.26)#1,165 |
| 42. | Skokie | 2.52% | 1.12%(+1.40)#42 | 1.28%(+1.24)#1,174 |
| 43. | Barrington Hills | 2.47% | 1.12%(+1.35)#43 | 1.28%(+1.19)#1,199 |
| 44. | Blandinsville | 2.36% | 1.12%(+1.24)#44 | 1.28%(+1.08)#1,249 |
| 45. | Mount Prospect | 2.30% | 1.12%(+1.18)#45 | 1.28%(+1.03)#1,286 |
| 46. | Vernon | 2.25% | 1.12%(+1.12)#46 | 1.28%(+0.972)#1,316 |
| 47. | Marseilles | 2.12% | 1.12%(+0.996)#47 | 1.28%(+0.843)#1,406 |
| 48. | Libertyville | 2.11% | 1.12%(+0.989)#48 | 1.28%(+0.836)#1,410 |
| 49. | Lake Bluff | 2.08% | 1.12%(+0.955)#49 | 1.28%(+0.802)#1,441 |
| 50. | Lake Forest | 2.04% | 1.12%(+0.915)#50 | 1.28%(+0.762)#1,461 |
| 51. | Highland | 2.00% | 1.12%(+0.874)#51 | 1.28%(+0.721)#1,494 |
| 52. | Elk Grove Village | 1.98% | 1.12%(+0.853)#52 | 1.28%(+0.700)#1,515 |
| 53. | Pontoosuc | 1.92% | 1.12%(+0.800)#53 | 1.28%(+0.647)#1,562 |
| 54. | Chicago | 1.89% | 1.12%(+0.765)#54 | 1.28%(+0.612)#1,587 |
| 55. | Mason | 1.89% | 1.12%(+0.764)#55 | 1.28%(+0.611)#1,590 |
| 56. | Hamilton | 1.86% | 1.12%(+0.737)#56 | 1.28%(+0.584)#1,610 |
| 57. | Carbondale | 1.83% | 1.12%(+0.706)#57 | 1.28%(+0.553)#1,639 |
| 58. | Streamwood | 1.83% | 1.12%(+0.703)#58 | 1.28%(+0.550)#1,646 |
| 59. | Lincolnwood | 1.82% | 1.12%(+0.694)#59 | 1.28%(+0.541)#1,655 |
| 60. | Dekalb | 1.77% | 1.12%(+0.649)#60 | 1.28%(+0.496)#1,694 |
| 61. | Lewistown | 1.75% | 1.12%(+0.632)#61 | 1.28%(+0.479)#1,709 |
| 62. | West Dundee | 1.71% | 1.12%(+0.585)#62 | 1.28%(+0.432)#1,766 |
| 63. | Darien | 1.70% | 1.12%(+0.576)#63 | 1.28%(+0.423)#1,771 |
| 64. | Downers Grove | 1.66% | 1.12%(+0.533)#64 | 1.28%(+0.380)#1,829 |
| 65. | Riverwoods | 1.62% | 1.12%(+0.499)#65 | 1.28%(+0.346)#1,882 |
| 66. | Bloomingdale | 1.55% | 1.12%(+0.428)#66 | 1.28%(+0.275)#1,952 |
| 67. | St Joseph | 1.53% | 1.12%(+0.404)#67 | 1.28%(+0.251)#1,981 |
| 68. | Woodridge | 1.50% | 1.12%(+0.379)#68 | 1.28%(+0.226)#2,006 |
| 69. | Mettawa | 1.50% | 1.12%(+0.375)#69 | 1.28%(+0.222)#2,013 |
| 70. | Mundelein | 1.36% | 1.12%(+0.239)#70 | 1.28%(+0.086)#2,230 |
| 71. | Deerfield | 1.35% | 1.12%(+0.228)#71 | 1.28%(+0.075)#2,245 |
| 72. | South Elgin | 1.33% | 1.12%(+0.211)#72 | 1.28%(+0.058)#2,277 |
| 73. | Lombard | 1.33% | 1.12%(+0.210)#73 | 1.28%(+0.057)#2,281 |
| 74. | Lawrenceville | 1.33% | 1.12%(+0.207)#74 | 1.28%(+0.054)#2,285 |
| 75. | Crainville | 1.32% | 1.12%(+0.198)#75 | 1.28%(+0.045)#2,295 |
| 76. | Cambria | 1.30% | 1.12%(+0.177)#76 | 1.28%(+0.024)#2,339 |
| 77. | Bunker Hill | 1.29% | 1.12%(+0.169)#77 | 1.28%(+0.017)#2,352 |
| 78. | Deer Park | 1.27% | 1.12%(+0.150)#78 | 1.28%(-0.003)#2,396 |
| 79. | Wheaton | 1.26% | 1.12%(+0.133)#79 | 1.28%(-0.020)#2,419 |
| 80. | Rockton | 1.25% | 1.12%(+0.127)#80 | 1.28%(-0.026)#2,427 |
| 81. | Bolingbrook | 1.25% | 1.12%(+0.125)#81 | 1.28%(-0.028)#2,429 |
| 82. | Spaulding | 1.24% | 1.12%(+0.121)#82 | 1.28%(-0.032)#2,436 |
| 83. | Hainesville | 1.24% | 1.12%(+0.118)#83 | 1.28%(-0.035)#2,441 |
| 84. | Gurnee | 1.24% | 1.12%(+0.115)#84 | 1.28%(-0.038)#2,451 |
| 85. | Rapids City | 1.22% | 1.12%(+0.097)#85 | 1.28%(-0.056)#2,477 |
| 86. | Lake Petersburg | 1.18% | 1.12%(+0.057)#86 | 1.28%(-0.096)#2,550 |
| 87. | Staunton | 1.16% | 1.12%(+0.035)#87 | 1.28%(-0.118)#2,600 |
| 88. | Geneva | 1.15% | 1.12%(+0.027)#88 | 1.28%(-0.126)#2,620 |
| 89. | River Forest | 1.14% | 1.12%(+0.018)#89 | 1.28%(-0.135)#2,635 |
| 90. | Peoria | 1.13% | 1.12%(+0.009)#90 | 1.28%(-0.143)#2,645 |
| 91. | South Wilmington | 1.12% | 1.12%(-0.001)#91 | 1.28%(-0.154)#2,663 |
| 92. | Morton | 1.10% | 1.12%(-0.020)#92 | 1.28%(-0.173)#2,692 |
| 93. | Hammond | 1.10% | 1.12%(-0.024)#93 | 1.28%(-0.177)#2,695 |
| 94. | Bloomington | 1.09% | 1.12%(-0.029)#94 | 1.28%(-0.182)#2,713 |
| 95. | Port Barrington | 1.09% | 1.12%(-0.031)#95 | 1.28%(-0.184)#2,718 |
| 96. | Willow Lake | 1.08% | 1.12%(-0.044)#96 | 1.28%(-0.197)#2,754 |
| 97. | Maryville | 1.07% | 1.12%(-0.052)#97 | 1.28%(-0.205)#2,775 |
| 98. | Carmi | 1.05% | 1.12%(-0.072)#98 | 1.28%(-0.225)#2,813 |
| 99. | Swansea | 1.03% | 1.12%(-0.088)#99 | 1.28%(-0.241)#2,855 |
| 100. | Prospect Heights | 1.02% | 1.12%(-0.101)#100 | 1.28%(-0.254)#2,894 |
Common Questions
What are the Top 10 Cities with the Highest Percentage of Immigrants from Eastern Asia in Illinois?
Top 10 Cities with the Highest Percentage of Immigrants from Eastern Asia in Illinois are:
#1
9.18%
#2
8.84%
#3
6.70%
#4
6.61%
#5
6.55%
#6
6.34%
#7
6.06%
#8
5.90%
#9
5.86%
#10
5.57%
What city has the Highest Percentage of Immigrants from Eastern Asia in Illinois?
Lincolnshire has the Highest Percentage of Immigrants from Eastern Asia in Illinois with 9.18%.
What is the Percentage of Immigrants from Eastern Asia in the State of Illinois?
Percentage of Immigrants from Eastern Asia in Illinois is 1.12%.
What is the Percentage of Immigrants from Eastern Asia in the United States?
Percentage of Immigrants from Eastern Asia in the United States is 1.28%.