Cities with the Highest Percentage of Immigrants from South Eastern Asia in Texas
RELATED REPORTS & OPTIONS
South Eastern Asia
Texas
Compare Cities
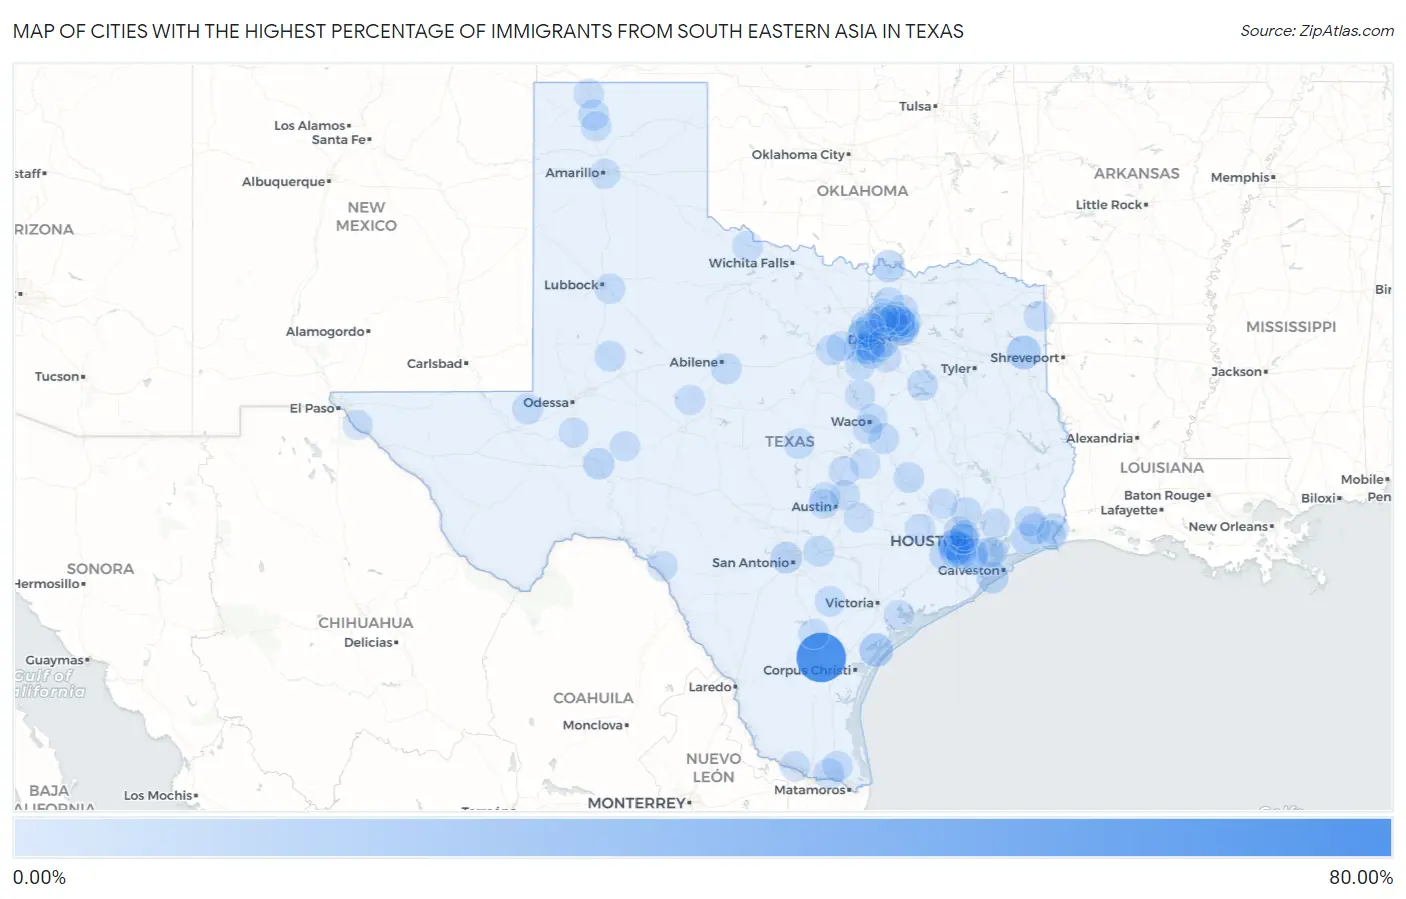
Map of Cities with the Highest Percentage of Immigrants from South Eastern Asia in Texas
0.00%
80.00%
Cities with the Highest Percentage of Immigrants from South Eastern Asia in Texas
| City | South Eastern Asia | vs State | vs National | |
| 1. | Westdale | 63.10% | 1.21%(+61.9)#-1 | 1.30%(+61.8)#0 |
| 2. | Nesbitt | 13.33% | 1.21%(+12.1)#0 | 1.30%(+12.0)#1 |
| 3. | Fulton | 13.22% | 1.21%(+12.0)#1 | 1.30%(+11.9)#2 |
| 4. | Sachse | 9.89% | 1.21%(+8.68)#2 | 1.30%(+8.60)#3 |
| 5. | Four Corners | 8.14% | 1.21%(+6.93)#3 | 1.30%(+6.85)#4 |
| 6. | Stafford | 7.84% | 1.21%(+6.63)#4 | 1.30%(+6.55)#47 |
| 7. | Sherwood Shores | 7.84% | 1.21%(+6.63)#5 | 1.30%(+6.54)#48 |
| 8. | Jamaica Beach | 6.62% | 1.21%(+5.41)#6 | 1.30%(+5.32)#49 |
| 9. | Leon Valley | 6.46% | 1.21%(+5.25)#7 | 1.30%(+5.16)#50 |
| 10. | Iraan | 6.06% | 1.21%(+4.84)#8 | 1.30%(+4.76)#51 |
| 11. | Meadows Place | 5.74% | 1.21%(+4.53)#9 | 1.30%(+4.45)#52 |
| 12. | Garland | 5.72% | 1.21%(+4.51)#16 | 1.30%(+4.42)#371 |
| 13. | Haltom City | 5.71% | 1.21%(+4.50)#17 | 1.30%(+4.42)#372 |
| 14. | Manvel | 5.63% | 1.21%(+4.42)#18 | 1.30%(+4.33)#373 |
| 15. | Murphy | 5.34% | 1.21%(+4.12)#19 | 1.30%(+4.04)#374 |
| 16. | Sugar Land | 5.31% | 1.21%(+4.10)#20 | 1.30%(+4.01)#375 |
| 17. | Stowell | 5.26% | 1.21%(+4.04)#21 | 1.30%(+3.96)#376 |
| 18. | Rosenberg | 5.11% | 1.21%(+3.90)#22 | 1.30%(+3.82)#377 |
| 19. | Mission Bend | 5.04% | 1.21%(+3.83)#23 | 1.30%(+3.75)#378 |
| 20. | Hedwig Village | 5.00% | 1.21%(+3.79)#24 | 1.30%(+3.70)#379 |
| 21. | Pearland | 4.84% | 1.21%(+3.62)#25 | 1.30%(+3.54)#380 |
| 22. | Fannett | 4.74% | 1.21%(+3.53)#26 | 1.30%(+3.44)#381 |
| 23. | Cactus | 4.58% | 1.21%(+3.37)#27 | 1.30%(+3.29)#382 |
| 24. | Goodlow | 4.51% | 1.21%(+3.30)#28 | 1.30%(+3.21)#383 |
| 25. | Bixby | 4.45% | 1.21%(+3.24)#29 | 1.30%(+3.15)#384 |
| 26. | Potosi | 4.40% | 1.21%(+3.19)#30 | 1.30%(+3.10)#385 |
| 27. | Wink | 4.40% | 1.21%(+3.18)#31 | 1.30%(+3.10)#386 |
| 28. | Mcqueeney | 4.22% | 1.21%(+3.00)#32 | 1.30%(+2.92)#387 |
| 29. | Lake Bryan | 3.96% | 1.21%(+2.75)#33 | 1.30%(+2.67)#388 |
| 30. | Ackerly | 3.88% | 1.21%(+2.66)#34 | 1.30%(+2.58)#389 |
| 31. | Groves | 3.85% | 1.21%(+2.64)#35 | 1.30%(+2.56)#390 |
| 32. | El Lago | 3.82% | 1.21%(+2.60)#36 | 1.30%(+2.52)#391 |
| 33. | Edgecliff Village | 3.74% | 1.21%(+2.53)#37 | 1.30%(+2.45)#392 |
| 34. | Marlin | 3.71% | 1.21%(+2.49)#38 | 1.30%(+2.41)#393 |
| 35. | Shenandoah | 3.65% | 1.21%(+2.44)#39 | 1.30%(+2.35)#394 |
| 36. | Rowlett | 3.46% | 1.21%(+2.24)#40 | 1.30%(+2.16)#395 |
| 37. | Dalworthington Gardens | 3.45% | 1.21%(+2.23)#41 | 1.30%(+2.15)#396 |
| 38. | Westlake | 3.38% | 1.21%(+2.17)#42 | 1.30%(+2.09)#397 |
| 39. | Arlington | 3.28% | 1.21%(+2.07)#43 | 1.30%(+1.99)#398 |
| 40. | Lometa | 3.27% | 1.21%(+2.06)#44 | 1.30%(+1.97)#399 |
| 41. | Kennedale | 3.17% | 1.21%(+1.95)#45 | 1.30%(+1.87)#400 |
| 42. | Kenedy | 3.14% | 1.21%(+1.93)#46 | 1.30%(+1.85)#401 |
| 43. | Combes | 3.09% | 1.21%(+1.88)#47 | 1.30%(+1.79)#402 |
| 44. | Hackberry | 3.07% | 1.21%(+1.86)#48 | 1.30%(+1.78)#403 |
| 45. | Buffalo Springs | 3.02% | 1.21%(+1.81)#49 | 1.30%(+1.72)#404 |
| 46. | Wylie | 2.92% | 1.21%(+1.71)#50 | 1.30%(+1.63)#405 |
| 47. | Western Lake | 2.90% | 1.21%(+1.69)#51 | 1.30%(+1.60)#406 |
| 48. | Grand Prairie | 2.88% | 1.21%(+1.67)#52 | 1.30%(+1.58)#407 |
| 49. | Missouri City | 2.87% | 1.21%(+1.66)#53 | 1.30%(+1.57)#408 |
| 50. | Watauga | 2.83% | 1.21%(+1.62)#54 | 1.30%(+1.54)#409 |
| 51. | New Hope | 2.82% | 1.21%(+1.60)#55 | 1.30%(+1.52)#410 |
| 52. | Richardson | 2.81% | 1.21%(+1.59)#56 | 1.30%(+1.51)#411 |
| 53. | Hudson Bend | 2.81% | 1.21%(+1.59)#57 | 1.30%(+1.51)#412 |
| 54. | Port Arthur | 2.74% | 1.21%(+1.53)#58 | 1.30%(+1.44)#413 |
| 55. | Keene | 2.71% | 1.21%(+1.50)#59 | 1.30%(+1.42)#414 |
| 56. | Celina | 2.63% | 1.21%(+1.42)#60 | 1.30%(+1.34)#415 |
| 57. | Dayton | 2.61% | 1.21%(+1.40)#61 | 1.30%(+1.32)#416 |
| 58. | Lewisville | 2.60% | 1.21%(+1.38)#62 | 1.30%(+1.30)#417 |
| 59. | Santa Rita Ranch | 2.57% | 1.21%(+1.36)#63 | 1.30%(+1.28)#418 |
| 60. | La Joya | 2.54% | 1.21%(+1.33)#64 | 1.30%(+1.25)#419 |
| 61. | Dumas | 2.53% | 1.21%(+1.32)#65 | 1.30%(+1.24)#420 |
| 62. | George West | 2.48% | 1.21%(+1.27)#66 | 1.30%(+1.19)#421 |
| 63. | Carrollton | 2.48% | 1.21%(+1.27)#67 | 1.30%(+1.18)#422 |
| 64. | Big Lake | 2.38% | 1.21%(+1.17)#68 | 1.30%(+1.09)#423 |
| 65. | Sonterra | 2.33% | 1.21%(+1.11)#69 | 1.30%(+1.03)#424 |
| 66. | Euless | 2.29% | 1.21%(+1.08)#70 | 1.30%(+0.995)#425 |
| 67. | Rogers | 2.29% | 1.21%(+1.07)#71 | 1.30%(+0.989)#426 |
| 68. | Parker | 2.28% | 1.21%(+1.07)#72 | 1.30%(+0.983)#427 |
| 69. | Allen | 2.27% | 1.21%(+1.06)#73 | 1.30%(+0.974)#428 |
| 70. | China | 2.25% | 1.21%(+1.04)#74 | 1.30%(+0.954)#429 |
| 71. | Spring Valley Village | 2.23% | 1.21%(+1.01)#75 | 1.30%(+0.930)#430 |
| 72. | Whitney | 2.23% | 1.21%(+1.01)#76 | 1.30%(+0.930)#431 |
| 73. | Vernon | 2.22% | 1.21%(+1.00)#77 | 1.30%(+0.920)#432 |
| 74. | Laughlin Afb | 2.14% | 1.21%(+0.932)#78 | 1.30%(+0.848)#433 |
| 75. | Bronte | 2.12% | 1.21%(+0.910)#79 | 1.30%(+0.827)#434 |
| 76. | Plano | 2.12% | 1.21%(+0.908)#80 | 1.30%(+0.824)#435 |
| 77. | Port Lavaca | 2.11% | 1.21%(+0.900)#81 | 1.30%(+0.817)#436 |
| 78. | Crane | 2.11% | 1.21%(+0.899)#82 | 1.30%(+0.816)#437 |
| 79. | Fabens | 2.11% | 1.21%(+0.899)#83 | 1.30%(+0.816)#438 |
| 80. | Amarillo | 2.11% | 1.21%(+0.899)#84 | 1.30%(+0.815)#439 |
| 81. | Annetta South | 2.05% | 1.21%(+0.838)#85 | 1.30%(+0.755)#440 |
| 82. | Stratford | 2.00% | 1.21%(+0.785)#86 | 1.30%(+0.702)#441 |
| 83. | Seabrook | 1.99% | 1.21%(+0.778)#87 | 1.30%(+0.695)#442 |
| 84. | Bellmead | 1.98% | 1.21%(+0.762)#88 | 1.30%(+0.679)#443 |
| 85. | Jersey Village | 1.96% | 1.21%(+0.745)#89 | 1.30%(+0.662)#444 |
| 86. | Sienna | 1.95% | 1.21%(+0.739)#90 | 1.30%(+0.656)#445 |
| 87. | Hewitt | 1.95% | 1.21%(+0.739)#91 | 1.30%(+0.656)#446 |
| 88. | Bellville | 1.90% | 1.21%(+0.692)#92 | 1.30%(+0.608)#447 |
| 89. | The Colony | 1.90% | 1.21%(+0.691)#93 | 1.30%(+0.608)#448 |
| 90. | Plantersville | 1.89% | 1.21%(+0.678)#94 | 1.30%(+0.595)#449 |
| 91. | Atlanta | 1.89% | 1.21%(+0.676)#95 | 1.30%(+0.593)#450 |
| 92. | Oak Leaf | 1.88% | 1.21%(+0.662)#96 | 1.30%(+0.579)#451 |
| 93. | Mansfield | 1.87% | 1.21%(+0.660)#97 | 1.30%(+0.577)#452 |
| 94. | Pflugerville | 1.87% | 1.21%(+0.657)#98 | 1.30%(+0.574)#453 |
| 95. | Bee Cave | 1.87% | 1.21%(+0.657)#99 | 1.30%(+0.573)#454 |
| 96. | Southlake | 1.86% | 1.21%(+0.645)#100 | 1.30%(+0.562)#455 |
| 97. | Stockton Bend | 1.86% | 1.21%(+0.645)#101 | 1.30%(+0.562)#456 |
| 98. | Houston | 1.85% | 1.21%(+0.633)#102 | 1.30%(+0.550)#457 |
| 99. | Bastrop | 1.82% | 1.21%(+0.605)#103 | 1.30%(+0.522)#458 |
| 100. | Cockrell Hill | 1.79% | 1.21%(+0.577)#104 | 1.30%(+0.494)#459 |
Common Questions
What are the Top 10 Cities with the Highest Percentage of Immigrants from South Eastern Asia in Texas?
Top 10 Cities with the Highest Percentage of Immigrants from South Eastern Asia in Texas are:
#1
63.10%
#2
13.33%
#3
13.22%
#4
9.89%
#5
8.14%
#6
7.84%
#7
7.84%
#8
6.62%
#9
6.46%
#10
6.06%
What city has the Highest Percentage of Immigrants from South Eastern Asia in Texas?
Westdale has the Highest Percentage of Immigrants from South Eastern Asia in Texas with 63.10%.
What is the Percentage of Immigrants from South Eastern Asia in the State of Texas?
Percentage of Immigrants from South Eastern Asia in Texas is 1.21%.
What is the Percentage of Immigrants from South Eastern Asia in the United States?
Percentage of Immigrants from South Eastern Asia in the United States is 1.30%.