Cities with the Highest Percentage of Immigrants from Ethiopia in Illinois
RELATED REPORTS & OPTIONS
Ethiopia
Illinois
Compare Cities
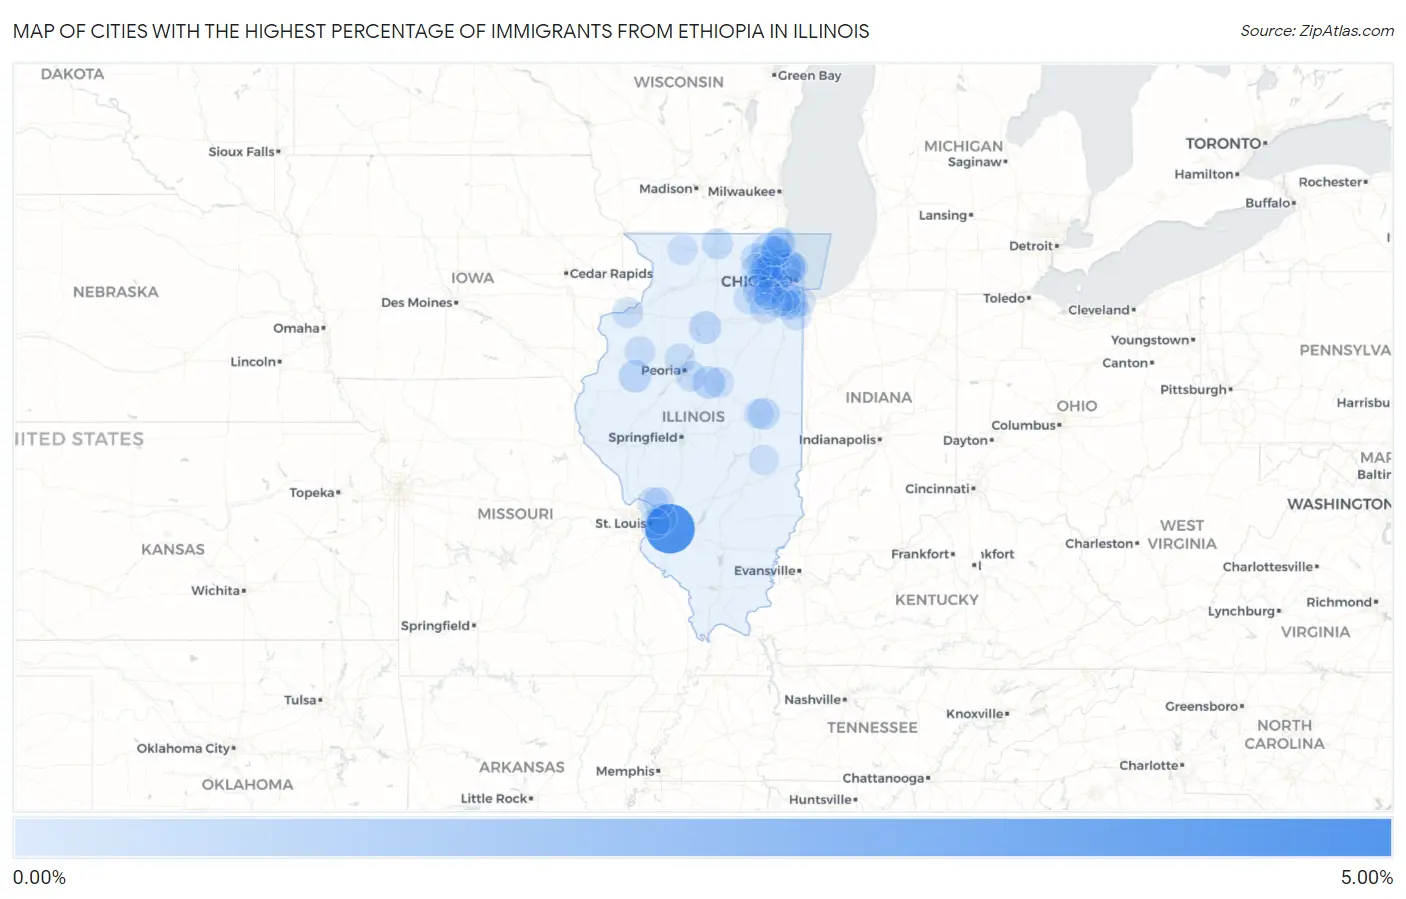
Map of Cities with the Highest Percentage of Immigrants from Ethiopia in Illinois
0.00%
5.00%
Cities with the Highest Percentage of Immigrants from Ethiopia in Illinois
| City | Ethiopia | vs State | vs National | |
| 1. | Scott Afb | 4.95% | 0.037%(+4.91)#-1 | 0.083%(+4.86)#0 |
| 2. | Golf | 1.10% | 0.037%(+1.06)#0 | 0.083%(+1.02)#1 |
| 3. | Granville | 0.61% | 0.037%(+0.573)#1 | 0.083%(+0.527)#2 |
| 4. | Danvers | 0.58% | 0.037%(+0.540)#2 | 0.083%(+0.494)#3 |
| 5. | Prairie City | 0.57% | 0.037%(+0.536)#3 | 0.083%(+0.490)#4 |
| 6. | Barrington Hills | 0.57% | 0.037%(+0.528)#4 | 0.083%(+0.482)#5 |
| 7. | Urbana | 0.44% | 0.037%(+0.401)#5 | 0.083%(+0.356)#6 |
| 8. | Wauconda | 0.43% | 0.037%(+0.397)#6 | 0.083%(+0.351)#7 |
| 9. | Algonquin | 0.24% | 0.037%(+0.200)#7 | 0.083%(+0.154)#8 |
| 10. | Machesney Park | 0.22% | 0.037%(+0.186)#8 | 0.083%(+0.140)#9 |
| 11. | Skokie | 0.18% | 0.037%(+0.141)#51 | 0.083%(+0.096)#482 |
| 12. | Evanston | 0.15% | 0.037%(+0.117)#52 | 0.083%(+0.071)#483 |
| 13. | Rock Island | 0.15% | 0.037%(+0.110)#53 | 0.083%(+0.064)#484 |
| 14. | Collinsville | 0.14% | 0.037%(+0.107)#54 | 0.083%(+0.061)#485 |
| 15. | Dunlap | 0.14% | 0.037%(+0.104)#55 | 0.083%(+0.058)#486 |
| 16. | Wheaton | 0.14% | 0.037%(+0.102)#66 | 0.083%(+0.057)#887 |
| 17. | Rolling Meadows | 0.14% | 0.037%(+0.100)#67 | 0.083%(+0.054)#888 |
| 18. | Alton | 0.14% | 0.037%(+0.099)#68 | 0.083%(+0.053)#889 |
| 19. | Morton | 0.13% | 0.037%(+0.095)#69 | 0.083%(+0.049)#890 |
| 20. | Robbins | 0.12% | 0.037%(+0.087)#70 | 0.083%(+0.042)#891 |
| 21. | Normal | 0.11% | 0.037%(+0.076)#71 | 0.083%(+0.030)#892 |
| 22. | Bethalto | 0.11% | 0.037%(+0.070)#72 | 0.083%(+0.025)#893 |
| 23. | Hanover Park | 0.11% | 0.037%(+0.070)#73 | 0.083%(+0.024)#894 |
| 24. | Crete | 0.11% | 0.037%(+0.069)#74 | 0.083%(+0.024)#895 |
| 25. | Chicago | 0.10% | 0.037%(+0.067)#75 | 0.083%(+0.021)#896 |
| 26. | Vernon Hills | 0.097% | 0.037%(+0.060)#76 | 0.083%(+0.014)#897 |
| 27. | Yorkville | 0.094% | 0.037%(+0.057)#77 | 0.083%(+0.011)#898 |
| 28. | Galesburg | 0.087% | 0.037%(+0.049)#78 | 0.083%(+0.004)#899 |
| 29. | Gurnee | 0.082% | 0.037%(+0.044)#79 | 0.083%(-0.002)#900 |
| 30. | Bartlett | 0.073% | 0.037%(+0.036)#80 | 0.083%(-0.010)#901 |
| 31. | Niles | 0.072% | 0.037%(+0.034)#81 | 0.083%(-0.011)#902 |
| 32. | Downers Grove | 0.070% | 0.037%(+0.033)#82 | 0.083%(-0.013)#903 |
| 33. | Calumet City | 0.064% | 0.037%(+0.027)#83 | 0.083%(-0.019)#904 |
| 34. | Homewood | 0.060% | 0.037%(+0.023)#84 | 0.083%(-0.023)#905 |
| 35. | Libertyville | 0.058% | 0.037%(+0.021)#85 | 0.083%(-0.025)#906 |
| 36. | Orland Park | 0.057% | 0.037%(+0.019)#86 | 0.083%(-0.027)#907 |
| 37. | Carol Stream | 0.053% | 0.037%(+0.016)#87 | 0.083%(-0.030)#908 |
| 38. | Schaumburg | 0.045% | 0.037%(+0.008)#88 | 0.083%(-0.038)#909 |
| 39. | Hoffman Estates | 0.044% | 0.037%(+0.007)#89 | 0.083%(-0.039)#910 |
| 40. | East St Louis | 0.037% | 0.037%(-0.000)#90 | 0.083%(-0.046)#911 |
| 41. | Batavia | 0.034% | 0.037%(-0.003)#91 | 0.083%(-0.049)#912 |
| 42. | Freeport | 0.033% | 0.037%(-0.004)#92 | 0.083%(-0.050)#913 |
| 43. | Plainfield | 0.033% | 0.037%(-0.004)#93 | 0.083%(-0.050)#914 |
| 44. | Lombard | 0.027% | 0.037%(-0.010)#94 | 0.083%(-0.056)#922 |
| 45. | Naperville | 0.023% | 0.037%(-0.014)#95 | 0.083%(-0.060)#923 |
| 46. | Mundelein | 0.022% | 0.037%(-0.015)#96 | 0.083%(-0.061)#924 |
| 47. | Waukegan | 0.020% | 0.037%(-0.017)#97 | 0.083%(-0.063)#925 |
| 48. | Tinley Park | 0.020% | 0.037%(-0.018)#98 | 0.083%(-0.063)#926 |
| 49. | Charleston | 0.017% | 0.037%(-0.021)#99 | 0.083%(-0.066)#927 |
| 50. | Palos Heights | 0.017% | 0.037%(-0.021)#100 | 0.083%(-0.066)#928 |
| 51. | Homer Glen | 0.012% | 0.037%(-0.025)#101 | 0.083%(-0.071)#929 |
| 52. | Champaign | 0.010% | 0.037%(-0.027)#102 | 0.083%(-0.073)#930 |
| 53. | Aurora | 0.0099% | 0.037%(-0.028)#103 | 0.083%(-0.073)#931 |
| 54. | Joliet | 0.0093% | 0.037%(-0.028)#104 | 0.083%(-0.074)#932 |
| 55. | Elgin | 0.0026% | 0.037%(-0.035)#105 | 0.083%(-0.081)#933 |
| 56. | Bolingbrook | 0.0014% | 0.037%(-0.036)#106 | 0.083%(-0.082)#934 |
Common Questions
What are the Top 10 Cities with the Highest Percentage of Immigrants from Ethiopia in Illinois?
Top 10 Cities with the Highest Percentage of Immigrants from Ethiopia in Illinois are:
#1
4.95%
#2
1.10%
#3
0.61%
#4
0.58%
#5
0.57%
#6
0.57%
#7
0.44%
#8
0.43%
#9
0.24%
#10
0.22%
What city has the Highest Percentage of Immigrants from Ethiopia in Illinois?
Scott AFB has the Highest Percentage of Immigrants from Ethiopia in Illinois with 4.95%.
What is the Percentage of Immigrants from Ethiopia in the State of Illinois?
Percentage of Immigrants from Ethiopia in Illinois is 0.037%.
What is the Percentage of Immigrants from Ethiopia in the United States?
Percentage of Immigrants from Ethiopia in the United States is 0.083%.