Cities with the Highest Percentage of Immigrants from Central America in Illinois
RELATED REPORTS & OPTIONS
Central America
Illinois
Compare Cities
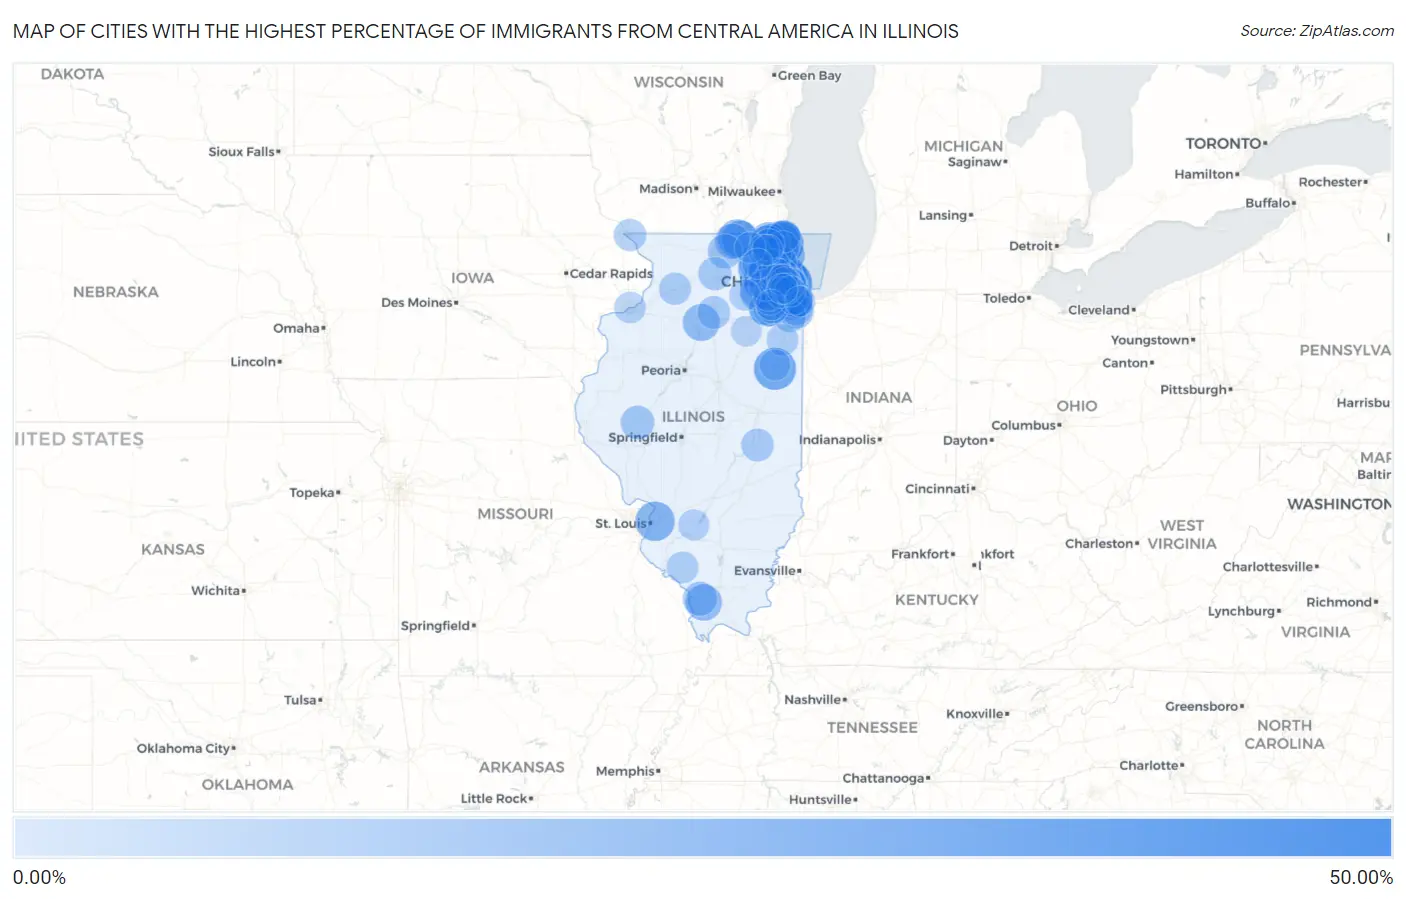
Map of Cities with the Highest Percentage of Immigrants from Central America in Illinois
0.00%
50.00%
Cities with the Highest Percentage of Immigrants from Central America in Illinois
| City | Central America | vs State | vs National | |
| 1. | Stone Park | 41.17% | 5.34%(+35.8)#-1 | 4.37%(+36.8)#0 |
| 2. | Alden | 36.90% | 5.34%(+31.6)#0 | 4.37%(+32.5)#1 |
| 3. | Cicero | 36.40% | 5.34%(+31.1)#1 | 4.37%(+32.0)#2 |
| 4. | Kings | 35.16% | 5.34%(+29.8)#2 | 4.37%(+30.8)#3 |
| 5. | Summit | 33.95% | 5.34%(+28.6)#3 | 4.37%(+29.6)#4 |
| 6. | Park City | 32.54% | 5.34%(+27.2)#4 | 4.37%(+28.2)#5 |
| 7. | Ridgewood | 29.46% | 5.34%(+24.1)#5 | 4.37%(+25.1)#6 |
| 8. | Melrose Park | 29.29% | 5.34%(+24.0)#6 | 4.37%(+24.9)#7 |
| 9. | Onarga | 27.87% | 5.34%(+22.5)#7 | 4.37%(+23.5)#8 |
| 10. | Northlake | 23.60% | 5.34%(+18.3)#8 | 4.37%(+19.2)#9 |
| 11. | Fairmont City | 22.87% | 5.34%(+17.5)#9 | 4.37%(+18.5)#10 |
| 12. | Posen | 22.82% | 5.34%(+17.5)#10 | 4.37%(+18.5)#11 |
| 13. | Stickney | 22.74% | 5.34%(+17.4)#11 | 4.37%(+18.4)#12 |
| 14. | West Chicago | 22.43% | 5.34%(+17.1)#12 | 4.37%(+18.1)#13 |
| 15. | Rosemont | 22.08% | 5.34%(+16.7)#13 | 4.37%(+17.7)#14 |
| 16. | Chemung | 21.76% | 5.34%(+16.4)#14 | 4.37%(+17.4)#15 |
| 17. | Waukegan | 21.40% | 5.34%(+16.1)#15 | 4.37%(+17.0)#16 |
| 18. | Forest Lake | 21.06% | 5.34%(+15.7)#16 | 4.37%(+16.7)#17 |
| 19. | Carpentersville | 20.91% | 5.34%(+15.6)#17 | 4.37%(+16.5)#18 |
| 20. | Round Lake Heights | 20.17% | 5.34%(+14.8)#18 | 4.37%(+15.8)#19 |
| 21. | Round Lake Park | 19.85% | 5.34%(+14.5)#19 | 4.37%(+15.5)#20 |
| 22. | Franklin Park | 19.73% | 5.34%(+14.4)#20 | 4.37%(+15.4)#21 |
| 23. | Blue Island | 19.46% | 5.34%(+14.1)#21 | 4.37%(+15.1)#22 |
| 24. | Highwood | 19.04% | 5.34%(+13.7)#22 | 4.37%(+14.7)#23 |
| 25. | Round Lake Beach | 18.92% | 5.34%(+13.6)#23 | 4.37%(+14.5)#24 |
| 26. | Berwyn | 18.83% | 5.34%(+13.5)#24 | 4.37%(+14.5)#25 |
| 27. | De Pue | 18.41% | 5.34%(+13.1)#25 | 4.37%(+14.0)#26 |
| 28. | Elgin | 17.88% | 5.34%(+12.5)#26 | 4.37%(+13.5)#27 |
| 29. | Harvard | 17.69% | 5.34%(+12.4)#27 | 4.37%(+13.3)#28 |
| 30. | Cobden | 17.50% | 5.34%(+12.2)#28 | 4.37%(+13.1)#29 |
| 31. | Rockdale | 16.03% | 5.34%(+10.7)#29 | 4.37%(+11.7)#30 |
| 32. | Lyons | 15.78% | 5.34%(+10.4)#30 | 4.37%(+11.4)#31 |
| 33. | Beach Park | 15.56% | 5.34%(+10.2)#31 | 4.37%(+11.2)#32 |
| 34. | Bensenville | 15.55% | 5.34%(+10.2)#32 | 4.37%(+11.2)#33 |
| 35. | Addison | 15.50% | 5.34%(+10.2)#33 | 4.37%(+11.1)#34 |
| 36. | Hanover Park | 15.39% | 5.34%(+10.1)#34 | 4.37%(+11.0)#35 |
| 37. | Capron | 15.26% | 5.34%(+9.92)#35 | 4.37%(+10.9)#36 |
| 38. | Wheeling | 15.24% | 5.34%(+9.89)#36 | 4.37%(+10.9)#37 |
| 39. | Aurora | 14.59% | 5.34%(+9.25)#37 | 4.37%(+10.2)#38 |
| 40. | South Chicago Heights | 14.55% | 5.34%(+9.21)#38 | 4.37%(+10.2)#39 |
| 41. | Harvey | 14.47% | 5.34%(+9.13)#39 | 4.37%(+10.1)#40 |
| 42. | Prospect Heights | 14.12% | 5.34%(+8.78)#40 | 4.37%(+9.75)#41 |
| 43. | Burbank | 14.11% | 5.34%(+8.77)#41 | 4.37%(+9.74)#42 |
| 44. | Belvidere | 13.87% | 5.34%(+8.53)#42 | 4.37%(+9.50)#43 |
| 45. | Alto Pass | 13.65% | 5.34%(+8.31)#43 | 4.37%(+9.28)#44 |
| 46. | Long Lake | 13.34% | 5.34%(+8.00)#44 | 4.37%(+8.97)#45 |
| 47. | Streamwood | 13.30% | 5.34%(+7.96)#45 | 4.37%(+8.93)#46 |
| 48. | Beardstown | 12.75% | 5.34%(+7.41)#46 | 4.37%(+8.38)#47 |
| 49. | Hillside | 12.70% | 5.34%(+7.36)#47 | 4.37%(+8.33)#48 |
| 50. | Mundelein | 12.63% | 5.34%(+7.29)#48 | 4.37%(+8.26)#49 |
| 51. | Hodgkins | 12.25% | 5.34%(+6.91)#49 | 4.37%(+7.88)#50 |
| 52. | North Chicago | 11.86% | 5.34%(+6.52)#50 | 4.37%(+7.49)#51 |
| 53. | Hillcrest | 11.75% | 5.34%(+6.41)#51 | 4.37%(+7.38)#52 |
| 54. | Chicago Heights | 11.64% | 5.34%(+6.30)#52 | 4.37%(+7.27)#53 |
| 55. | Preston Heights | 11.52% | 5.34%(+6.18)#53 | 4.37%(+7.15)#54 |
| 56. | Midlothian | 11.42% | 5.34%(+6.08)#54 | 4.37%(+7.05)#55 |
| 57. | Mccook | 11.37% | 5.34%(+6.03)#55 | 4.37%(+7.00)#56 |
| 58. | Troy Grove | 11.15% | 5.34%(+5.81)#56 | 4.37%(+6.78)#57 |
| 59. | Arcola | 11.04% | 5.34%(+5.70)#57 | 4.37%(+6.67)#58 |
| 60. | Berkeley | 11.04% | 5.34%(+5.69)#58 | 4.37%(+6.67)#59 |
| 61. | Zion | 10.98% | 5.34%(+5.64)#59 | 4.37%(+6.61)#60 |
| 62. | Maywood | 10.90% | 5.34%(+5.55)#60 | 4.37%(+6.53)#61 |
| 63. | Boulder Hill | 10.82% | 5.34%(+5.48)#61 | 4.37%(+6.45)#62 |
| 64. | Glendale Heights | 10.74% | 5.34%(+5.40)#62 | 4.37%(+6.37)#63 |
| 65. | Joliet | 10.63% | 5.34%(+5.29)#63 | 4.37%(+6.26)#280 |
| 66. | Phoenix | 10.56% | 5.34%(+5.22)#64 | 4.37%(+6.19)#281 |
| 67. | Menominee | 10.39% | 5.34%(+5.05)#65 | 4.37%(+6.02)#282 |
| 68. | Sunnyland | 10.16% | 5.34%(+4.81)#66 | 4.37%(+5.79)#283 |
| 69. | Como | 9.98% | 5.34%(+4.64)#67 | 4.37%(+5.61)#284 |
| 70. | Monee | 9.96% | 5.34%(+4.62)#68 | 4.37%(+5.59)#285 |
| 71. | Schiller Park | 9.76% | 5.34%(+4.42)#69 | 4.37%(+5.39)#286 |
| 72. | Percy | 9.67% | 5.34%(+4.32)#70 | 4.37%(+5.30)#287 |
| 73. | Ingalls Park | 9.64% | 5.34%(+4.30)#71 | 4.37%(+5.27)#288 |
| 74. | Romeoville | 9.48% | 5.34%(+4.13)#72 | 4.37%(+5.11)#289 |
| 75. | Rolling Meadows | 9.45% | 5.34%(+4.10)#73 | 4.37%(+5.08)#290 |
| 76. | Kankakee | 9.38% | 5.34%(+4.04)#74 | 4.37%(+5.01)#291 |
| 77. | Round Lake | 9.35% | 5.34%(+4.01)#75 | 4.37%(+4.98)#292 |
| 78. | Bolingbrook | 9.21% | 5.34%(+3.86)#76 | 4.37%(+4.84)#293 |
| 79. | Dixmoor | 9.18% | 5.34%(+3.84)#77 | 4.37%(+4.81)#294 |
| 80. | Rock Island Arsenal | 9.07% | 5.34%(+3.73)#78 | 4.37%(+4.70)#295 |
| 81. | Warrenville | 8.91% | 5.34%(+3.57)#79 | 4.37%(+4.54)#296 |
| 82. | Chicago | 8.83% | 5.34%(+3.49)#80 | 4.37%(+4.46)#369 |
| 83. | Wood Dale | 8.52% | 5.34%(+3.18)#81 | 4.37%(+4.15)#370 |
| 84. | Plano | 8.44% | 5.34%(+3.10)#82 | 4.37%(+4.07)#371 |
| 85. | Gilman | 8.43% | 5.34%(+3.09)#83 | 4.37%(+4.06)#372 |
| 86. | Villa Park | 8.32% | 5.34%(+2.98)#84 | 4.37%(+3.95)#373 |
| 87. | Beckemeyer | 8.25% | 5.34%(+2.91)#85 | 4.37%(+3.88)#374 |
| 88. | Island Lake | 7.95% | 5.34%(+2.61)#86 | 4.37%(+3.58)#375 |
| 89. | Woodstock | 7.85% | 5.34%(+2.51)#87 | 4.37%(+3.48)#376 |
| 90. | North Riverside | 7.80% | 5.34%(+2.46)#88 | 4.37%(+3.43)#377 |
| 91. | Willow Springs | 7.74% | 5.34%(+2.40)#89 | 4.37%(+3.37)#378 |
| 92. | Bedford Park | 7.59% | 5.34%(+2.25)#90 | 4.37%(+3.22)#379 |
| 93. | Bellwood | 7.55% | 5.34%(+2.21)#91 | 4.37%(+3.18)#380 |
| 94. | Verona | 7.34% | 5.34%(+1.99)#92 | 4.37%(+2.97)#381 |
| 95. | Hometown | 7.33% | 5.34%(+1.99)#93 | 4.37%(+2.96)#382 |
| 96. | Fairmont | 7.21% | 5.34%(+1.86)#94 | 4.37%(+2.84)#383 |
| 97. | Wauconda | 7.14% | 5.34%(+1.80)#95 | 4.37%(+2.77)#384 |
| 98. | Calumet City | 7.03% | 5.34%(+1.69)#96 | 4.37%(+2.66)#385 |
| 99. | Sleepy Hollow | 6.99% | 5.34%(+1.65)#97 | 4.37%(+2.62)#386 |
| 100. | Countryside | 6.91% | 5.34%(+1.57)#98 | 4.37%(+2.54)#387 |
Common Questions
What are the Top 10 Cities with the Highest Percentage of Immigrants from Central America in Illinois?
Top 10 Cities with the Highest Percentage of Immigrants from Central America in Illinois are:
#1
41.17%
#2
36.40%
#3
33.95%
#4
32.54%
#5
29.29%
#6
27.87%
#7
23.60%
#8
22.87%
#9
22.82%
#10
22.74%
What city has the Highest Percentage of Immigrants from Central America in Illinois?
Stone Park has the Highest Percentage of Immigrants from Central America in Illinois with 41.17%.
What is the Percentage of Immigrants from Central America in the State of Illinois?
Percentage of Immigrants from Central America in Illinois is 5.34%.
What is the Percentage of Immigrants from Central America in the United States?
Percentage of Immigrants from Central America in the United States is 4.37%.