Cities with the Most Immigrants from Taiwan in Illinois
RELATED REPORTS & OPTIONS
Taiwan
Illinois
Compare Cities
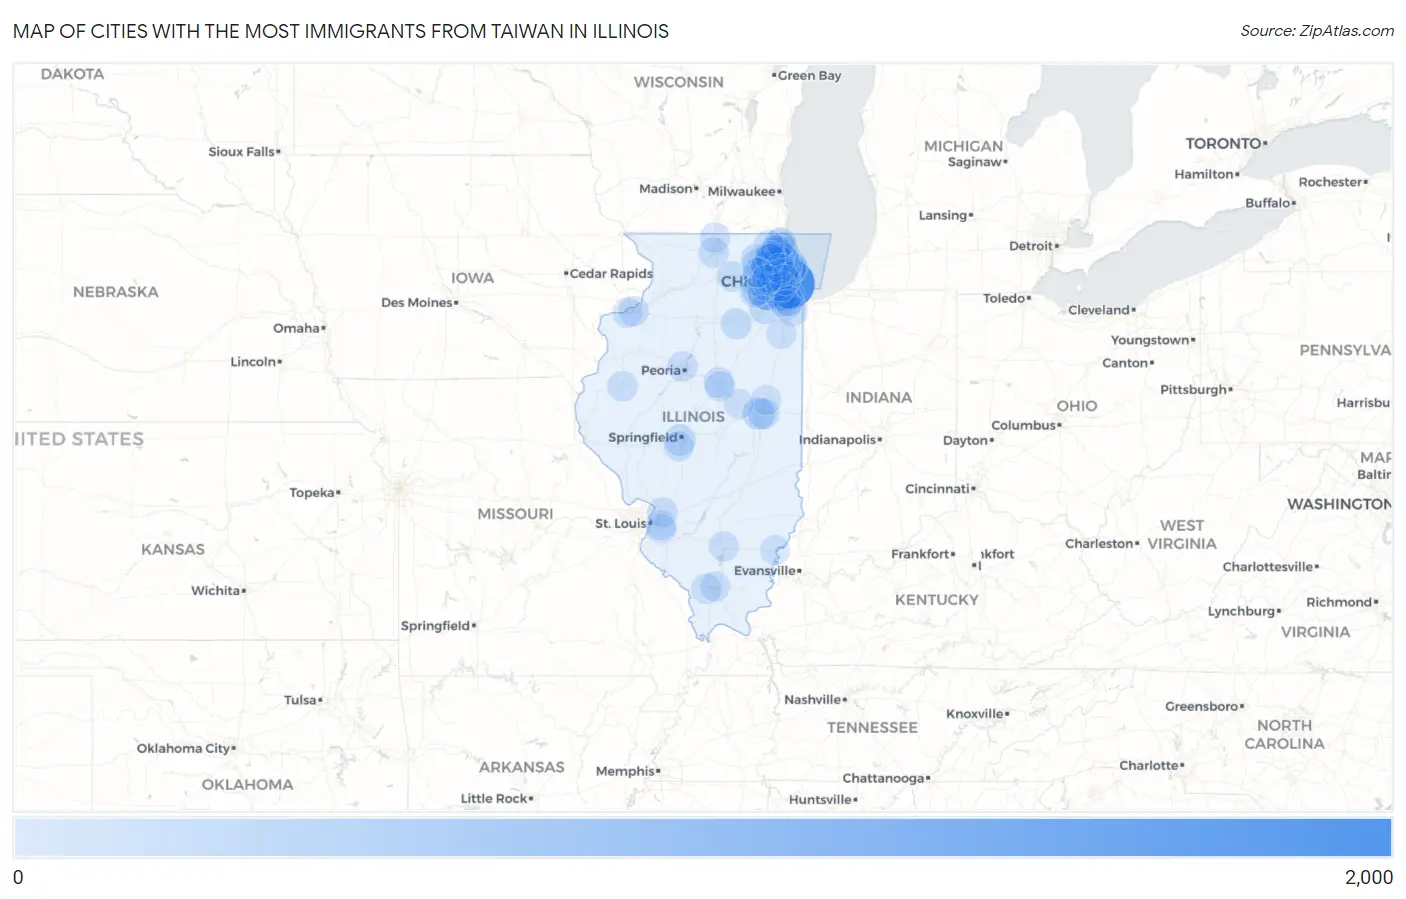
Map of Cities with the Most Immigrants from Taiwan in Illinois
0
2,000
Cities with the Most Immigrants from Taiwan in Illinois
| City | Taiwan | vs State | vs National | |
| 1. | Chicago | 1,846 | 8,235(22.42%)#1 | 376,336(0.49%)#28 |
| 2. | Naperville | 615 | 8,235(7.47%)#2 | 376,336(0.16%)#91 |
| 3. | Wilmette | 319 | 8,235(3.87%)#3 | 376,336(0.08%)#169 |
| 4. | Westmont | 255 | 8,235(3.10%)#4 | 376,336(0.07%)#211 |
| 5. | Glenview | 249 | 8,235(3.02%)#5 | 376,336(0.07%)#216 |
| 6. | Vernon Hills | 246 | 8,235(2.99%)#6 | 376,336(0.07%)#218 |
| 7. | Palatine | 230 | 8,235(2.79%)#7 | 376,336(0.06%)#238 |
| 8. | Champaign | 189 | 8,235(2.30%)#8 | 376,336(0.05%)#284 |
| 9. | Northbrook | 171 | 8,235(2.08%)#9 | 376,336(0.05%)#314 |
| 10. | Hinsdale | 157 | 8,235(1.91%)#10 | 376,336(0.04%)#338 |
| 11. | Bolingbrook | 138 | 8,235(1.68%)#11 | 376,336(0.04%)#381 |
| 12. | Lisle | 134 | 8,235(1.63%)#12 | 376,336(0.04%)#391 |
| 13. | Springfield | 126 | 8,235(1.53%)#13 | 376,336(0.03%)#419 |
| 14. | Arlington Heights | 116 | 8,235(1.41%)#14 | 376,336(0.03%)#443 |
| 15. | Northfield | 116 | 8,235(1.41%)#15 | 376,336(0.03%)#444 |
| 16. | Skokie | 106 | 8,235(1.29%)#16 | 376,336(0.03%)#475 |
| 17. | Oak Brook | 88 | 8,235(1.07%)#17 | 376,336(0.02%)#547 |
| 18. | Marseilles | 88 | 8,235(1.07%)#18 | 376,336(0.02%)#549 |
| 19. | Schaumburg | 87 | 8,235(1.06%)#19 | 376,336(0.02%)#551 |
| 20. | Downers Grove | 87 | 8,235(1.06%)#20 | 376,336(0.02%)#552 |
| 21. | Woodridge | 87 | 8,235(1.06%)#21 | 376,336(0.02%)#553 |
| 22. | Urbana | 85 | 8,235(1.03%)#22 | 376,336(0.02%)#562 |
| 23. | Joliet | 82 | 8,235(1.00%)#23 | 376,336(0.02%)#579 |
| 24. | Darien | 80 | 8,235(0.97%)#24 | 376,336(0.02%)#605 |
| 25. | Wheaton | 75 | 8,235(0.91%)#25 | 376,336(0.02%)#635 |
| 26. | Geneva | 72 | 8,235(0.87%)#26 | 376,336(0.02%)#660 |
| 27. | Bloomingdale | 68 | 8,235(0.83%)#27 | 376,336(0.02%)#697 |
| 28. | Dekalb | 63 | 8,235(0.77%)#28 | 376,336(0.02%)#741 |
| 29. | Lombard | 59 | 8,235(0.72%)#29 | 376,336(0.02%)#776 |
| 30. | Roselle | 59 | 8,235(0.72%)#30 | 376,336(0.02%)#779 |
| 31. | Long Grove | 59 | 8,235(0.72%)#31 | 376,336(0.02%)#785 |
| 32. | Mount Prospect | 58 | 8,235(0.70%)#32 | 376,336(0.02%)#790 |
| 33. | Aurora | 54 | 8,235(0.66%)#33 | 376,336(0.01%)#829 |
| 34. | Normal | 54 | 8,235(0.66%)#34 | 376,336(0.01%)#832 |
| 35. | Mundelein | 47 | 8,235(0.57%)#35 | 376,336(0.01%)#911 |
| 36. | Peoria | 46 | 8,235(0.56%)#36 | 376,336(0.01%)#920 |
| 37. | Evanston | 41 | 8,235(0.50%)#37 | 376,336(0.01%)#985 |
| 38. | Clarendon Hills | 41 | 8,235(0.50%)#38 | 376,336(0.01%)#1,002 |
| 39. | Lake Forest | 40 | 8,235(0.49%)#39 | 376,336(0.01%)#1,016 |
| 40. | Warrenville | 39 | 8,235(0.47%)#40 | 376,336(0.01%)#1,028 |
| 41. | Bartlett | 38 | 8,235(0.46%)#41 | 376,336(0.01%)#1,036 |
| 42. | Streamwood | 38 | 8,235(0.46%)#42 | 376,336(0.01%)#1,037 |
| 43. | Lincolnshire | 37 | 8,235(0.45%)#43 | 376,336(0.01%)#1,073 |
| 44. | Park Ridge | 36 | 8,235(0.44%)#44 | 376,336(0.01%)#1,076 |
| 45. | Macomb | 36 | 8,235(0.44%)#45 | 376,336(0.01%)#1,084 |
| 46. | Barrington Hills | 36 | 8,235(0.44%)#46 | 376,336(0.01%)#1,091 |
| 47. | Algonquin | 33 | 8,235(0.40%)#47 | 376,336(0.01%)#1,146 |
| 48. | Orland Park | 31 | 8,235(0.38%)#48 | 376,336(0.01%)#1,189 |
| 49. | Chatham | 30 | 8,235(0.36%)#49 | 376,336(0.01%)#1,225 |
| 50. | Morton Grove | 29 | 8,235(0.35%)#50 | 376,336(0.01%)#1,243 |
| 51. | Palos Heights | 29 | 8,235(0.35%)#51 | 376,336(0.01%)#1,246 |
| 52. | Rockton | 29 | 8,235(0.35%)#52 | 376,336(0.01%)#1,249 |
| 53. | South Barrington | 29 | 8,235(0.35%)#53 | 376,336(0.01%)#1,252 |
| 54. | Itasca | 27 | 8,235(0.33%)#54 | 376,336(0.01%)#1,307 |
| 55. | Barrington | 25 | 8,235(0.30%)#55 | 376,336(0.01%)#1,360 |
| 56. | West Dundee | 25 | 8,235(0.30%)#56 | 376,336(0.01%)#1,364 |
| 57. | Montgomery | 24 | 8,235(0.29%)#57 | 376,336(0.01%)#1,381 |
| 58. | Carbondale | 23 | 8,235(0.28%)#58 | 376,336(0.01%)#1,408 |
| 59. | Kildeer | 23 | 8,235(0.28%)#59 | 376,336(0.01%)#1,425 |
| 60. | Deerfield | 22 | 8,235(0.27%)#60 | 376,336(0.01%)#1,443 |
| 61. | Rockford | 21 | 8,235(0.26%)#61 | 376,336(0.01%)#1,458 |
| 62. | Buffalo Grove | 21 | 8,235(0.26%)#62 | 376,336(0.01%)#1,470 |
| 63. | Moline | 21 | 8,235(0.26%)#63 | 376,336(0.01%)#1,472 |
| 64. | Glen Carbon | 21 | 8,235(0.26%)#64 | 376,336(0.01%)#1,482 |
| 65. | Elmhurst | 20 | 8,235(0.24%)#65 | 376,336(0.01%)#1,502 |
| 66. | Glendale Heights | 20 | 8,235(0.24%)#66 | 376,336(0.01%)#1,508 |
| 67. | Mount Vernon | 20 | 8,235(0.24%)#67 | 376,336(0.01%)#1,522 |
| 68. | Schiller Park | 20 | 8,235(0.24%)#68 | 376,336(0.01%)#1,525 |
| 69. | Glen Ellyn | 19 | 8,235(0.23%)#69 | 376,336(0.01%)#1,564 |
| 70. | Norridge | 19 | 8,235(0.23%)#70 | 376,336(0.01%)#1,573 |
| 71. | Crainville | 19 | 8,235(0.23%)#71 | 376,336(0.01%)#1,588 |
| 72. | Hoffman Estates | 18 | 8,235(0.22%)#72 | 376,336(0.00%)#1,596 |
| 73. | Palos Park | 18 | 8,235(0.22%)#73 | 376,336(0.00%)#1,628 |
| 74. | Carol Stream | 17 | 8,235(0.21%)#74 | 376,336(0.00%)#1,641 |
| 75. | North Chicago | 16 | 8,235(0.19%)#75 | 376,336(0.00%)#1,692 |
| 76. | Park Forest | 16 | 8,235(0.19%)#76 | 376,336(0.00%)#1,700 |
| 77. | Bloomington | 15 | 8,235(0.18%)#77 | 376,336(0.00%)#1,737 |
| 78. | Oak Lawn | 15 | 8,235(0.18%)#78 | 376,336(0.00%)#1,739 |
| 79. | Tinley Park | 15 | 8,235(0.18%)#79 | 376,336(0.00%)#1,740 |
| 80. | Fairview Heights | 15 | 8,235(0.18%)#80 | 376,336(0.00%)#1,764 |
| 81. | Rantoul | 15 | 8,235(0.18%)#81 | 376,336(0.00%)#1,767 |
| 82. | Addison | 14 | 8,235(0.17%)#82 | 376,336(0.00%)#1,810 |
| 83. | Gurnee | 14 | 8,235(0.17%)#83 | 376,336(0.00%)#1,812 |
| 84. | Wheeling | 13 | 8,235(0.16%)#84 | 376,336(0.00%)#1,866 |
| 85. | Libertyville | 13 | 8,235(0.16%)#85 | 376,336(0.00%)#1,882 |
| 86. | Bourbonnais | 13 | 8,235(0.16%)#86 | 376,336(0.00%)#1,884 |
| 87. | Waukegan | 11 | 8,235(0.13%)#87 | 376,336(0.00%)#1,978 |
| 88. | Lake Zurich | 11 | 8,235(0.13%)#88 | 376,336(0.00%)#1,998 |
| 89. | Swansea | 11 | 8,235(0.13%)#89 | 376,336(0.00%)#2,003 |
| 90. | Western Springs | 11 | 8,235(0.13%)#90 | 376,336(0.00%)#2,005 |
| 91. | River Forest | 11 | 8,235(0.13%)#91 | 376,336(0.00%)#2,012 |
| 92. | Deer Park | 11 | 8,235(0.13%)#92 | 376,336(0.00%)#2,025 |
| 93. | Des Plaines | 10 | 8,235(0.12%)#93 | 376,336(0.00%)#2,048 |
| 94. | Rock Island | 10 | 8,235(0.12%)#94 | 376,336(0.00%)#2,052 |
| 95. | Oak Forest | 10 | 8,235(0.12%)#95 | 376,336(0.00%)#2,058 |
| 96. | Round Lake | 10 | 8,235(0.12%)#96 | 376,336(0.00%)#2,068 |
| 97. | Winfield | 10 | 8,235(0.12%)#97 | 376,336(0.00%)#2,086 |
| 98. | Grayville | 10 | 8,235(0.12%)#98 | 376,336(0.00%)#2,112 |
| 99. | South Elgin | 9 | 8,235(0.11%)#99 | 376,336(0.00%)#2,129 |
| 100. | Farmer City | 9 | 8,235(0.11%)#100 | 376,336(0.00%)#2,177 |
Common Questions
What are the Top 10 Cities with the Most Immigrants from Taiwan in Illinois?
Top 10 Cities with the Most Immigrants from Taiwan in Illinois are:
#1
1,846
#2
615
#3
319
#4
255
#5
249
#6
246
#7
230
#8
189
#9
171
#10
157
What city has the Most Immigrants from Taiwan in Illinois?
Chicago has the Most Immigrants from Taiwan in Illinois with 1,846.
What is the Total Immigrants from Taiwan in the State of Illinois?
Total Immigrants from Taiwan in Illinois is 8,235.
What is the Total Immigrants from Taiwan in the United States?
Total Immigrants from Taiwan in the United States is 376,336.