Cities with the Most Immigrants from Belgium in Illinois
RELATED REPORTS & OPTIONS
Belgium
Illinois
Compare Cities
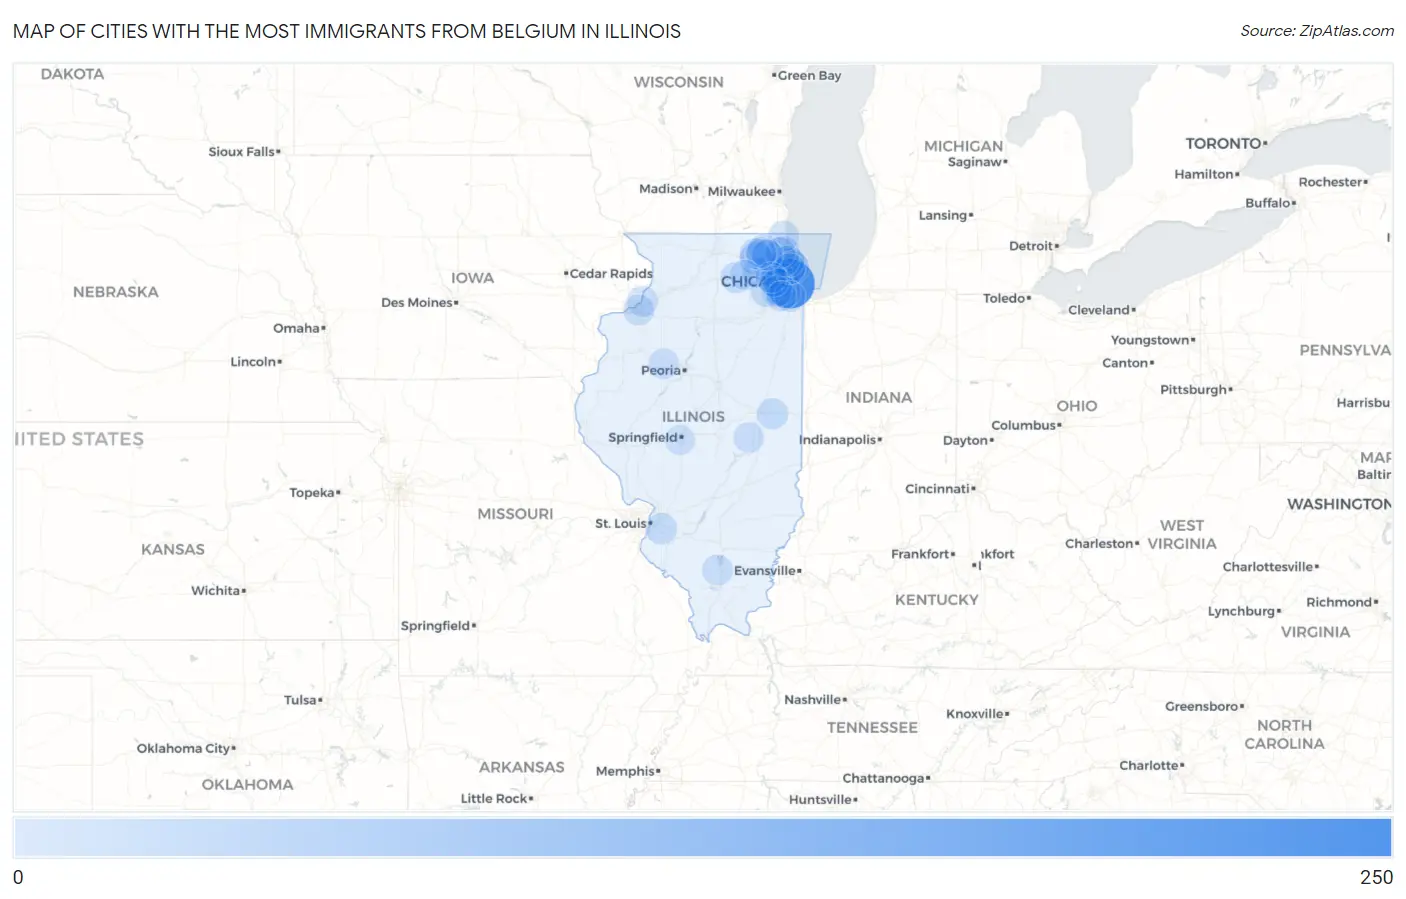
Map of Cities with the Most Immigrants from Belgium in Illinois
0
250
Cities with the Most Immigrants from Belgium in Illinois
| City | Belgium | vs State | vs National | |
| 1. | Chicago | 223 | 775(28.77%)#1 | 34,732(0.64%)#9 |
| 2. | Wilmette | 36 | 775(4.65%)#2 | 34,732(0.10%)#156 |
| 3. | Evanston | 34 | 775(4.39%)#3 | 34,732(0.10%)#170 |
| 4. | Algonquin | 31 | 775(4.00%)#4 | 34,732(0.09%)#189 |
| 5. | Wood Dale | 22 | 775(2.84%)#5 | 34,732(0.06%)#280 |
| 6. | Lake Forest | 21 | 775(2.71%)#6 | 34,732(0.06%)#296 |
| 7. | Schaumburg | 20 | 775(2.58%)#7 | 34,732(0.06%)#305 |
| 8. | Burr Ridge | 15 | 775(1.94%)#8 | 34,732(0.04%)#433 |
| 9. | Lake Barrington | 15 | 775(1.94%)#9 | 34,732(0.04%)#441 |
| 10. | Naperville | 14 | 775(1.81%)#10 | 34,732(0.04%)#446 |
| 11. | Cortland | 13 | 775(1.68%)#11 | 34,732(0.04%)#503 |
| 12. | Swansea | 12 | 775(1.55%)#12 | 34,732(0.03%)#532 |
| 13. | Glencoe | 12 | 775(1.55%)#13 | 34,732(0.03%)#540 |
| 14. | Oak Brook | 10 | 775(1.29%)#14 | 34,732(0.03%)#623 |
| 15. | St Joseph | 10 | 775(1.29%)#15 | 34,732(0.03%)#633 |
| 16. | Northbrook | 9 | 775(1.16%)#16 | 34,732(0.03%)#664 |
| 17. | Zion | 9 | 775(1.16%)#17 | 34,732(0.03%)#668 |
| 18. | South Elgin | 9 | 775(1.16%)#18 | 34,732(0.03%)#669 |
| 19. | Cary | 9 | 775(1.16%)#19 | 34,732(0.03%)#671 |
| 20. | Hickory Hills | 9 | 775(1.16%)#20 | 34,732(0.03%)#674 |
| 21. | Island Lake | 9 | 775(1.16%)#21 | 34,732(0.03%)#681 |
| 22. | Crystal Lake | 8 | 775(1.03%)#22 | 34,732(0.02%)#710 |
| 23. | Darien | 8 | 775(1.03%)#23 | 34,732(0.02%)#716 |
| 24. | Alsip | 8 | 775(1.03%)#24 | 34,732(0.02%)#719 |
| 25. | Port Byron | 8 | 775(1.03%)#25 | 34,732(0.02%)#742 |
| 26. | Mettawa | 8 | 775(1.03%)#26 | 34,732(0.02%)#749 |
| 27. | Skokie | 7 | 775(0.90%)#27 | 34,732(0.02%)#761 |
| 28. | Lombard | 7 | 775(0.90%)#28 | 34,732(0.02%)#767 |
| 29. | North Barrington | 7 | 775(0.90%)#29 | 34,732(0.02%)#790 |
| 30. | Glendale Heights | 6 | 775(0.77%)#30 | 34,732(0.02%)#818 |
| 31. | Carbon Cliff | 6 | 775(0.77%)#31 | 34,732(0.02%)#834 |
| 32. | Buckner | 6 | 775(0.77%)#32 | 34,732(0.02%)#843 |
| 33. | Elmwood | 5 | 775(0.65%)#33 | 34,732(0.01%)#865 |
| 34. | Oakwood Hills | 4 | 775(0.52%)#34 | 34,732(0.01%)#888 |
| 35. | Atwood | 3 | 775(0.39%)#35 | 34,732(0.01%)#922 |
| 36. | Springfield | 1 | 775(0.13%)#36 | 34,732(0.00%)#960 |
| 37. | Palos Park | 1 | 775(0.13%)#37 | 34,732(0.00%)#972 |
| 38. | Virgil | 1 | 775(0.13%)#38 | 34,732(0.00%)#976 |
Common Questions
What are the Top 10 Cities with the Most Immigrants from Belgium in Illinois?
Top 10 Cities with the Most Immigrants from Belgium in Illinois are:
#1
223
#2
36
#3
34
#4
31
#5
22
#6
21
#7
20
#8
15
#9
15
#10
14
What city has the Most Immigrants from Belgium in Illinois?
Chicago has the Most Immigrants from Belgium in Illinois with 223.
What is the Total Immigrants from Belgium in the State of Illinois?
Total Immigrants from Belgium in Illinois is 775.
What is the Total Immigrants from Belgium in the United States?
Total Immigrants from Belgium in the United States is 34,732.