Cities with the Most Immigrants from Africa in Illinois
RELATED REPORTS & OPTIONS
Africa
Illinois
Compare Cities
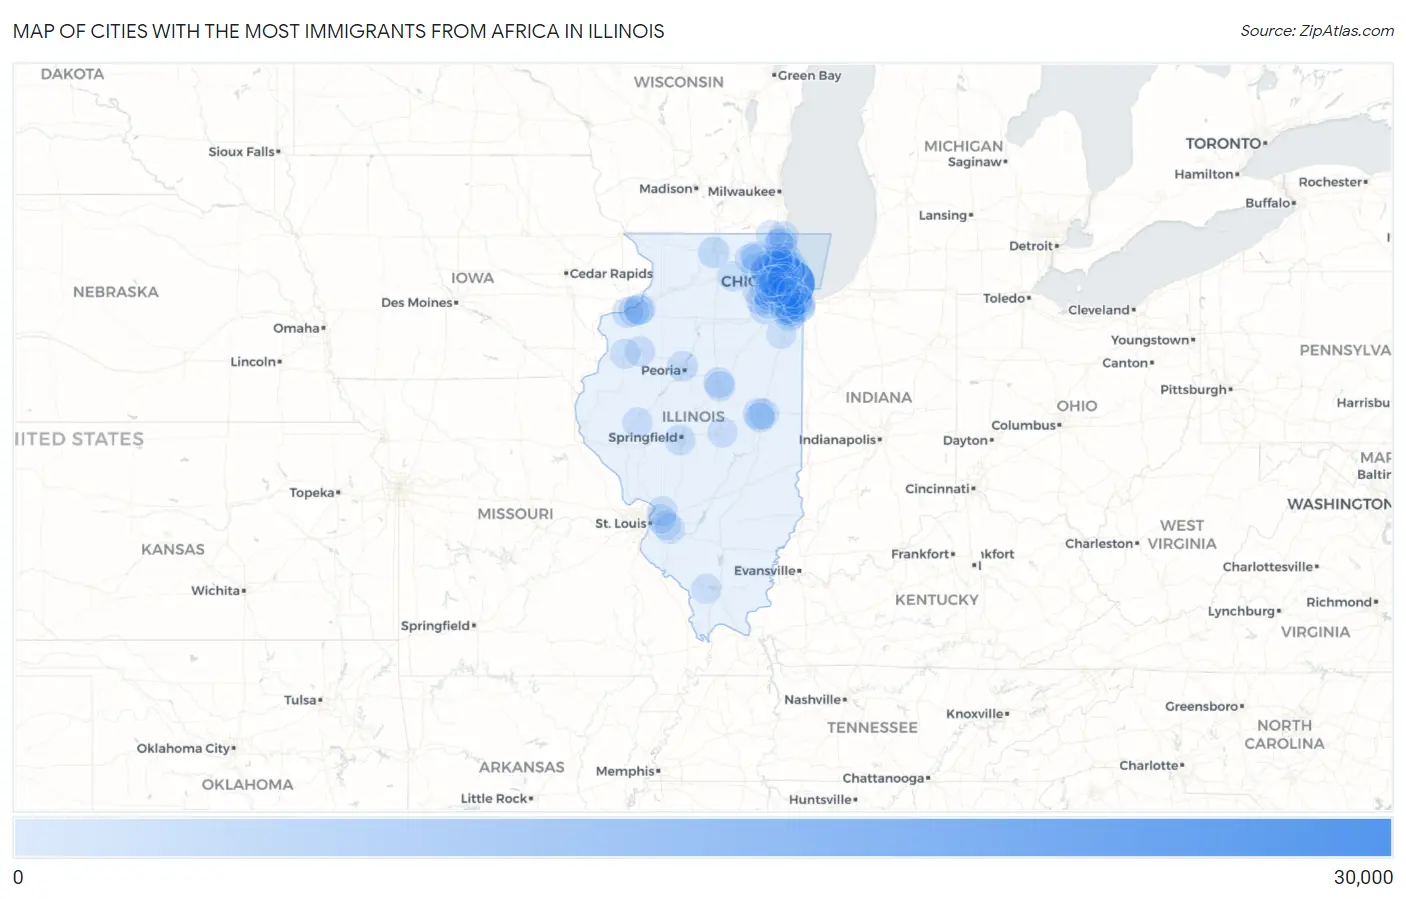
Map of Cities with the Most Immigrants from Africa in Illinois
0
30,000
Cities with the Most Immigrants from Africa in Illinois
| City | Africa | vs State | vs National | |
| 1. | Chicago | 28,029 | 79,218(35.38%)#1 | 2,580,172(1.09%)#4 |
| 2. | Champaign | 2,102 | 79,218(2.65%)#2 | 2,580,172(0.08%)#168 |
| 3. | Rockford | 1,801 | 79,218(2.27%)#3 | 2,580,172(0.07%)#200 |
| 4. | Skokie | 1,701 | 79,218(2.15%)#4 | 2,580,172(0.07%)#218 |
| 5. | Evanston | 1,643 | 79,218(2.07%)#5 | 2,580,172(0.06%)#227 |
| 6. | Joliet | 1,234 | 79,218(1.56%)#6 | 2,580,172(0.05%)#325 |
| 7. | East Moline | 1,225 | 79,218(1.55%)#7 | 2,580,172(0.05%)#328 |
| 8. | Glendale Heights | 1,196 | 79,218(1.51%)#8 | 2,580,172(0.05%)#340 |
| 9. | Plainfield | 1,137 | 79,218(1.44%)#9 | 2,580,172(0.04%)#361 |
| 10. | Rock Island | 1,057 | 79,218(1.33%)#10 | 2,580,172(0.04%)#383 |
| 11. | Waukegan | 1,033 | 79,218(1.30%)#11 | 2,580,172(0.04%)#392 |
| 12. | Naperville | 1,030 | 79,218(1.30%)#12 | 2,580,172(0.04%)#393 |
| 13. | Romeoville | 999 | 79,218(1.26%)#13 | 2,580,172(0.04%)#403 |
| 14. | Peoria | 978 | 79,218(1.23%)#14 | 2,580,172(0.04%)#411 |
| 15. | Aurora | 971 | 79,218(1.23%)#15 | 2,580,172(0.04%)#414 |
| 16. | Woodridge | 952 | 79,218(1.20%)#16 | 2,580,172(0.04%)#425 |
| 17. | Urbana | 898 | 79,218(1.13%)#17 | 2,580,172(0.03%)#445 |
| 18. | Normal | 894 | 79,218(1.13%)#18 | 2,580,172(0.03%)#448 |
| 19. | Springfield | 867 | 79,218(1.09%)#19 | 2,580,172(0.03%)#471 |
| 20. | Schaumburg | 792 | 79,218(1.00%)#20 | 2,580,172(0.03%)#504 |
| 21. | Moline | 781 | 79,218(0.99%)#21 | 2,580,172(0.03%)#508 |
| 22. | Bolingbrook | 638 | 79,218(0.81%)#22 | 2,580,172(0.02%)#607 |
| 23. | Hoffman Estates | 608 | 79,218(0.77%)#23 | 2,580,172(0.02%)#638 |
| 24. | Calumet City | 580 | 79,218(0.73%)#24 | 2,580,172(0.02%)#665 |
| 25. | Wheaton | 499 | 79,218(0.63%)#25 | 2,580,172(0.02%)#734 |
| 26. | South Holland | 477 | 79,218(0.60%)#26 | 2,580,172(0.02%)#766 |
| 27. | Dekalb | 455 | 79,218(0.57%)#27 | 2,580,172(0.02%)#801 |
| 28. | Tinley Park | 453 | 79,218(0.57%)#28 | 2,580,172(0.02%)#805 |
| 29. | Lansing | 428 | 79,218(0.54%)#29 | 2,580,172(0.02%)#846 |
| 30. | Des Plaines | 420 | 79,218(0.53%)#30 | 2,580,172(0.02%)#853 |
| 31. | Galesburg | 409 | 79,218(0.52%)#31 | 2,580,172(0.02%)#874 |
| 32. | Arlington Heights | 404 | 79,218(0.51%)#32 | 2,580,172(0.02%)#881 |
| 33. | Hillside | 403 | 79,218(0.51%)#33 | 2,580,172(0.02%)#884 |
| 34. | Palatine | 383 | 79,218(0.48%)#34 | 2,580,172(0.01%)#924 |
| 35. | Elgin | 359 | 79,218(0.45%)#35 | 2,580,172(0.01%)#976 |
| 36. | University Park | 339 | 79,218(0.43%)#36 | 2,580,172(0.01%)#1,026 |
| 37. | Bloomington | 328 | 79,218(0.41%)#37 | 2,580,172(0.01%)#1,047 |
| 38. | Oak Lawn | 325 | 79,218(0.41%)#38 | 2,580,172(0.01%)#1,059 |
| 39. | Hanover Park | 300 | 79,218(0.38%)#39 | 2,580,172(0.01%)#1,123 |
| 40. | Country Club Hills | 290 | 79,218(0.37%)#40 | 2,580,172(0.01%)#1,147 |
| 41. | Park Forest | 288 | 79,218(0.36%)#41 | 2,580,172(0.01%)#1,156 |
| 42. | Decatur | 271 | 79,218(0.34%)#42 | 2,580,172(0.01%)#1,188 |
| 43. | Orland Park | 270 | 79,218(0.34%)#43 | 2,580,172(0.01%)#1,191 |
| 44. | Monee | 270 | 79,218(0.34%)#44 | 2,580,172(0.01%)#1,192 |
| 45. | Berwyn | 264 | 79,218(0.33%)#45 | 2,580,172(0.01%)#1,209 |
| 46. | Beardstown | 262 | 79,218(0.33%)#46 | 2,580,172(0.01%)#1,220 |
| 47. | Niles | 261 | 79,218(0.33%)#47 | 2,580,172(0.01%)#1,223 |
| 48. | Carol Stream | 246 | 79,218(0.31%)#48 | 2,580,172(0.01%)#1,281 |
| 49. | Huntley | 239 | 79,218(0.30%)#49 | 2,580,172(0.01%)#1,304 |
| 50. | Bridgeview | 226 | 79,218(0.29%)#50 | 2,580,172(0.01%)#1,359 |
| 51. | Palos Hills | 225 | 79,218(0.28%)#51 | 2,580,172(0.01%)#1,364 |
| 52. | Northbrook | 221 | 79,218(0.28%)#52 | 2,580,172(0.01%)#1,384 |
| 53. | Richton Park | 221 | 79,218(0.28%)#53 | 2,580,172(0.01%)#1,389 |
| 54. | Matteson | 214 | 79,218(0.27%)#54 | 2,580,172(0.01%)#1,414 |
| 55. | Algonquin | 209 | 79,218(0.26%)#55 | 2,580,172(0.01%)#1,435 |
| 56. | Streamwood | 207 | 79,218(0.26%)#56 | 2,580,172(0.01%)#1,444 |
| 57. | North Chicago | 205 | 79,218(0.26%)#57 | 2,580,172(0.01%)#1,449 |
| 58. | Prospect Heights | 203 | 79,218(0.26%)#58 | 2,580,172(0.01%)#1,460 |
| 59. | Oak Park | 201 | 79,218(0.25%)#59 | 2,580,172(0.01%)#1,467 |
| 60. | Scott Afb | 199 | 79,218(0.25%)#60 | 2,580,172(0.01%)#1,475 |
| 61. | Alsip | 193 | 79,218(0.24%)#61 | 2,580,172(0.01%)#1,509 |
| 62. | Zion | 192 | 79,218(0.24%)#62 | 2,580,172(0.01%)#1,512 |
| 63. | Lincolnwood | 190 | 79,218(0.24%)#63 | 2,580,172(0.01%)#1,524 |
| 64. | Edwardsville | 187 | 79,218(0.24%)#64 | 2,580,172(0.01%)#1,540 |
| 65. | Hazel Crest | 184 | 79,218(0.23%)#65 | 2,580,172(0.01%)#1,556 |
| 66. | Downers Grove | 183 | 79,218(0.23%)#66 | 2,580,172(0.01%)#1,559 |
| 67. | Glenview | 183 | 79,218(0.23%)#67 | 2,580,172(0.01%)#1,560 |
| 68. | Hinsdale | 183 | 79,218(0.23%)#68 | 2,580,172(0.01%)#1,562 |
| 69. | Rolling Meadows | 182 | 79,218(0.23%)#69 | 2,580,172(0.01%)#1,568 |
| 70. | Crest Hill | 181 | 79,218(0.23%)#70 | 2,580,172(0.01%)#1,574 |
| 71. | Burr Ridge | 170 | 79,218(0.21%)#71 | 2,580,172(0.01%)#1,614 |
| 72. | Mount Prospect | 168 | 79,218(0.21%)#72 | 2,580,172(0.01%)#1,621 |
| 73. | Berkeley | 167 | 79,218(0.21%)#73 | 2,580,172(0.01%)#1,630 |
| 74. | Villa Park | 165 | 79,218(0.21%)#74 | 2,580,172(0.01%)#1,645 |
| 75. | Frankfort | 165 | 79,218(0.21%)#75 | 2,580,172(0.01%)#1,646 |
| 76. | Wheeling | 161 | 79,218(0.20%)#76 | 2,580,172(0.01%)#1,688 |
| 77. | Highland Park | 161 | 79,218(0.20%)#77 | 2,580,172(0.01%)#1,690 |
| 78. | Silvis | 161 | 79,218(0.20%)#78 | 2,580,172(0.01%)#1,697 |
| 79. | Bourbonnais | 158 | 79,218(0.20%)#79 | 2,580,172(0.01%)#1,713 |
| 80. | Oak Forest | 157 | 79,218(0.20%)#80 | 2,580,172(0.01%)#1,719 |
| 81. | Lake In The Hills | 154 | 79,218(0.19%)#81 | 2,580,172(0.01%)#1,741 |
| 82. | Monmouth | 154 | 79,218(0.19%)#82 | 2,580,172(0.01%)#1,742 |
| 83. | Lynwood | 152 | 79,218(0.19%)#83 | 2,580,172(0.01%)#1,755 |
| 84. | Westmont | 150 | 79,218(0.19%)#84 | 2,580,172(0.01%)#1,764 |
| 85. | Dolton | 149 | 79,218(0.19%)#85 | 2,580,172(0.01%)#1,769 |
| 86. | Buffalo Grove | 148 | 79,218(0.19%)#86 | 2,580,172(0.01%)#1,778 |
| 87. | O Fallon | 147 | 79,218(0.19%)#87 | 2,580,172(0.01%)#1,785 |
| 88. | Savoy | 142 | 79,218(0.18%)#88 | 2,580,172(0.01%)#1,827 |
| 89. | Gurnee | 140 | 79,218(0.18%)#89 | 2,580,172(0.01%)#1,846 |
| 90. | Darien | 139 | 79,218(0.18%)#90 | 2,580,172(0.01%)#1,852 |
| 91. | River Grove | 136 | 79,218(0.17%)#91 | 2,580,172(0.01%)#1,878 |
| 92. | Hickory Hills | 127 | 79,218(0.16%)#92 | 2,580,172(0.00%)#1,951 |
| 93. | Lisle | 123 | 79,218(0.16%)#93 | 2,580,172(0.00%)#1,984 |
| 94. | Collinsville | 122 | 79,218(0.15%)#94 | 2,580,172(0.00%)#1,992 |
| 95. | Glen Ellyn | 121 | 79,218(0.15%)#95 | 2,580,172(0.00%)#2,001 |
| 96. | Carbondale | 119 | 79,218(0.15%)#96 | 2,580,172(0.00%)#2,020 |
| 97. | Lombard | 117 | 79,218(0.15%)#97 | 2,580,172(0.00%)#2,032 |
| 98. | Bellwood | 116 | 79,218(0.15%)#98 | 2,580,172(0.00%)#2,043 |
| 99. | Antioch | 113 | 79,218(0.14%)#99 | 2,580,172(0.00%)#2,084 |
| 100. | Evergreen Park | 112 | 79,218(0.14%)#100 | 2,580,172(0.00%)#2,101 |
Common Questions
What are the Top 10 Cities with the Most Immigrants from Africa in Illinois?
Top 10 Cities with the Most Immigrants from Africa in Illinois are:
#1
28,029
#2
2,102
#3
1,801
#4
1,701
#5
1,643
#6
1,234
#7
1,225
#8
1,196
#9
1,137
#10
1,057
What city has the Most Immigrants from Africa in Illinois?
Chicago has the Most Immigrants from Africa in Illinois with 28,029.
What is the Total Immigrants from Africa in the State of Illinois?
Total Immigrants from Africa in Illinois is 79,218.
What is the Total Immigrants from Africa in the United States?
Total Immigrants from Africa in the United States is 2,580,172.