Cities with the Most Immigrants from Jordan in Illinois
RELATED REPORTS & OPTIONS
Jordan
Illinois
Compare Cities
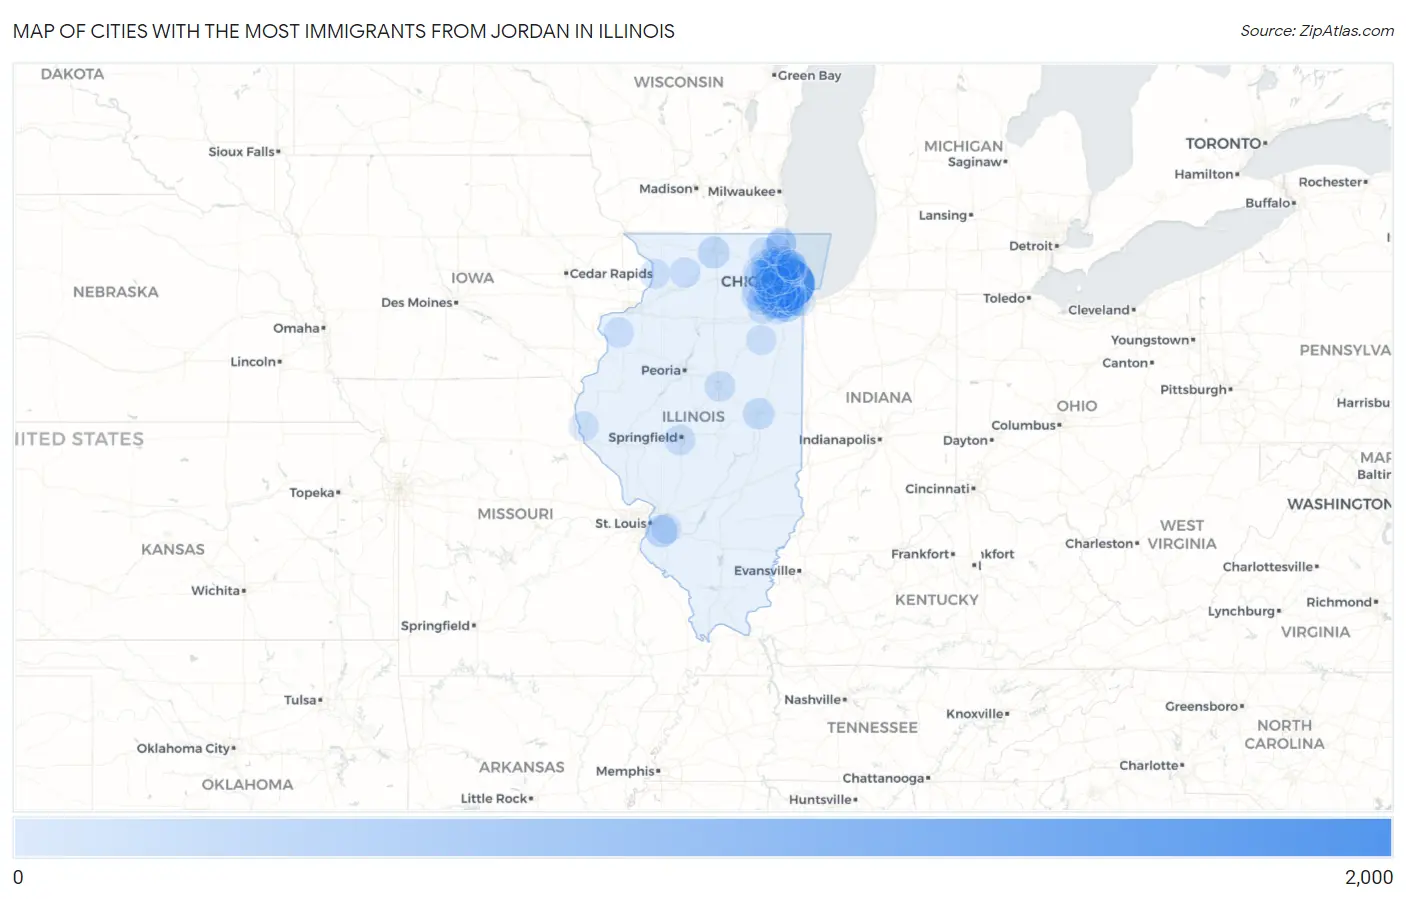
Map of Cities with the Most Immigrants from Jordan in Illinois
0
2,000
Cities with the Most Immigrants from Jordan in Illinois
| City | Jordan | vs State | vs National | |
| 1. | Chicago | 1,977 | 8,827(22.40%)#1 | 88,074(2.24%)#2 |
| 2. | Orland Park | 517 | 8,827(5.86%)#2 | 88,074(0.59%)#15 |
| 3. | Chicago Ridge | 497 | 8,827(5.63%)#3 | 88,074(0.56%)#16 |
| 4. | Worth | 438 | 8,827(4.96%)#4 | 88,074(0.50%)#20 |
| 5. | Oak Lawn | 372 | 8,827(4.21%)#5 | 88,074(0.42%)#28 |
| 6. | Burbank | 372 | 8,827(4.21%)#6 | 88,074(0.42%)#29 |
| 7. | Tinley Park | 365 | 8,827(4.14%)#7 | 88,074(0.41%)#31 |
| 8. | Hickory Hills | 300 | 8,827(3.40%)#8 | 88,074(0.34%)#51 |
| 9. | Palos Hills | 291 | 8,827(3.30%)#9 | 88,074(0.33%)#53 |
| 10. | Homer Glen | 270 | 8,827(3.06%)#10 | 88,074(0.31%)#59 |
| 11. | Belleville | 217 | 8,827(2.46%)#11 | 88,074(0.25%)#73 |
| 12. | Justice | 211 | 8,827(2.39%)#12 | 88,074(0.24%)#76 |
| 13. | Bridgeview | 206 | 8,827(2.33%)#13 | 88,074(0.23%)#81 |
| 14. | Rockford | 181 | 8,827(2.05%)#14 | 88,074(0.21%)#93 |
| 15. | Oak Forest | 169 | 8,827(1.91%)#15 | 88,074(0.19%)#97 |
| 16. | Orland Hills | 133 | 8,827(1.51%)#16 | 88,074(0.15%)#131 |
| 17. | Champaign | 125 | 8,827(1.42%)#17 | 88,074(0.14%)#142 |
| 18. | Lockport | 103 | 8,827(1.17%)#18 | 88,074(0.12%)#175 |
| 19. | Lyons | 74 | 8,827(0.84%)#19 | 88,074(0.08%)#251 |
| 20. | South Barrington | 72 | 8,827(0.82%)#20 | 88,074(0.08%)#254 |
| 21. | Morton Grove | 68 | 8,827(0.77%)#21 | 88,074(0.08%)#262 |
| 22. | Des Plaines | 67 | 8,827(0.76%)#22 | 88,074(0.08%)#266 |
| 23. | Summit | 67 | 8,827(0.76%)#23 | 88,074(0.08%)#268 |
| 24. | Springfield | 62 | 8,827(0.70%)#24 | 88,074(0.07%)#284 |
| 25. | Romeoville | 60 | 8,827(0.68%)#25 | 88,074(0.07%)#301 |
| 26. | Bloomington | 56 | 8,827(0.63%)#26 | 88,074(0.06%)#310 |
| 27. | Norridge | 56 | 8,827(0.63%)#27 | 88,074(0.06%)#314 |
| 28. | New Lenox | 54 | 8,827(0.61%)#28 | 88,074(0.06%)#329 |
| 29. | Schiller Park | 53 | 8,827(0.60%)#29 | 88,074(0.06%)#336 |
| 30. | Wheeling | 52 | 8,827(0.59%)#30 | 88,074(0.06%)#341 |
| 31. | Mount Prospect | 50 | 8,827(0.57%)#31 | 88,074(0.06%)#355 |
| 32. | Bensenville | 48 | 8,827(0.54%)#32 | 88,074(0.05%)#374 |
| 33. | Bolingbrook | 46 | 8,827(0.52%)#33 | 88,074(0.05%)#385 |
| 34. | Palatine | 44 | 8,827(0.50%)#34 | 88,074(0.05%)#400 |
| 35. | Westmont | 40 | 8,827(0.45%)#35 | 88,074(0.05%)#432 |
| 36. | Lincolnwood | 40 | 8,827(0.45%)#36 | 88,074(0.05%)#437 |
| 37. | Elmhurst | 39 | 8,827(0.44%)#37 | 88,074(0.04%)#443 |
| 38. | Palos Heights | 36 | 8,827(0.41%)#38 | 88,074(0.04%)#467 |
| 39. | Skokie | 34 | 8,827(0.39%)#39 | 88,074(0.04%)#481 |
| 40. | Westchester | 34 | 8,827(0.39%)#40 | 88,074(0.04%)#486 |
| 41. | Naperville | 33 | 8,827(0.37%)#41 | 88,074(0.04%)#490 |
| 42. | North Riverside | 31 | 8,827(0.35%)#42 | 88,074(0.04%)#514 |
| 43. | Glendale Heights | 28 | 8,827(0.32%)#43 | 88,074(0.03%)#553 |
| 44. | Aurora | 27 | 8,827(0.31%)#44 | 88,074(0.03%)#564 |
| 45. | Waukegan | 27 | 8,827(0.31%)#45 | 88,074(0.03%)#566 |
| 46. | Addison | 27 | 8,827(0.31%)#46 | 88,074(0.03%)#573 |
| 47. | Woodridge | 27 | 8,827(0.31%)#47 | 88,074(0.03%)#574 |
| 48. | Rolling Meadows | 27 | 8,827(0.31%)#48 | 88,074(0.03%)#577 |
| 49. | Oak Brook | 26 | 8,827(0.29%)#49 | 88,074(0.03%)#592 |
| 50. | Polo | 26 | 8,827(0.29%)#50 | 88,074(0.03%)#594 |
| 51. | Crestwood | 24 | 8,827(0.27%)#51 | 88,074(0.03%)#619 |
| 52. | Aledo | 22 | 8,827(0.25%)#52 | 88,074(0.02%)#647 |
| 53. | Shorewood | 20 | 8,827(0.23%)#53 | 88,074(0.02%)#681 |
| 54. | Winfield | 19 | 8,827(0.22%)#54 | 88,074(0.02%)#705 |
| 55. | Berwyn | 18 | 8,827(0.20%)#55 | 88,074(0.02%)#711 |
| 56. | Alsip | 18 | 8,827(0.20%)#56 | 88,074(0.02%)#715 |
| 57. | Harvey | 16 | 8,827(0.18%)#57 | 88,074(0.02%)#753 |
| 58. | Lemont | 16 | 8,827(0.18%)#58 | 88,074(0.02%)#756 |
| 59. | Rosemont | 16 | 8,827(0.18%)#59 | 88,074(0.02%)#764 |
| 60. | Oswego | 14 | 8,827(0.16%)#60 | 88,074(0.02%)#805 |
| 61. | Elk Grove Village | 14 | 8,827(0.16%)#61 | 88,074(0.02%)#806 |
| 62. | Melrose Park | 14 | 8,827(0.16%)#62 | 88,074(0.02%)#809 |
| 63. | Palos Park | 13 | 8,827(0.15%)#63 | 88,074(0.01%)#849 |
| 64. | Schaumburg | 12 | 8,827(0.14%)#64 | 88,074(0.01%)#857 |
| 65. | Calumet City | 12 | 8,827(0.14%)#65 | 88,074(0.01%)#865 |
| 66. | South Elgin | 12 | 8,827(0.14%)#66 | 88,074(0.01%)#870 |
| 67. | Park Ridge | 11 | 8,827(0.12%)#67 | 88,074(0.01%)#890 |
| 68. | Willow Springs | 11 | 8,827(0.12%)#68 | 88,074(0.01%)#898 |
| 69. | Hanover Park | 10 | 8,827(0.11%)#69 | 88,074(0.01%)#912 |
| 70. | Port Barrington | 10 | 8,827(0.11%)#70 | 88,074(0.01%)#935 |
| 71. | Plainfield | 9 | 8,827(0.10%)#71 | 88,074(0.01%)#946 |
| 72. | Park City | 8 | 8,827(0.09%)#72 | 88,074(0.01%)#993 |
| 73. | Elmwood Park | 7 | 8,827(0.08%)#73 | 88,074(0.01%)#1,014 |
| 74. | Lisle | 7 | 8,827(0.08%)#74 | 88,074(0.01%)#1,015 |
| 75. | Wheaton | 6 | 8,827(0.07%)#75 | 88,074(0.01%)#1,040 |
| 76. | Wilmette | 6 | 8,827(0.07%)#76 | 88,074(0.01%)#1,047 |
| 77. | Wayne | 6 | 8,827(0.07%)#77 | 88,074(0.01%)#1,057 |
| 78. | Quincy | 5 | 8,827(0.06%)#78 | 88,074(0.01%)#1,065 |
| 79. | Northbrook | 4 | 8,827(0.05%)#79 | 88,074(0.00%)#1,083 |
| 80. | Villa Park | 4 | 8,827(0.05%)#80 | 88,074(0.00%)#1,086 |
| 81. | Libertyville | 4 | 8,827(0.05%)#81 | 88,074(0.00%)#1,089 |
| 82. | Shiloh | 4 | 8,827(0.05%)#82 | 88,074(0.00%)#1,091 |
| 83. | Thomson | 4 | 8,827(0.05%)#83 | 88,074(0.00%)#1,099 |
| 84. | Evanston | 3 | 8,827(0.03%)#84 | 88,074(0.00%)#1,101 |
| 85. | Kenilworth | 2 | 8,827(0.02%)#85 | 88,074(0.00%)#1,128 |
| 86. | Reddick | 1 | 8,827(0.01%)#86 | 88,074(0.00%)#1,140 |
Common Questions
What are the Top 10 Cities with the Most Immigrants from Jordan in Illinois?
Top 10 Cities with the Most Immigrants from Jordan in Illinois are:
#1
1,977
#2
517
#3
497
#4
438
#5
372
#6
372
#7
365
#8
300
#9
291
#10
270
What city has the Most Immigrants from Jordan in Illinois?
Chicago has the Most Immigrants from Jordan in Illinois with 1,977.
What is the Total Immigrants from Jordan in the State of Illinois?
Total Immigrants from Jordan in Illinois is 8,827.
What is the Total Immigrants from Jordan in the United States?
Total Immigrants from Jordan in the United States is 88,074.