Cities with the Highest Percentage of South African Population in Illinois
RELATED REPORTS & OPTIONS
South African
Illinois
Compare Cities
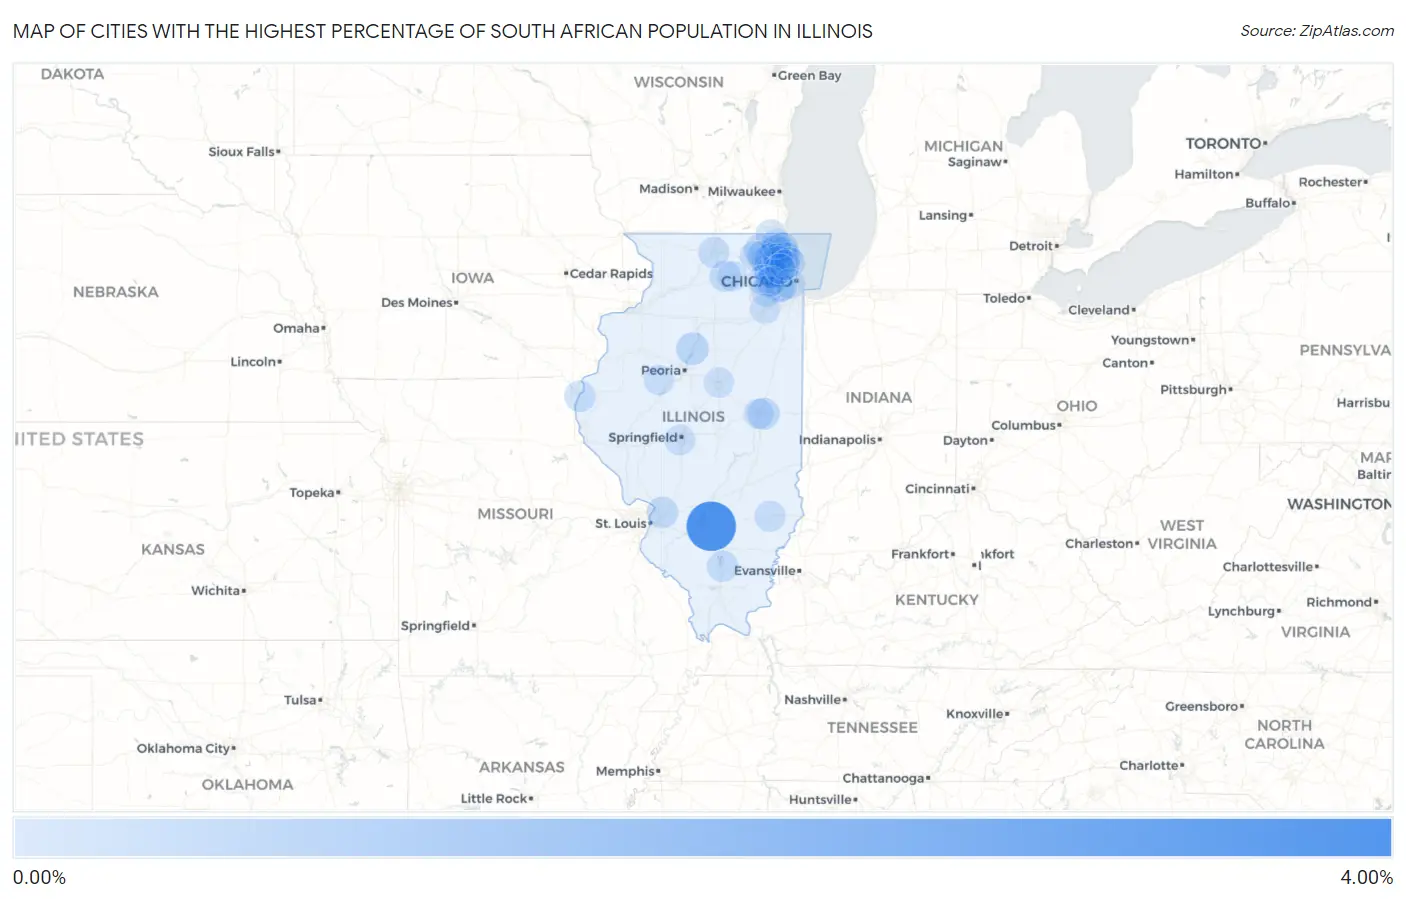
Map of Cities with the Highest Percentage of South African Population in Illinois
0.00%
4.00%
Cities with the Highest Percentage of South African Population in Illinois
| City | South African | vs State | vs National | |
| 1. | Junction City | 3.58% | 0.016%(+3.57)#1 | 0.024%(+3.56)#16 |
| 2. | Schaumburg | 0.47% | 0.016%(+0.450)#2 | 0.024%(+0.443)#231 |
| 3. | Hopewell | 0.42% | 0.016%(+0.403)#3 | 0.024%(+0.395)#254 |
| 4. | Barrington | 0.31% | 0.016%(+0.295)#4 | 0.024%(+0.287)#321 |
| 5. | Prairie Grove | 0.31% | 0.016%(+0.289)#5 | 0.024%(+0.281)#331 |
| 6. | Urbana | 0.30% | 0.016%(+0.288)#6 | 0.024%(+0.281)#334 |
| 7. | Glen Carbon | 0.24% | 0.016%(+0.225)#7 | 0.024%(+0.218)#392 |
| 8. | Deerfield | 0.22% | 0.016%(+0.208)#8 | 0.024%(+0.200)#416 |
| 9. | Malta | 0.20% | 0.016%(+0.179)#9 | 0.024%(+0.171)#462 |
| 10. | Warsaw | 0.20% | 0.016%(+0.179)#10 | 0.024%(+0.171)#463 |
| 11. | Mundelein | 0.19% | 0.016%(+0.171)#11 | 0.024%(+0.163)#476 |
| 12. | Benton | 0.19% | 0.016%(+0.170)#12 | 0.024%(+0.162)#478 |
| 13. | Rosemont | 0.18% | 0.016%(+0.165)#13 | 0.024%(+0.157)#489 |
| 14. | Hinsdale | 0.16% | 0.016%(+0.141)#14 | 0.024%(+0.133)#530 |
| 15. | Libertyville | 0.16% | 0.016%(+0.139)#15 | 0.024%(+0.132)#532 |
| 16. | Olney | 0.16% | 0.016%(+0.139)#16 | 0.024%(+0.132)#533 |
| 17. | Fox River Grove | 0.15% | 0.016%(+0.136)#17 | 0.024%(+0.128)#543 |
| 18. | Lake Forest | 0.14% | 0.016%(+0.128)#18 | 0.024%(+0.120)#558 |
| 19. | Western Springs | 0.14% | 0.016%(+0.124)#19 | 0.024%(+0.116)#569 |
| 20. | Antioch | 0.14% | 0.016%(+0.120)#20 | 0.024%(+0.112)#577 |
| 21. | Deer Park | 0.14% | 0.016%(+0.119)#21 | 0.024%(+0.111)#580 |
| 22. | Rockford | 0.13% | 0.016%(+0.114)#22 | 0.024%(+0.106)#594 |
| 23. | Roselle | 0.13% | 0.016%(+0.111)#23 | 0.024%(+0.103)#604 |
| 24. | Highland Park | 0.12% | 0.016%(+0.100)#24 | 0.024%(+0.092)#624 |
| 25. | Naperville | 0.11% | 0.016%(+0.098)#25 | 0.024%(+0.091)#628 |
| 26. | North Chicago | 0.11% | 0.016%(+0.097)#26 | 0.024%(+0.089)#631 |
| 27. | Springfield | 0.081% | 0.016%(+0.065)#27 | 0.024%(+0.057)#744 |
| 28. | Itasca | 0.073% | 0.016%(+0.057)#28 | 0.024%(+0.049)#782 |
| 29. | Buffalo Grove | 0.065% | 0.016%(+0.049)#29 | 0.024%(+0.041)#815 |
| 30. | Wheeling | 0.049% | 0.016%(+0.033)#30 | 0.024%(+0.025)#924 |
| 31. | Champaign | 0.049% | 0.016%(+0.032)#31 | 0.024%(+0.025)#925 |
| 32. | Winnetka | 0.048% | 0.016%(+0.031)#32 | 0.024%(+0.024)#930 |
| 33. | Lake In The Hills | 0.038% | 0.016%(+0.022)#33 | 0.024%(+0.014)#1,006 |
| 34. | Canton | 0.037% | 0.016%(+0.021)#34 | 0.024%(+0.013)#1,016 |
| 35. | Dekalb | 0.037% | 0.016%(+0.021)#35 | 0.024%(+0.013)#1,019 |
| 36. | Gages Lake | 0.037% | 0.016%(+0.020)#36 | 0.024%(+0.013)#1,021 |
| 37. | West Chicago | 0.031% | 0.016%(+0.015)#37 | 0.024%(+0.007)#1,069 |
| 38. | Glen Ellyn | 0.025% | 0.016%(+0.009)#38 | 0.024%(+0.001)#1,127 |
| 39. | Normal | 0.021% | 0.016%(+0.005)#39 | 0.024%(-0.003)#1,175 |
| 40. | Wheaton | 0.019% | 0.016%(+0.002)#40 | 0.024%(-0.005)#1,204 |
| 41. | Chicago | 0.016% | 0.016%(+0.000)#41 | 0.024%(-0.008)#1,233 |
| 42. | Glenview | 0.013% | 0.016%(-0.004)#42 | 0.024%(-0.011)#1,287 |
| 43. | Des Plaines | 0.0100% | 0.016%(-0.006)#43 | 0.024%(-0.014)#1,315 |
| 44. | Joliet | 0.0073% | 0.016%(-0.009)#44 | 0.024%(-0.017)#1,350 |
Common Questions
What are the Top 10 Cities with the Highest Percentage of South African Population in Illinois?
Top 10 Cities with the Highest Percentage of South African Population in Illinois are:
#1
3.58%
#2
0.47%
#3
0.42%
#4
0.31%
#5
0.31%
#6
0.30%
#7
0.24%
#8
0.22%
#9
0.20%
#10
0.20%
What city has the Highest Percentage of South African Population in Illinois?
Junction City has the Highest Percentage of South African Population in Illinois with 3.58%.
What is the Percentage of South African Population in the State of Illinois?
Percentage of South African Population in Illinois is 0.016%.
What is the Percentage of South African Population in the United States?
Percentage of South African Population in the United States is 0.024%.