Cities with the Highest Poverty Level Among Single Females in Illinois
RELATED REPORTS & OPTIONS
Highest Poverty | Single Female
Illinois
Compare Cities
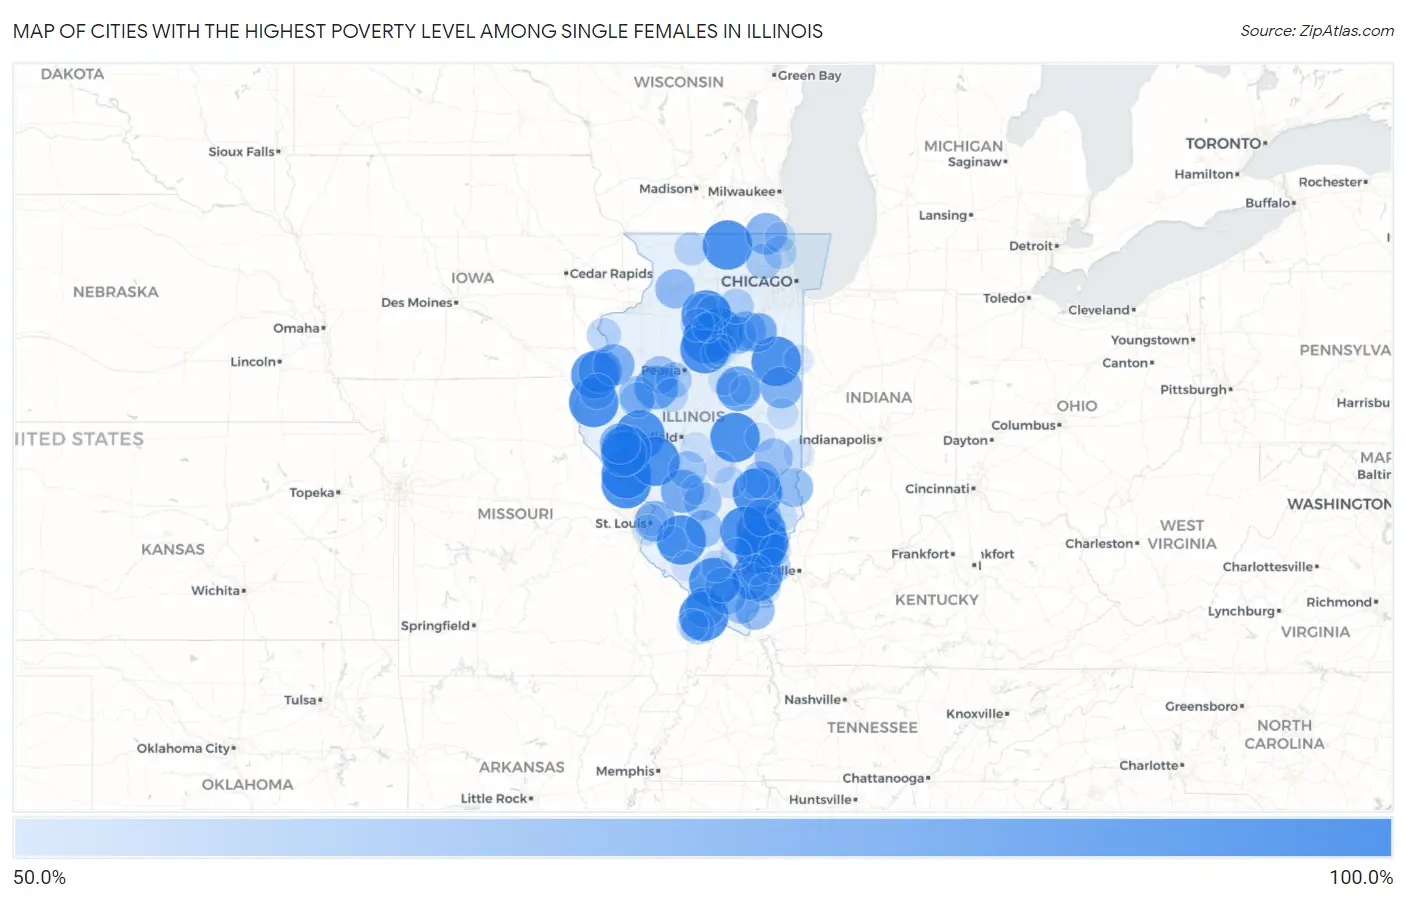
Map of Cities with the Highest Poverty Level Among Single Females in Illinois
0.0%
100.0%
Cities with the Highest Poverty Level Among Single Females in Illinois
| City | Single Female Poverty | vs State | vs National | |
| 1. | Poplar Grove | 100.0% | 23.6%(+76.4)#1 | 24.1%(+75.9)#6 |
| 2. | Hardin | 100.0% | 23.6%(+76.4)#2 | 24.1%(+75.9)#147 |
| 3. | Danforth | 100.0% | 23.6%(+76.4)#3 | 24.1%(+75.9)#225 |
| 4. | Cherry | 100.0% | 23.6%(+76.4)#4 | 24.1%(+75.9)#286 |
| 5. | Campbell's Island | 100.0% | 23.6%(+76.4)#5 | 24.1%(+75.9)#316 |
| 6. | Alexander | 100.0% | 23.6%(+76.4)#6 | 24.1%(+75.9)#453 |
| 7. | Kampsville | 100.0% | 23.6%(+76.4)#7 | 24.1%(+75.9)#474 |
| 8. | West Point | 100.0% | 23.6%(+76.4)#8 | 24.1%(+75.9)#508 |
| 9. | Omaha | 100.0% | 23.6%(+76.4)#9 | 24.1%(+75.9)#515 |
| 10. | Colp | 100.0% | 23.6%(+76.4)#10 | 24.1%(+75.9)#518 |
| 11. | Magnolia | 100.0% | 23.6%(+76.4)#11 | 24.1%(+75.9)#533 |
| 12. | Lawrence | 100.0% | 23.6%(+76.4)#12 | 24.1%(+75.9)#572 |
| 13. | Holcomb | 100.0% | 23.6%(+76.4)#13 | 24.1%(+75.9)#640 |
| 14. | Concord | 100.0% | 23.6%(+76.4)#14 | 24.1%(+75.9)#658 |
| 15. | Laplace | 100.0% | 23.6%(+76.4)#15 | 24.1%(+75.9)#667 |
| 16. | Mount Erie | 100.0% | 23.6%(+76.4)#16 | 24.1%(+75.9)#702 |
| 17. | Venedy | 100.0% | 23.6%(+76.4)#17 | 24.1%(+75.9)#707 |
| 18. | Leonore | 100.0% | 23.6%(+76.4)#18 | 24.1%(+75.9)#711 |
| 19. | Wheeler | 100.0% | 23.6%(+76.4)#19 | 24.1%(+75.9)#726 |
| 20. | La Rose | 100.0% | 23.6%(+76.4)#20 | 24.1%(+75.9)#764 |
| 21. | Burnt Prairie | 100.0% | 23.6%(+76.4)#21 | 24.1%(+75.9)#785 |
| 22. | Golden Gate | 100.0% | 23.6%(+76.4)#22 | 24.1%(+75.9)#802 |
| 23. | Gulfport | 100.0% | 23.6%(+76.4)#24 | 24.1%(+75.9)#827 |
| 24. | Scottville | 100.0% | 23.6%(+76.4)#25 | 24.1%(+75.9)#828 |
| 25. | Johnsonville | 100.0% | 23.6%(+76.4)#26 | 24.1%(+75.9)#907 |
| 26. | Mill Creek | 100.0% | 23.6%(+76.4)#27 | 24.1%(+75.9)#921 |
| 27. | Florence | 100.0% | 23.6%(+76.4)#28 | 24.1%(+75.9)#967 |
| 28. | Dallas City | 96.3% | 23.6%(+72.7)#29 | 24.1%(+72.2)#974 |
| 29. | Milton | 91.7% | 23.6%(+68.1)#30 | 24.1%(+67.6)#1,014 |
| 30. | Arrowsmith | 90.0% | 23.6%(+66.4)#31 | 24.1%(+65.9)#1,038 |
| 31. | Lomax | 87.5% | 23.6%(+63.9)#32 | 24.1%(+63.4)#1,093 |
| 32. | Bryant | 87.5% | 23.6%(+63.9)#33 | 24.1%(+63.4)#1,098 |
| 33. | Walshville | 86.7% | 23.6%(+63.1)#34 | 24.1%(+62.6)#1,118 |
| 34. | Channel Lake | 83.5% | 23.6%(+59.9)#35 | 24.1%(+59.4)#1,197 |
| 35. | Rankin | 83.3% | 23.6%(+59.7)#36 | 24.1%(+59.3)#1,211 |
| 36. | Media | 83.3% | 23.6%(+59.7)#37 | 24.1%(+59.3)#1,231 |
| 37. | Fairmont City | 82.0% | 23.6%(+58.4)#38 | 24.1%(+57.9)#1,260 |
| 38. | Griggsville | 81.4% | 23.6%(+57.8)#39 | 24.1%(+57.3)#1,287 |
| 39. | Anna | 80.7% | 23.6%(+57.1)#40 | 24.1%(+56.6)#1,306 |
| 40. | Verona | 80.0% | 23.6%(+56.4)#41 | 24.1%(+55.9)#1,333 |
| 41. | Rosiclare | 78.8% | 23.6%(+55.2)#42 | 24.1%(+54.7)#1,381 |
| 42. | Como | 78.6% | 23.6%(+55.0)#43 | 24.1%(+54.5)#1,388 |
| 43. | Gardner | 78.4% | 23.6%(+54.8)#44 | 24.1%(+54.4)#1,394 |
| 44. | Hutsonville | 77.8% | 23.6%(+54.2)#45 | 24.1%(+53.7)#1,421 |
| 45. | Ransom | 76.5% | 23.6%(+52.9)#46 | 24.1%(+52.4)#1,498 |
| 46. | Ashmore | 76.3% | 23.6%(+52.7)#47 | 24.1%(+52.2)#1,508 |
| 47. | Noble | 75.8% | 23.6%(+52.2)#48 | 24.1%(+51.7)#1,518 |
| 48. | Mulberry Grove | 75.0% | 23.6%(+51.4)#49 | 24.1%(+50.9)#1,541 |
| 49. | Hoffman | 75.0% | 23.6%(+51.4)#50 | 24.1%(+50.9)#1,543 |
| 50. | Table Grove | 75.0% | 23.6%(+51.4)#51 | 24.1%(+50.9)#1,560 |
| 51. | Jewett | 75.0% | 23.6%(+51.4)#52 | 24.1%(+50.9)#1,564 |
| 52. | Norris | 75.0% | 23.6%(+51.4)#53 | 24.1%(+50.9)#1,565 |
| 53. | Harvel | 75.0% | 23.6%(+51.4)#54 | 24.1%(+50.9)#1,572 |
| 54. | Eddyville | 75.0% | 23.6%(+51.4)#55 | 24.1%(+50.9)#1,595 |
| 55. | Eldorado | 74.9% | 23.6%(+51.3)#56 | 24.1%(+50.8)#1,600 |
| 56. | Creal Springs | 73.7% | 23.6%(+50.1)#57 | 24.1%(+49.6)#1,640 |
| 57. | Arlington | 71.4% | 23.6%(+47.8)#58 | 24.1%(+47.4)#1,768 |
| 58. | Kingston Mines | 71.4% | 23.6%(+47.8)#59 | 24.1%(+47.4)#1,769 |
| 59. | Maunie | 71.4% | 23.6%(+47.8)#60 | 24.1%(+47.4)#1,774 |
| 60. | Carthage | 71.2% | 23.6%(+47.6)#61 | 24.1%(+47.1)#1,781 |
| 61. | Barrington Hills | 71.1% | 23.6%(+47.5)#62 | 24.1%(+47.0)#1,788 |
| 62. | Vermont | 70.6% | 23.6%(+47.0)#63 | 24.1%(+46.5)#1,818 |
| 63. | Sheridan | 70.2% | 23.6%(+46.6)#64 | 24.1%(+46.1)#1,839 |
| 64. | Spillertown | 70.0% | 23.6%(+46.4)#65 | 24.1%(+45.9)#1,856 |
| 65. | Troy Grove | 70.0% | 23.6%(+46.4)#66 | 24.1%(+45.9)#1,860 |
| 66. | Ellsworth | 70.0% | 23.6%(+46.4)#67 | 24.1%(+45.9)#1,863 |
| 67. | Ophiem | 70.0% | 23.6%(+46.4)#68 | 24.1%(+45.9)#1,864 |
| 68. | Olive Branch | 68.0% | 23.6%(+44.4)#69 | 24.1%(+43.9)#2,021 |
| 69. | New Boston | 67.9% | 23.6%(+44.3)#70 | 24.1%(+43.8)#2,030 |
| 70. | Mettawa | 66.7% | 23.6%(+43.1)#71 | 24.1%(+42.6)#2,098 |
| 71. | Bureau Junction | 66.7% | 23.6%(+43.1)#72 | 24.1%(+42.6)#2,150 |
| 72. | Forest City | 66.7% | 23.6%(+43.1)#73 | 24.1%(+42.6)#2,167 |
| 73. | Ridott | 66.7% | 23.6%(+43.1)#74 | 24.1%(+42.6)#2,193 |
| 74. | Venice | 64.1% | 23.6%(+40.5)#75 | 24.1%(+40.0)#2,390 |
| 75. | Valier | 64.0% | 23.6%(+40.4)#76 | 24.1%(+39.9)#2,400 |
| 76. | Beecher City | 63.6% | 23.6%(+40.0)#77 | 24.1%(+39.6)#2,429 |
| 77. | Thebes | 63.6% | 23.6%(+40.0)#78 | 24.1%(+39.6)#2,432 |
| 78. | Grayville | 63.4% | 23.6%(+39.8)#79 | 24.1%(+39.3)#2,460 |
| 79. | Tower Hill | 63.2% | 23.6%(+39.6)#80 | 24.1%(+39.1)#2,479 |
| 80. | Norris City | 62.8% | 23.6%(+39.2)#81 | 24.1%(+38.7)#2,514 |
| 81. | Fithian | 62.5% | 23.6%(+38.9)#82 | 24.1%(+38.4)#2,545 |
| 82. | East Carondelet | 62.5% | 23.6%(+38.9)#83 | 24.1%(+38.4)#2,563 |
| 83. | Dana | 62.5% | 23.6%(+38.9)#84 | 24.1%(+38.4)#2,572 |
| 84. | Shawneetown | 62.3% | 23.6%(+38.7)#85 | 24.1%(+38.2)#2,584 |
| 85. | Dahlgren | 62.2% | 23.6%(+38.6)#86 | 24.1%(+38.1)#2,587 |
| 86. | Godley | 62.2% | 23.6%(+38.6)#87 | 24.1%(+38.1)#2,589 |
| 87. | Sumner | 62.2% | 23.6%(+38.6)#88 | 24.1%(+38.1)#2,592 |
| 88. | Wadsworth | 61.9% | 23.6%(+38.3)#89 | 24.1%(+37.8)#2,617 |
| 89. | Fayetteville | 61.9% | 23.6%(+38.3)#90 | 24.1%(+37.8)#2,621 |
| 90. | Towanda | 61.5% | 23.6%(+37.9)#91 | 24.1%(+37.5)#2,656 |
| 91. | Vermilion | 61.5% | 23.6%(+37.9)#92 | 24.1%(+37.5)#2,662 |
| 92. | Edinburg | 60.7% | 23.6%(+37.1)#93 | 24.1%(+36.6)#2,730 |
| 93. | Minonk | 60.7% | 23.6%(+37.1)#94 | 24.1%(+36.6)#2,737 |
| 94. | Tuscola | 60.2% | 23.6%(+36.6)#95 | 24.1%(+36.2)#2,776 |
| 95. | Saybrook | 60.0% | 23.6%(+36.4)#96 | 24.1%(+35.9)#2,806 |
| 96. | Coffeen | 60.0% | 23.6%(+36.4)#97 | 24.1%(+35.9)#2,808 |
| 97. | Cutler | 60.0% | 23.6%(+36.4)#98 | 24.1%(+35.9)#2,832 |
| 98. | Standard | 60.0% | 23.6%(+36.4)#99 | 24.1%(+35.9)#2,833 |
| 99. | Iroquois | 60.0% | 23.6%(+36.4)#100 | 24.1%(+35.9)#2,843 |
| 100. | Montrose | 60.0% | 23.6%(+36.4)#101 | 24.1%(+35.9)#2,845 |
Common Questions
What are the Top 10 Cities with the Highest Poverty Level Among Single Females in Illinois?
Top 10 Cities with the Highest Poverty Level Among Single Females in Illinois are:
#1
100.0%
#2
100.0%
#3
100.0%
#4
100.0%
#5
100.0%
#6
100.0%
#7
100.0%
#8
100.0%
#9
100.0%
#10
100.0%
What city has the Highest Poverty Level Among Single Females in Illinois?
Poplar Grove has the Highest Poverty Level Among Single Females in Illinois with 100.0%.
What is the Poverty Level Among Single Females in the State of Illinois?
Poverty Level Among Single Females in Illinois is 23.6%.
What is the Poverty Level Among Single Females in the United States?
Poverty Level Among Single Females in the United States is 24.1%.