Cities with the Highest Percentage of Immigrants from Peru in Illinois
RELATED REPORTS & OPTIONS
Peru
Illinois
Compare Cities
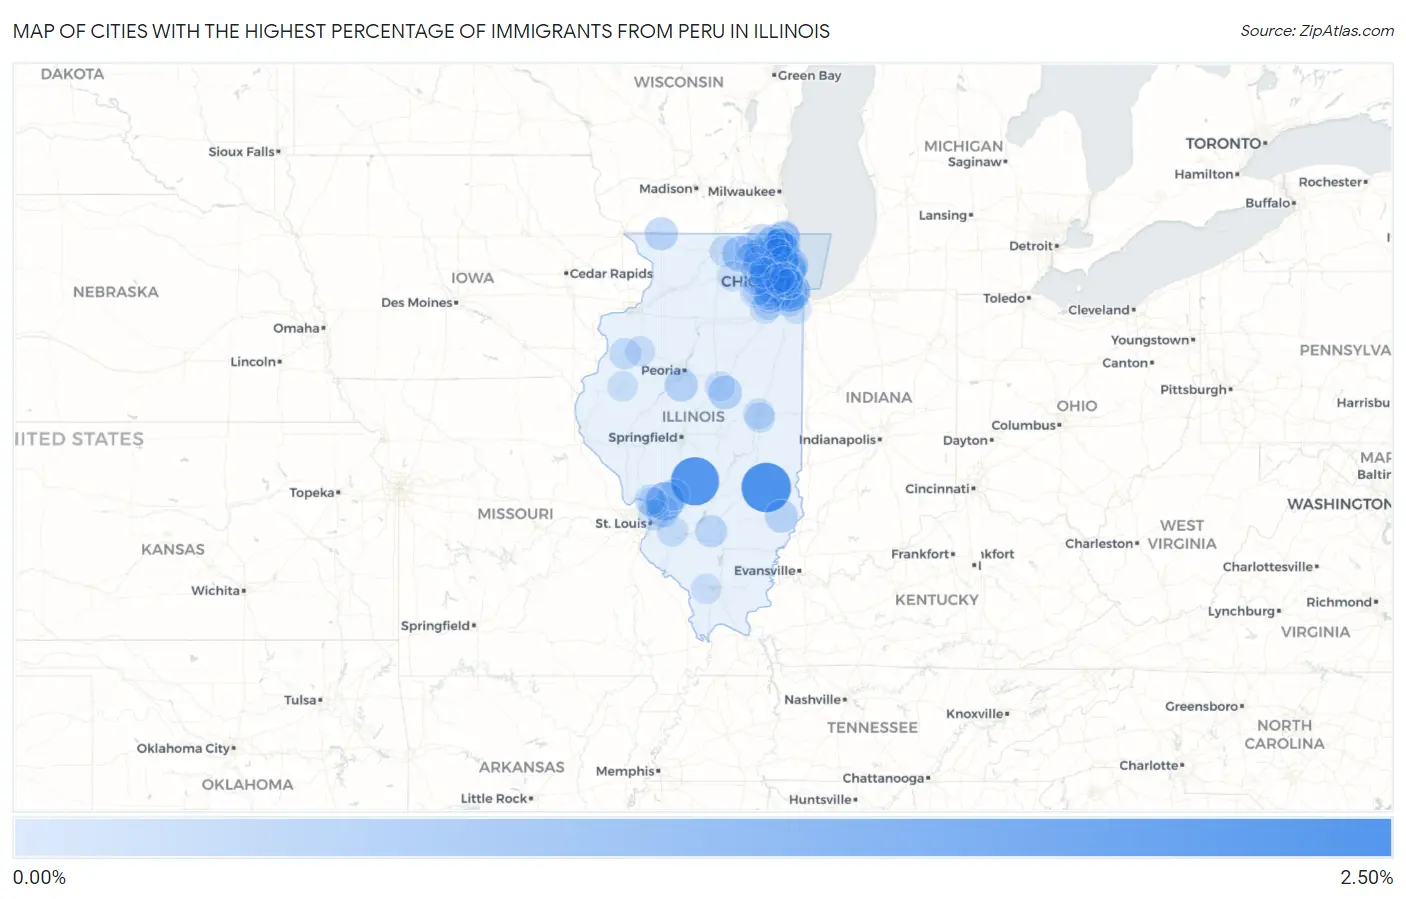
Map of Cities with the Highest Percentage of Immigrants from Peru in Illinois
0.00%
2.50%
Cities with the Highest Percentage of Immigrants from Peru in Illinois
| City | Peru | vs State | vs National | |
| 1. | Rose Hill | 2.50% | 0.064%(+2.44)#-1 | 0.14%(+2.36)#0 |
| 2. | Irving | 2.32% | 0.064%(+2.26)#0 | 0.14%(+2.18)#1 |
| 3. | Hometown | 1.30% | 0.064%(+1.24)#1 | 0.14%(+1.16)#2 |
| 4. | Holiday Shores | 1.07% | 0.064%(+1.00)#2 | 0.14%(+0.926)#3 |
| 5. | Green Oaks | 1.05% | 0.064%(+0.986)#3 | 0.14%(+0.910)#4 |
| 6. | Marengo | 0.67% | 0.064%(+0.605)#4 | 0.14%(+0.530)#5 |
| 7. | Indian Head Park | 0.65% | 0.064%(+0.582)#5 | 0.14%(+0.507)#6 |
| 8. | Kenilworth | 0.51% | 0.064%(+0.448)#6 | 0.14%(+0.373)#7 |
| 9. | Cary | 0.50% | 0.064%(+0.434)#7 | 0.14%(+0.358)#8 |
| 10. | Wheeling | 0.49% | 0.064%(+0.428)#8 | 0.14%(+0.353)#9 |
| 11. | Downs | 0.46% | 0.064%(+0.394)#9 | 0.14%(+0.318)#10 |
| 12. | Beach Park | 0.43% | 0.064%(+0.365)#10 | 0.14%(+0.289)#11 |
| 13. | Carol Stream | 0.42% | 0.064%(+0.352)#11 | 0.14%(+0.277)#12 |
| 14. | Melrose Park | 0.41% | 0.064%(+0.345)#12 | 0.14%(+0.270)#13 |
| 15. | South Pekin | 0.40% | 0.064%(+0.335)#13 | 0.14%(+0.259)#14 |
| 16. | Lake Bluff | 0.39% | 0.064%(+0.325)#14 | 0.14%(+0.249)#15 |
| 17. | Warren | 0.39% | 0.064%(+0.324)#15 | 0.14%(+0.248)#16 |
| 18. | Forest Park | 0.38% | 0.064%(+0.317)#16 | 0.14%(+0.242)#17 |
| 19. | Sumner | 0.37% | 0.064%(+0.309)#17 | 0.14%(+0.234)#18 |
| 20. | Lake In The Hills | 0.35% | 0.064%(+0.288)#39 | 0.14%(+0.213)#1,101 |
| 21. | Bensenville | 0.31% | 0.064%(+0.247)#40 | 0.14%(+0.171)#1,102 |
| 22. | Wood Dale | 0.31% | 0.064%(+0.245)#41 | 0.14%(+0.170)#1,103 |
| 23. | Stone Park | 0.31% | 0.064%(+0.243)#42 | 0.14%(+0.167)#1,104 |
| 24. | River Grove | 0.29% | 0.064%(+0.230)#43 | 0.14%(+0.155)#1,105 |
| 25. | Lincolnwood | 0.29% | 0.064%(+0.230)#44 | 0.14%(+0.155)#1,106 |
| 26. | Buffalo Grove | 0.29% | 0.064%(+0.230)#55 | 0.14%(+0.154)#1,515 |
| 27. | Centralia | 0.27% | 0.064%(+0.209)#56 | 0.14%(+0.133)#1,516 |
| 28. | Edwardsville | 0.27% | 0.064%(+0.206)#57 | 0.14%(+0.131)#1,517 |
| 29. | Hoffman Estates | 0.26% | 0.064%(+0.199)#58 | 0.14%(+0.124)#1,518 |
| 30. | Crest Hill | 0.25% | 0.064%(+0.187)#59 | 0.14%(+0.112)#1,519 |
| 31. | Pistakee Highlands | 0.24% | 0.064%(+0.179)#60 | 0.14%(+0.104)#1,520 |
| 32. | Skokie | 0.24% | 0.064%(+0.179)#61 | 0.14%(+0.104)#1,521 |
| 33. | Streamwood | 0.21% | 0.064%(+0.143)#62 | 0.14%(+0.068)#1,522 |
| 34. | Palatine | 0.21% | 0.064%(+0.143)#63 | 0.14%(+0.067)#1,523 |
| 35. | Zion | 0.20% | 0.064%(+0.140)#64 | 0.14%(+0.064)#1,524 |
| 36. | Staunton | 0.20% | 0.064%(+0.133)#65 | 0.14%(+0.057)#1,525 |
| 37. | Arlington Heights | 0.17% | 0.064%(+0.104)#66 | 0.14%(+0.029)#1,526 |
| 38. | Lombard | 0.17% | 0.064%(+0.102)#67 | 0.14%(+0.026)#1,527 |
| 39. | Monmouth | 0.16% | 0.064%(+0.096)#68 | 0.14%(+0.020)#1,528 |
| 40. | Countryside | 0.16% | 0.064%(+0.094)#69 | 0.14%(+0.019)#1,529 |
| 41. | Lindenhurst | 0.15% | 0.064%(+0.082)#70 | 0.14%(+0.006)#1,530 |
| 42. | Belvidere | 0.15% | 0.064%(+0.082)#71 | 0.14%(+0.006)#1,531 |
| 43. | Hanover Park | 0.14% | 0.064%(+0.078)#72 | 0.14%(+0.003)#1,532 |
| 44. | Granite City | 0.14% | 0.064%(+0.077)#73 | 0.14%(+0.001)#1,533 |
| 45. | Schaumburg | 0.14% | 0.064%(+0.077)#74 | 0.14%(+0.001)#1,534 |
| 46. | Evergreen Park | 0.14% | 0.064%(+0.073)#75 | 0.14%(-0.002)#1,535 |
| 47. | Huntley | 0.13% | 0.064%(+0.070)#76 | 0.14%(-0.006)#1,536 |
| 48. | Chicago | 0.13% | 0.064%(+0.069)#77 | 0.14%(-0.006)#1,537 |
| 49. | Chicago Ridge | 0.13% | 0.064%(+0.069)#78 | 0.14%(-0.006)#1,538 |
| 50. | Deerfield | 0.13% | 0.064%(+0.066)#79 | 0.14%(-0.009)#1,539 |
| 51. | Godfrey | 0.13% | 0.064%(+0.065)#80 | 0.14%(-0.010)#1,540 |
| 52. | Mascoutah | 0.13% | 0.064%(+0.062)#81 | 0.14%(-0.014)#1,541 |
| 53. | Berwyn | 0.13% | 0.064%(+0.062)#82 | 0.14%(-0.014)#1,542 |
| 54. | Highland Park | 0.12% | 0.064%(+0.059)#83 | 0.14%(-0.017)#1,543 |
| 55. | Naperville | 0.12% | 0.064%(+0.058)#84 | 0.14%(-0.017)#1,569 |
| 56. | Evanston | 0.12% | 0.064%(+0.051)#85 | 0.14%(-0.024)#1,570 |
| 57. | Waukegan | 0.11% | 0.064%(+0.046)#86 | 0.14%(-0.030)#1,586 |
| 58. | Oak Forest | 0.11% | 0.064%(+0.043)#87 | 0.14%(-0.033)#1,587 |
| 59. | Franklin Park | 0.10% | 0.064%(+0.039)#88 | 0.14%(-0.036)#1,588 |
| 60. | Lemont | 0.10% | 0.064%(+0.039)#89 | 0.14%(-0.037)#1,589 |
| 61. | Champaign | 0.10% | 0.064%(+0.036)#90 | 0.14%(-0.039)#1,590 |
| 62. | Wheaton | 0.095% | 0.064%(+0.031)#91 | 0.14%(-0.044)#1,591 |
| 63. | Oak Park | 0.095% | 0.064%(+0.031)#92 | 0.14%(-0.045)#1,592 |
| 64. | North Chicago | 0.091% | 0.064%(+0.027)#93 | 0.14%(-0.049)#1,593 |
| 65. | La Grange Park | 0.090% | 0.064%(+0.026)#94 | 0.14%(-0.049)#1,594 |
| 66. | Rolling Meadows | 0.087% | 0.064%(+0.023)#95 | 0.14%(-0.052)#1,595 |
| 67. | Gurnee | 0.085% | 0.064%(+0.021)#96 | 0.14%(-0.054)#1,596 |
| 68. | Glendale Heights | 0.085% | 0.064%(+0.021)#97 | 0.14%(-0.055)#1,597 |
| 69. | Mundelein | 0.082% | 0.064%(+0.018)#98 | 0.14%(-0.057)#1,598 |
| 70. | West Chicago | 0.074% | 0.064%(+0.010)#99 | 0.14%(-0.065)#1,599 |
| 71. | Elk Grove Village | 0.071% | 0.064%(+0.007)#100 | 0.14%(-0.069)#1,600 |
| 72. | Alton | 0.070% | 0.064%(+0.006)#101 | 0.14%(-0.069)#1,601 |
| 73. | Romeoville | 0.070% | 0.064%(+0.006)#102 | 0.14%(-0.070)#1,602 |
| 74. | Savoy | 0.069% | 0.064%(+0.005)#103 | 0.14%(-0.070)#1,603 |
| 75. | Northlake | 0.063% | 0.064%(-0.001)#104 | 0.14%(-0.076)#1,604 |
| 76. | Lisle | 0.060% | 0.064%(-0.004)#105 | 0.14%(-0.080)#1,605 |
| 77. | Round Lake Beach | 0.055% | 0.064%(-0.009)#106 | 0.14%(-0.084)#1,606 |
| 78. | Dekalb | 0.054% | 0.064%(-0.010)#107 | 0.14%(-0.085)#1,607 |
| 79. | Bloomingdale | 0.053% | 0.064%(-0.010)#108 | 0.14%(-0.086)#1,608 |
| 80. | Montgomery | 0.053% | 0.064%(-0.011)#109 | 0.14%(-0.086)#1,609 |
| 81. | Villa Park | 0.053% | 0.064%(-0.011)#110 | 0.14%(-0.087)#1,610 |
| 82. | Joliet | 0.051% | 0.064%(-0.013)#111 | 0.14%(-0.088)#1,611 |
| 83. | Chicago Heights | 0.048% | 0.064%(-0.016)#112 | 0.14%(-0.092)#1,612 |
| 84. | Galesburg | 0.040% | 0.064%(-0.024)#113 | 0.14%(-0.099)#1,613 |
| 85. | Macomb | 0.039% | 0.064%(-0.025)#114 | 0.14%(-0.100)#1,614 |
| 86. | Bolingbrook | 0.038% | 0.064%(-0.026)#115 | 0.14%(-0.101)#1,615 |
| 87. | Vernon Hills | 0.037% | 0.064%(-0.027)#116 | 0.14%(-0.102)#1,616 |
| 88. | Northbrook | 0.034% | 0.064%(-0.030)#117 | 0.14%(-0.105)#1,617 |
| 89. | Aurora | 0.033% | 0.064%(-0.031)#118 | 0.14%(-0.106)#1,618 |
| 90. | Geneva | 0.033% | 0.064%(-0.031)#119 | 0.14%(-0.107)#1,619 |
| 91. | Carbondale | 0.032% | 0.064%(-0.032)#120 | 0.14%(-0.108)#1,620 |
| 92. | Westchester | 0.030% | 0.064%(-0.034)#121 | 0.14%(-0.109)#1,621 |
| 93. | Elmwood Park | 0.029% | 0.064%(-0.035)#122 | 0.14%(-0.111)#1,622 |
| 94. | Cicero | 0.027% | 0.064%(-0.037)#123 | 0.14%(-0.112)#1,623 |
| 95. | Elgin | 0.027% | 0.064%(-0.037)#124 | 0.14%(-0.112)#1,624 |
| 96. | Carpentersville | 0.026% | 0.064%(-0.038)#125 | 0.14%(-0.113)#1,625 |
| 97. | Bartlett | 0.024% | 0.064%(-0.039)#126 | 0.14%(-0.115)#1,626 |
| 98. | Bloomington | 0.024% | 0.064%(-0.040)#127 | 0.14%(-0.115)#1,627 |
| 99. | Woodstock | 0.023% | 0.064%(-0.041)#128 | 0.14%(-0.116)#1,628 |
| 100. | Elmhurst | 0.022% | 0.064%(-0.042)#129 | 0.14%(-0.117)#1,629 |
Common Questions
What are the Top 10 Cities with the Highest Percentage of Immigrants from Peru in Illinois?
Top 10 Cities with the Highest Percentage of Immigrants from Peru in Illinois are:
#1
2.50%
#2
2.32%
#3
1.30%
#4
1.07%
#5
1.05%
#6
0.67%
#7
0.65%
#8
0.51%
#9
0.50%
#10
0.49%
What city has the Highest Percentage of Immigrants from Peru in Illinois?
Rose Hill has the Highest Percentage of Immigrants from Peru in Illinois with 2.50%.
What is the Percentage of Immigrants from Peru in the State of Illinois?
Percentage of Immigrants from Peru in Illinois is 0.064%.
What is the Percentage of Immigrants from Peru in the United States?
Percentage of Immigrants from Peru in the United States is 0.14%.