Cities with the Most Immigrants from Caribbean in Illinois
RELATED REPORTS & OPTIONS
Caribbean
Illinois
Compare Cities
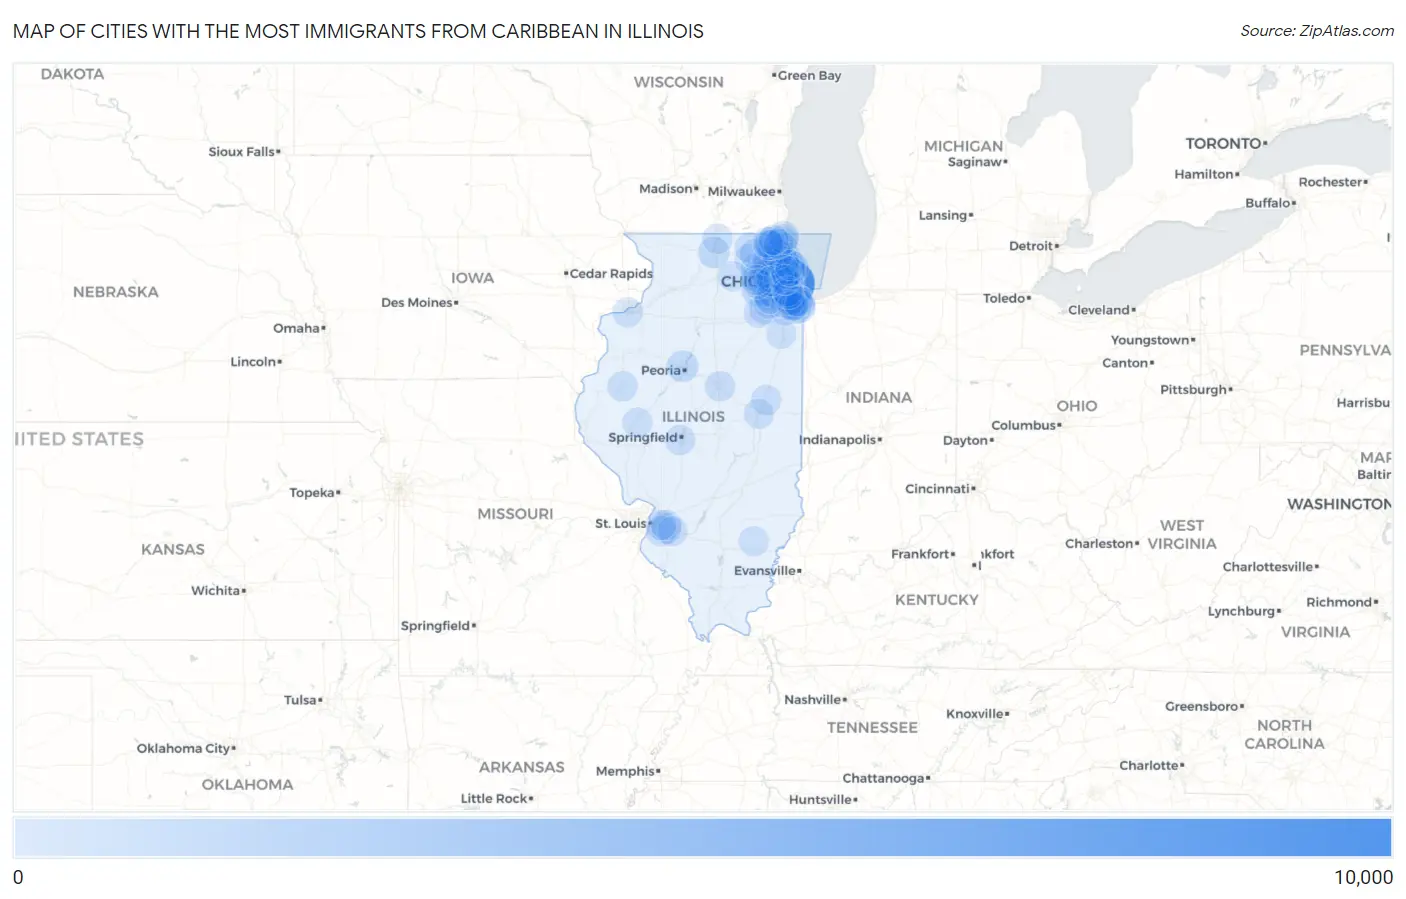
Map of Cities with the Most Immigrants from Caribbean in Illinois
0
10,000
Cities with the Most Immigrants from Caribbean in Illinois
| City | Caribbean | vs State | vs National | |
| 1. | Chicago | 9,267 | 26,225(35.34%)#1 | 4,544,093(0.20%)#76 |
| 2. | Evanston | 1,026 | 26,225(3.91%)#2 | 4,544,093(0.02%)#415 |
| 3. | Skokie | 812 | 26,225(3.10%)#3 | 4,544,093(0.02%)#487 |
| 4. | Aurora | 759 | 26,225(2.89%)#4 | 4,544,093(0.02%)#514 |
| 5. | Peoria | 688 | 26,225(2.62%)#5 | 4,544,093(0.02%)#558 |
| 6. | Rockford | 644 | 26,225(2.46%)#6 | 4,544,093(0.01%)#578 |
| 7. | Joliet | 413 | 26,225(1.57%)#7 | 4,544,093(0.01%)#778 |
| 8. | Bolingbrook | 409 | 26,225(1.56%)#8 | 4,544,093(0.01%)#786 |
| 9. | Waukegan | 338 | 26,225(1.29%)#9 | 4,544,093(0.01%)#911 |
| 10. | West Chicago | 295 | 26,225(1.12%)#10 | 4,544,093(0.01%)#1,007 |
| 11. | Des Plaines | 276 | 26,225(1.05%)#11 | 4,544,093(0.01%)#1,051 |
| 12. | Melrose Park | 269 | 26,225(1.03%)#12 | 4,544,093(0.01%)#1,080 |
| 13. | Cicero | 257 | 26,225(0.98%)#13 | 4,544,093(0.01%)#1,118 |
| 14. | Carol Stream | 244 | 26,225(0.93%)#14 | 4,544,093(0.01%)#1,162 |
| 15. | Niles | 220 | 26,225(0.84%)#15 | 4,544,093(0.00%)#1,251 |
| 16. | Huntley | 195 | 26,225(0.74%)#16 | 4,544,093(0.00%)#1,363 |
| 17. | Hanover Park | 193 | 26,225(0.74%)#17 | 4,544,093(0.00%)#1,376 |
| 18. | Naperville | 182 | 26,225(0.69%)#18 | 4,544,093(0.00%)#1,423 |
| 19. | Schaumburg | 181 | 26,225(0.69%)#19 | 4,544,093(0.00%)#1,430 |
| 20. | Springfield | 177 | 26,225(0.67%)#20 | 4,544,093(0.00%)#1,445 |
| 21. | Bensenville | 173 | 26,225(0.66%)#21 | 4,544,093(0.00%)#1,470 |
| 22. | Zion | 169 | 26,225(0.64%)#22 | 4,544,093(0.00%)#1,501 |
| 23. | Bloomington | 168 | 26,225(0.64%)#23 | 4,544,093(0.00%)#1,508 |
| 24. | Grayslake | 161 | 26,225(0.61%)#24 | 4,544,093(0.00%)#1,554 |
| 25. | Prospect Heights | 156 | 26,225(0.59%)#25 | 4,544,093(0.00%)#1,582 |
| 26. | Lombard | 155 | 26,225(0.59%)#26 | 4,544,093(0.00%)#1,588 |
| 27. | Mount Prospect | 149 | 26,225(0.57%)#27 | 4,544,093(0.00%)#1,624 |
| 28. | Elgin | 144 | 26,225(0.55%)#28 | 4,544,093(0.00%)#1,655 |
| 29. | Palatine | 136 | 26,225(0.52%)#29 | 4,544,093(0.00%)#1,713 |
| 30. | Woodstock | 136 | 26,225(0.52%)#30 | 4,544,093(0.00%)#1,717 |
| 31. | Belleville | 130 | 26,225(0.50%)#31 | 4,544,093(0.00%)#1,772 |
| 32. | Oak Park | 114 | 26,225(0.43%)#32 | 4,544,093(0.00%)#1,918 |
| 33. | Glenview | 112 | 26,225(0.43%)#33 | 4,544,093(0.00%)#1,937 |
| 34. | Berwyn | 111 | 26,225(0.42%)#34 | 4,544,093(0.00%)#1,952 |
| 35. | Frankfort | 111 | 26,225(0.42%)#35 | 4,544,093(0.00%)#1,958 |
| 36. | Mundelein | 109 | 26,225(0.42%)#36 | 4,544,093(0.00%)#1,983 |
| 37. | Rantoul | 108 | 26,225(0.41%)#37 | 4,544,093(0.00%)#1,991 |
| 38. | Buffalo Grove | 107 | 26,225(0.41%)#38 | 4,544,093(0.00%)#1,999 |
| 39. | Minooka | 107 | 26,225(0.41%)#39 | 4,544,093(0.00%)#2,002 |
| 40. | Maywood | 106 | 26,225(0.40%)#40 | 4,544,093(0.00%)#2,010 |
| 41. | Dolton | 104 | 26,225(0.40%)#41 | 4,544,093(0.00%)#2,027 |
| 42. | Lynwood | 99 | 26,225(0.38%)#42 | 4,544,093(0.00%)#2,101 |
| 43. | Bellwood | 93 | 26,225(0.35%)#43 | 4,544,093(0.00%)#2,191 |
| 44. | Calumet City | 92 | 26,225(0.35%)#44 | 4,544,093(0.00%)#2,198 |
| 45. | Lansing | 91 | 26,225(0.35%)#45 | 4,544,093(0.00%)#2,215 |
| 46. | St Charles | 90 | 26,225(0.34%)#46 | 4,544,093(0.00%)#2,232 |
| 47. | Country Club Hills | 89 | 26,225(0.34%)#47 | 4,544,093(0.00%)#2,248 |
| 48. | Wheaton | 88 | 26,225(0.34%)#48 | 4,544,093(0.00%)#2,254 |
| 49. | Hoffman Estates | 87 | 26,225(0.33%)#49 | 4,544,093(0.00%)#2,270 |
| 50. | Gages Lake | 86 | 26,225(0.33%)#50 | 4,544,093(0.00%)#2,285 |
| 51. | Elmwood Park | 85 | 26,225(0.32%)#51 | 4,544,093(0.00%)#2,298 |
| 52. | Harvey | 85 | 26,225(0.32%)#52 | 4,544,093(0.00%)#2,299 |
| 53. | Macomb | 85 | 26,225(0.32%)#53 | 4,544,093(0.00%)#2,300 |
| 54. | Shiloh | 82 | 26,225(0.31%)#54 | 4,544,093(0.00%)#2,344 |
| 55. | Rolling Meadows | 81 | 26,225(0.31%)#55 | 4,544,093(0.00%)#2,351 |
| 56. | O Fallon | 76 | 26,225(0.29%)#56 | 4,544,093(0.00%)#2,437 |
| 57. | Crystal Lake | 74 | 26,225(0.28%)#57 | 4,544,093(0.00%)#2,480 |
| 58. | Highland Park | 74 | 26,225(0.28%)#58 | 4,544,093(0.00%)#2,481 |
| 59. | Crest Hill | 71 | 26,225(0.27%)#59 | 4,544,093(0.00%)#2,536 |
| 60. | Harwood Heights | 71 | 26,225(0.27%)#60 | 4,544,093(0.00%)#2,540 |
| 61. | North Chicago | 69 | 26,225(0.26%)#61 | 4,544,093(0.00%)#2,562 |
| 62. | Woodridge | 68 | 26,225(0.26%)#62 | 4,544,093(0.00%)#2,580 |
| 63. | Arlington Heights | 67 | 26,225(0.26%)#63 | 4,544,093(0.00%)#2,601 |
| 64. | Glendale Heights | 66 | 26,225(0.25%)#64 | 4,544,093(0.00%)#2,622 |
| 65. | Northbrook | 63 | 26,225(0.24%)#65 | 4,544,093(0.00%)#2,668 |
| 66. | Beardstown | 62 | 26,225(0.24%)#66 | 4,544,093(0.00%)#2,704 |
| 67. | Elmhurst | 60 | 26,225(0.23%)#67 | 4,544,093(0.00%)#2,742 |
| 68. | Rock Island | 60 | 26,225(0.23%)#68 | 4,544,093(0.00%)#2,746 |
| 69. | Chicago Heights | 59 | 26,225(0.22%)#69 | 4,544,093(0.00%)#2,769 |
| 70. | Homewood | 55 | 26,225(0.21%)#70 | 4,544,093(0.00%)#2,865 |
| 71. | Round Lake Beach | 54 | 26,225(0.21%)#71 | 4,544,093(0.00%)#2,887 |
| 72. | Dekalb | 53 | 26,225(0.20%)#72 | 4,544,093(0.00%)#2,912 |
| 73. | Roscoe | 53 | 26,225(0.20%)#73 | 4,544,093(0.00%)#2,918 |
| 74. | Tinley Park | 51 | 26,225(0.19%)#74 | 4,544,093(0.00%)#2,962 |
| 75. | Park Ridge | 49 | 26,225(0.19%)#75 | 4,544,093(0.00%)#3,013 |
| 76. | Barrington | 49 | 26,225(0.19%)#76 | 4,544,093(0.00%)#3,020 |
| 77. | Midlothian | 48 | 26,225(0.18%)#77 | 4,544,093(0.00%)#3,048 |
| 78. | Vernon Hills | 47 | 26,225(0.18%)#78 | 4,544,093(0.00%)#3,073 |
| 79. | South Holland | 47 | 26,225(0.18%)#79 | 4,544,093(0.00%)#3,076 |
| 80. | Bourbonnais | 47 | 26,225(0.18%)#80 | 4,544,093(0.00%)#3,078 |
| 81. | Romeoville | 46 | 26,225(0.18%)#81 | 4,544,093(0.00%)#3,105 |
| 82. | Glen Ellyn | 45 | 26,225(0.17%)#82 | 4,544,093(0.00%)#3,133 |
| 83. | Batavia | 44 | 26,225(0.17%)#83 | 4,544,093(0.00%)#3,160 |
| 84. | Champaign | 43 | 26,225(0.16%)#84 | 4,544,093(0.00%)#3,196 |
| 85. | Burbank | 43 | 26,225(0.16%)#85 | 4,544,093(0.00%)#3,200 |
| 86. | Beach Park | 43 | 26,225(0.16%)#86 | 4,544,093(0.00%)#3,209 |
| 87. | Flossmoor | 43 | 26,225(0.16%)#87 | 4,544,093(0.00%)#3,213 |
| 88. | Oak Lawn | 42 | 26,225(0.16%)#88 | 4,544,093(0.00%)#3,227 |
| 89. | River Forest | 42 | 26,225(0.16%)#89 | 4,544,093(0.00%)#3,239 |
| 90. | Fairfield | 42 | 26,225(0.16%)#90 | 4,544,093(0.00%)#3,248 |
| 91. | Mascoutah | 41 | 26,225(0.16%)#91 | 4,544,093(0.00%)#3,280 |
| 92. | Hainesville | 41 | 26,225(0.16%)#92 | 4,544,093(0.00%)#3,287 |
| 93. | Fairview Heights | 40 | 26,225(0.15%)#93 | 4,544,093(0.00%)#3,302 |
| 94. | Long Lake | 40 | 26,225(0.15%)#94 | 4,544,093(0.00%)#3,314 |
| 95. | Wilmette | 39 | 26,225(0.15%)#95 | 4,544,093(0.00%)#3,323 |
| 96. | Round Lake | 39 | 26,225(0.15%)#96 | 4,544,093(0.00%)#3,327 |
| 97. | Geneva | 38 | 26,225(0.14%)#97 | 4,544,093(0.00%)#3,361 |
| 98. | Gurnee | 37 | 26,225(0.14%)#98 | 4,544,093(0.00%)#3,397 |
| 99. | Lindenhurst | 36 | 26,225(0.14%)#99 | 4,544,093(0.00%)#3,437 |
| 100. | Lincolnwood | 36 | 26,225(0.14%)#100 | 4,544,093(0.00%)#3,439 |
Common Questions
What are the Top 10 Cities with the Most Immigrants from Caribbean in Illinois?
Top 10 Cities with the Most Immigrants from Caribbean in Illinois are:
#1
9,267
#2
1,026
#3
812
#4
759
#5
688
#6
644
#7
413
#8
409
#9
338
#10
295
What city has the Most Immigrants from Caribbean in Illinois?
Chicago has the Most Immigrants from Caribbean in Illinois with 9,267.
What is the Total Immigrants from Caribbean in the State of Illinois?
Total Immigrants from Caribbean in Illinois is 26,225.
What is the Total Immigrants from Caribbean in the United States?
Total Immigrants from Caribbean in the United States is 4,544,093.