Cities with the Highest Percentage of Population with a Degree in Computers and Mathematics in Illinois
RELATED REPORTS & OPTIONS
Computers and Mathematics
Illinois
Compare Cities
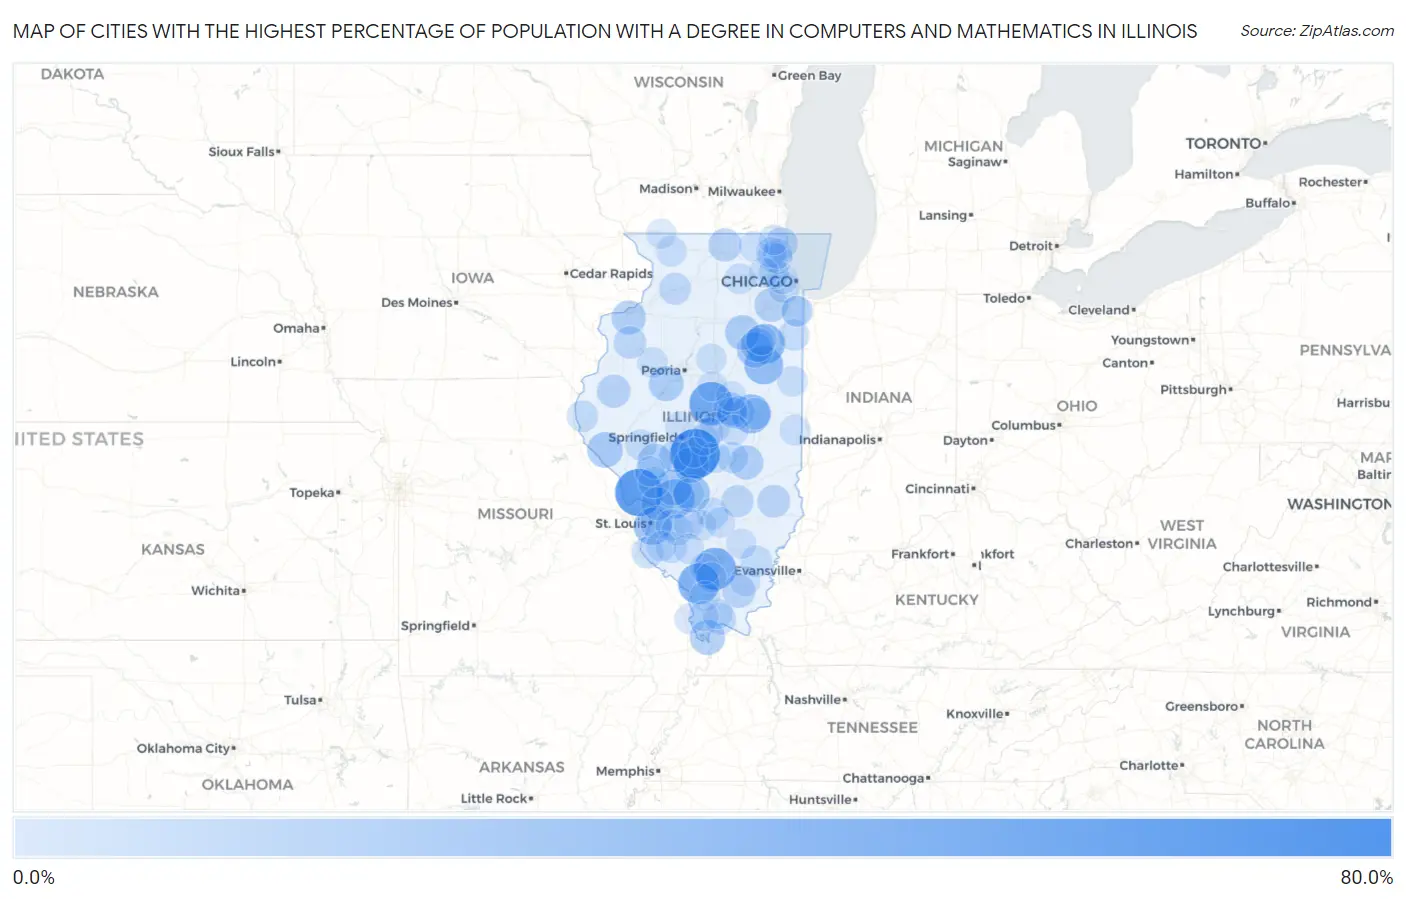
Map of Cities with the Highest Percentage of Population with a Degree in Computers and Mathematics in Illinois
0.0%
80.0%
Cities with the Highest Percentage of Population with a Degree in Computers and Mathematics in Illinois
| City | % Graduates | vs State | vs National | |
| 1. | Jeisyville | 75.0% | 5.1%(+69.9)#1 | 4.9%(+70.1)#46 |
| 2. | Otterville | 66.7% | 5.1%(+61.6)#2 | 4.9%(+61.8)#59 |
| 3. | Waynesville | 55.0% | 5.1%(+49.9)#3 | 4.9%(+50.1)#86 |
| 4. | North City | 49.0% | 5.1%(+43.9)#4 | 4.9%(+44.1)#121 |
| 5. | Harrison | 46.6% | 5.1%(+41.5)#5 | 4.9%(+41.7)#130 |
| 6. | Preemption | 42.3% | 5.1%(+37.3)#6 | 4.9%(+37.4)#149 |
| 7. | Buckingham | 41.7% | 5.1%(+36.6)#7 | 4.9%(+36.8)#152 |
| 8. | Gulfport | 40.0% | 5.1%(+34.9)#8 | 4.9%(+35.1)#168 |
| 9. | Livingston | 38.8% | 5.1%(+33.7)#9 | 4.9%(+33.9)#180 |
| 10. | Seymour | 38.2% | 5.1%(+33.2)#10 | 4.9%(+33.3)#185 |
| 11. | Blairsville | 38.1% | 5.1%(+33.0)#11 | 4.9%(+33.2)#188 |
| 12. | Piper City | 37.7% | 5.1%(+32.7)#12 | 4.9%(+32.8)#189 |
| 13. | Sauget | 33.3% | 5.1%(+28.3)#13 | 4.9%(+28.4)#235 |
| 14. | Donnellson | 33.3% | 5.1%(+28.3)#14 | 4.9%(+28.4)#243 |
| 15. | Eagarville | 29.4% | 5.1%(+24.4)#15 | 4.9%(+24.5)#299 |
| 16. | Morrisonville | 27.7% | 5.1%(+22.6)#16 | 4.9%(+22.8)#340 |
| 17. | El Dara | 27.3% | 5.1%(+22.2)#17 | 4.9%(+22.4)#349 |
| 18. | Emington | 27.3% | 5.1%(+22.2)#18 | 4.9%(+22.4)#352 |
| 19. | Edgington | 25.9% | 5.1%(+20.9)#19 | 4.9%(+21.0)#384 |
| 20. | Cairo | 25.8% | 5.1%(+20.8)#20 | 4.9%(+20.9)#388 |
| 21. | Banner | 25.0% | 5.1%(+19.9)#21 | 4.9%(+20.1)#421 |
| 22. | Scottville | 25.0% | 5.1%(+19.9)#22 | 4.9%(+20.1)#424 |
| 23. | Kinsman | 25.0% | 5.1%(+19.9)#23 | 4.9%(+20.1)#427 |
| 24. | Willow Lake | 23.1% | 5.1%(+18.0)#24 | 4.9%(+18.2)#474 |
| 25. | Gays | 22.7% | 5.1%(+17.7)#25 | 4.9%(+17.8)#493 |
| 26. | Coyne Center | 22.4% | 5.1%(+17.4)#26 | 4.9%(+17.5)#498 |
| 27. | Campus | 21.7% | 5.1%(+16.7)#27 | 4.9%(+16.8)#530 |
| 28. | Fairmont | 21.2% | 5.1%(+16.1)#28 | 4.9%(+16.3)#551 |
| 29. | De Witt | 20.0% | 5.1%(+14.9)#29 | 4.9%(+15.1)#608 |
| 30. | Tennessee | 20.0% | 5.1%(+14.9)#30 | 4.9%(+15.1)#614 |
| 31. | Carrier Mills | 19.9% | 5.1%(+14.8)#31 | 4.9%(+15.0)#627 |
| 32. | Timberlane | 19.5% | 5.1%(+14.5)#32 | 4.9%(+14.6)#643 |
| 33. | Washington Park | 19.0% | 5.1%(+13.9)#33 | 4.9%(+14.1)#673 |
| 34. | Rosewood Heights | 18.9% | 5.1%(+13.9)#34 | 4.9%(+14.0)#680 |
| 35. | Ste Marie | 18.4% | 5.1%(+13.4)#35 | 4.9%(+13.5)#720 |
| 36. | De Land | 18.2% | 5.1%(+13.1)#36 | 4.9%(+13.3)#734 |
| 37. | Park City | 18.0% | 5.1%(+13.0)#37 | 4.9%(+13.1)#743 |
| 38. | Alexis | 17.2% | 5.1%(+12.1)#38 | 4.9%(+12.3)#812 |
| 39. | Edgewood | 16.7% | 5.1%(+11.6)#39 | 4.9%(+11.8)#857 |
| 40. | Thayer | 16.4% | 5.1%(+11.4)#40 | 4.9%(+11.5)#890 |
| 41. | Como | 15.7% | 5.1%(+10.7)#41 | 4.9%(+10.8)#961 |
| 42. | Maeystown | 15.4% | 5.1%(+10.3)#42 | 4.9%(+10.5)#1,000 |
| 43. | Karnak | 15.2% | 5.1%(+10.2)#43 | 4.9%(+10.3)#1,021 |
| 44. | Bondville | 14.8% | 5.1%(+9.76)#44 | 4.9%(+9.92)#1,056 |
| 45. | Patoka | 14.5% | 5.1%(+9.44)#45 | 4.9%(+9.60)#1,087 |
| 46. | Enfield | 14.3% | 5.1%(+9.23)#46 | 4.9%(+9.39)#1,114 |
| 47. | Mccook | 14.3% | 5.1%(+9.23)#47 | 4.9%(+9.39)#1,123 |
| 48. | Findlay | 13.7% | 5.1%(+8.67)#48 | 4.9%(+8.83)#1,201 |
| 49. | Ursa | 13.6% | 5.1%(+8.58)#49 | 4.9%(+8.74)#1,213 |
| 50. | Lebanon | 13.5% | 5.1%(+8.42)#50 | 4.9%(+8.58)#1,242 |
| 51. | Medora | 13.3% | 5.1%(+8.28)#51 | 4.9%(+8.44)#1,267 |
| 52. | Lynnville | 13.3% | 5.1%(+8.28)#52 | 4.9%(+8.44)#1,278 |
| 53. | Lenzburg | 13.2% | 5.1%(+8.10)#53 | 4.9%(+8.26)#1,306 |
| 54. | New Baden | 13.1% | 5.1%(+8.03)#54 | 4.9%(+8.20)#1,318 |
| 55. | Momence | 13.0% | 5.1%(+7.91)#55 | 4.9%(+8.07)#1,344 |
| 56. | Assumption | 13.0% | 5.1%(+7.91)#56 | 4.9%(+8.07)#1,346 |
| 57. | Mount Auburn | 12.8% | 5.1%(+7.76)#57 | 4.9%(+7.93)#1,369 |
| 58. | Steger | 12.8% | 5.1%(+7.76)#58 | 4.9%(+7.92)#1,372 |
| 59. | Stone Park | 12.4% | 5.1%(+7.31)#59 | 4.9%(+7.48)#1,463 |
| 60. | Warrensburg | 12.0% | 5.1%(+6.97)#60 | 4.9%(+7.13)#1,521 |
| 61. | Weldon | 12.0% | 5.1%(+6.94)#61 | 4.9%(+7.11)#1,528 |
| 62. | Pearl City | 11.9% | 5.1%(+6.85)#62 | 4.9%(+7.01)#1,546 |
| 63. | Du Quoin | 11.8% | 5.1%(+6.72)#63 | 4.9%(+6.88)#1,569 |
| 64. | Ridge Farm | 11.8% | 5.1%(+6.71)#64 | 4.9%(+6.87)#1,572 |
| 65. | East Cape Girardeau | 11.8% | 5.1%(+6.71)#65 | 4.9%(+6.87)#1,578 |
| 66. | Panama | 11.8% | 5.1%(+6.71)#66 | 4.9%(+6.87)#1,579 |
| 67. | Maple Park | 11.7% | 5.1%(+6.65)#67 | 4.9%(+6.81)#1,602 |
| 68. | Wellington | 11.5% | 5.1%(+6.48)#68 | 4.9%(+6.64)#1,641 |
| 69. | Itasca | 11.5% | 5.1%(+6.46)#69 | 4.9%(+6.63)#1,647 |
| 70. | Buffalo Grove | 11.3% | 5.1%(+6.29)#70 | 4.9%(+6.45)#1,686 |
| 71. | Kildeer | 11.2% | 5.1%(+6.14)#71 | 4.9%(+6.30)#1,715 |
| 72. | Cypress | 11.1% | 5.1%(+6.05)#72 | 4.9%(+6.22)#1,761 |
| 73. | Maquon | 11.1% | 5.1%(+6.05)#73 | 4.9%(+6.22)#1,763 |
| 74. | Huey | 11.1% | 5.1%(+6.05)#74 | 4.9%(+6.22)#1,765 |
| 75. | Cerro Gordo | 11.0% | 5.1%(+5.99)#75 | 4.9%(+6.15)#1,781 |
| 76. | Wayne City | 11.0% | 5.1%(+5.96)#76 | 4.9%(+6.12)#1,784 |
| 77. | Breese | 10.9% | 5.1%(+5.85)#77 | 4.9%(+6.01)#1,813 |
| 78. | South Chicago Heights | 10.9% | 5.1%(+5.85)#78 | 4.9%(+6.01)#1,815 |
| 79. | Hawthorn Woods | 10.9% | 5.1%(+5.83)#79 | 4.9%(+5.99)#1,822 |
| 80. | Hecker | 10.8% | 5.1%(+5.71)#80 | 4.9%(+5.88)#1,852 |
| 81. | Oakdale | 10.7% | 5.1%(+5.66)#81 | 4.9%(+5.82)#1,872 |
| 82. | Royalton | 10.7% | 5.1%(+5.64)#82 | 4.9%(+5.80)#1,877 |
| 83. | Salem | 10.7% | 5.1%(+5.63)#83 | 4.9%(+5.80)#1,878 |
| 84. | Kincaid | 10.7% | 5.1%(+5.61)#84 | 4.9%(+5.77)#1,886 |
| 85. | Benson | 10.5% | 5.1%(+5.47)#85 | 4.9%(+5.63)#1,939 |
| 86. | Raleigh | 10.5% | 5.1%(+5.47)#86 | 4.9%(+5.63)#1,942 |
| 87. | Reddick | 10.5% | 5.1%(+5.47)#87 | 4.9%(+5.63)#1,946 |
| 88. | Cantrall | 10.5% | 5.1%(+5.47)#88 | 4.9%(+5.63)#1,949 |
| 89. | Niantic | 10.4% | 5.1%(+5.36)#89 | 4.9%(+5.52)#1,974 |
| 90. | Le Roy | 10.4% | 5.1%(+5.34)#90 | 4.9%(+5.50)#1,985 |
| 91. | Greenfield | 10.3% | 5.1%(+5.29)#91 | 4.9%(+5.45)#1,997 |
| 92. | Vernon Hills | 10.3% | 5.1%(+5.28)#92 | 4.9%(+5.44)#2,012 |
| 93. | Makanda | 10.3% | 5.1%(+5.26)#93 | 4.9%(+5.43)#2,016 |
| 94. | Warren | 10.1% | 5.1%(+5.01)#94 | 4.9%(+5.17)#2,099 |
| 95. | Bartlett | 10.0% | 5.1%(+4.97)#95 | 4.9%(+5.13)#2,113 |
| 96. | Mill Creek | 10.0% | 5.1%(+4.94)#96 | 4.9%(+5.11)#2,165 |
| 97. | Lindenhurst | 10.0% | 5.1%(+4.94)#97 | 4.9%(+5.10)#2,166 |
| 98. | Arbury Hills | 9.9% | 5.1%(+4.82)#98 | 4.9%(+4.98)#2,203 |
| 99. | Twin Grove | 9.9% | 5.1%(+4.82)#99 | 4.9%(+4.98)#2,207 |
| 100. | Bull Valley | 9.8% | 5.1%(+4.75)#100 | 4.9%(+4.92)#2,226 |
Common Questions
What are the Top 10 Cities with the Highest Percentage of Population with a Degree in Computers and Mathematics in Illinois?
Top 10 Cities with the Highest Percentage of Population with a Degree in Computers and Mathematics in Illinois are:
#1
75.0%
#2
66.7%
#3
55.0%
#4
49.0%
#5
46.6%
#6
41.7%
#7
38.8%
#8
38.2%
#9
37.7%
#10
33.3%
What city has the Highest Percentage of Population with a Degree in Computers and Mathematics in Illinois?
Jeisyville has the Highest Percentage of Population with a Degree in Computers and Mathematics in Illinois with 75.0%.
What is the Percentage of Population with a Degree in Computers and Mathematics in the State of Illinois?
Percentage of Population with a Degree in Computers and Mathematics in Illinois is 5.1%.
What is the Percentage of Population with a Degree in Computers and Mathematics in the United States?
Percentage of Population with a Degree in Computers and Mathematics in the United States is 4.9%.