Cities with the Highest Percentage of Immigrants from South Eastern Asia in Wisconsin
RELATED REPORTS & OPTIONS
South Eastern Asia
Wisconsin
Compare Cities
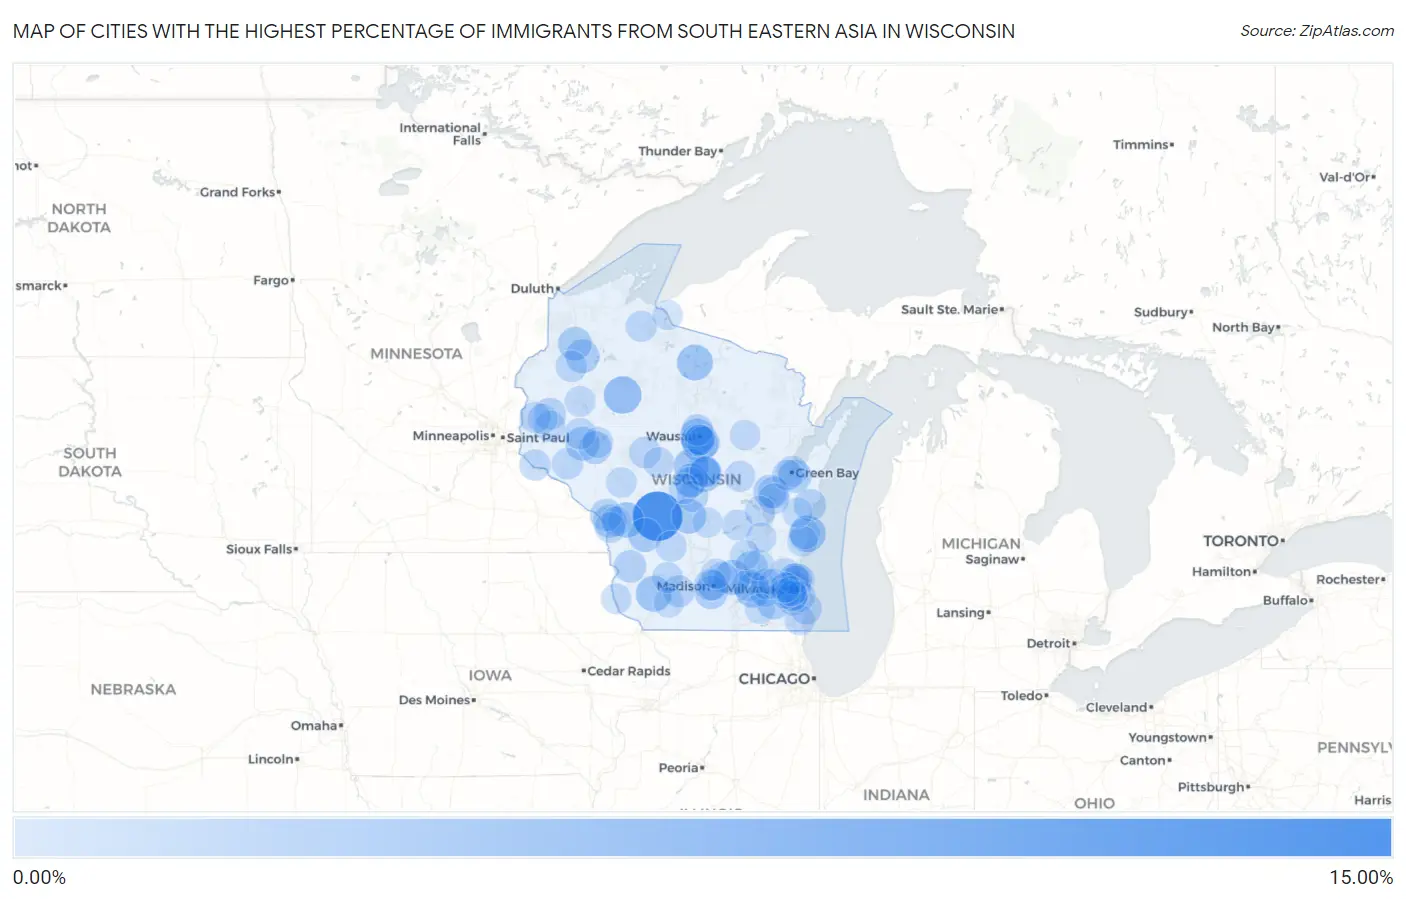
Map of Cities with the Highest Percentage of Immigrants from South Eastern Asia in Wisconsin
0.00%
15.00%
Cities with the Highest Percentage of Immigrants from South Eastern Asia in Wisconsin
| City | South Eastern Asia | vs State | vs National | |
| 1. | Oakdale | 11.58% | 0.73%(+10.9)#-1 | 1.30%(+10.3)#0 |
| 2. | Tony | 4.72% | 0.73%(+4.00)#0 | 1.30%(+3.43)#1 |
| 3. | Sheboygan | 4.17% | 0.73%(+3.45)#1 | 1.30%(+2.88)#2 |
| 4. | Whiting | 4.10% | 0.73%(+3.37)#2 | 1.30%(+2.80)#3 |
| 5. | Minocqua | 3.87% | 0.73%(+3.14)#3 | 1.30%(+2.58)#4 |
| 6. | Rothschild | 3.81% | 0.73%(+3.08)#4 | 1.30%(+2.51)#5 |
| 7. | Montfort | 3.75% | 0.73%(+3.02)#5 | 1.30%(+2.45)#6 |
| 8. | Rockland | 3.59% | 0.73%(+2.86)#6 | 1.30%(+2.29)#7 |
| 9. | Marshall | 3.56% | 0.73%(+2.83)#7 | 1.30%(+2.27)#8 |
| 10. | Wausau | 3.52% | 0.73%(+2.79)#8 | 1.30%(+2.22)#9 |
| 11. | Junction City | 3.47% | 0.73%(+2.74)#9 | 1.30%(+2.17)#10 |
| 12. | Helenville | 3.39% | 0.73%(+2.66)#10 | 1.30%(+2.09)#11 |
| 13. | Adams | 3.27% | 0.73%(+2.54)#11 | 1.30%(+1.97)#12 |
| 14. | Sand Pillow | 3.27% | 0.73%(+2.54)#12 | 1.30%(+1.97)#13 |
| 15. | Ontario | 2.89% | 0.73%(+2.16)#13 | 1.30%(+1.60)#14 |
| 16. | Springbrook | 2.70% | 0.73%(+1.97)#14 | 1.30%(+1.41)#15 |
| 17. | Mukwonago | 2.67% | 0.73%(+1.94)#15 | 1.30%(+1.37)#16 |
| 18. | Elk Mound | 2.66% | 0.73%(+1.93)#16 | 1.30%(+1.36)#17 |
| 19. | Minong | 2.62% | 0.73%(+1.89)#17 | 1.30%(+1.32)#18 |
| 20. | Biron | 2.58% | 0.73%(+1.85)#18 | 1.30%(+1.28)#19 |
| 21. | Onalaska | 2.51% | 0.73%(+1.78)#19 | 1.30%(+1.21)#20 |
| 22. | Appleton | 2.45% | 0.73%(+1.72)#20 | 1.30%(+1.15)#21 |
| 23. | Clyman | 2.34% | 0.73%(+1.61)#21 | 1.30%(+1.04)#22 |
| 24. | Bellevue | 2.33% | 0.73%(+1.60)#22 | 1.30%(+1.03)#23 |
| 25. | Fitchburg | 2.33% | 0.73%(+1.60)#23 | 1.30%(+1.03)#24 |
| 26. | Eau Claire | 2.31% | 0.73%(+1.58)#24 | 1.30%(+1.01)#25 |
| 27. | Rib Mountain | 2.06% | 0.73%(+1.34)#25 | 1.30%(+0.768)#26 |
| 28. | Holmen | 2.02% | 0.73%(+1.29)#26 | 1.30%(+0.721)#27 |
| 29. | Gays Mills | 2.00% | 0.73%(+1.28)#27 | 1.30%(+0.707)#28 |
| 30. | Johnson Creek | 1.92% | 0.73%(+1.19)#28 | 1.30%(+0.622)#29 |
| 31. | Manitowoc | 1.86% | 0.73%(+1.13)#29 | 1.30%(+0.559)#30 |
| 32. | Weston | 1.85% | 0.73%(+1.13)#30 | 1.30%(+0.557)#31 |
| 33. | Ridgeway | 1.76% | 0.73%(+1.03)#31 | 1.30%(+0.461)#32 |
| 34. | Fox Point | 1.75% | 0.73%(+1.02)#32 | 1.30%(+0.451)#33 |
| 35. | Milwaukee | 1.72% | 0.73%(+0.996)#33 | 1.30%(+0.428)#417 |
| 36. | Clear Lake | 1.72% | 0.73%(+0.989)#34 | 1.30%(+0.421)#418 |
| 37. | Shorewood Hills | 1.68% | 0.73%(+0.950)#35 | 1.30%(+0.382)#419 |
| 38. | Kimberly | 1.68% | 0.73%(+0.949)#36 | 1.30%(+0.381)#420 |
| 39. | River Hills | 1.63% | 0.73%(+0.906)#37 | 1.30%(+0.338)#421 |
| 40. | Greenwood | 1.63% | 0.73%(+0.902)#38 | 1.30%(+0.334)#422 |
| 41. | Maine | 1.50% | 0.73%(+0.767)#39 | 1.30%(+0.199)#423 |
| 42. | Wind Point | 1.48% | 0.73%(+0.753)#40 | 1.30%(+0.185)#424 |
| 43. | Colfax | 1.45% | 0.73%(+0.719)#41 | 1.30%(+0.151)#425 |
| 44. | Dousman | 1.43% | 0.73%(+0.701)#42 | 1.30%(+0.133)#426 |
| 45. | Spooner | 1.41% | 0.73%(+0.678)#43 | 1.30%(+0.110)#427 |
| 46. | Germantown | 1.37% | 0.73%(+0.641)#44 | 1.30%(+0.073)#428 |
| 47. | Emerald | 1.36% | 0.73%(+0.632)#45 | 1.30%(+0.064)#429 |
| 48. | Star Prairie | 1.33% | 0.73%(+0.601)#46 | 1.30%(+0.033)#430 |
| 49. | Durand | 1.33% | 0.73%(+0.597)#47 | 1.30%(+0.029)#431 |
| 50. | Hager City | 1.32% | 0.73%(+0.593)#48 | 1.30%(+0.025)#432 |
| 51. | Lake Camelot | 1.31% | 0.73%(+0.578)#49 | 1.30%(+0.010)#433 |
| 52. | Sun Prairie | 1.26% | 0.73%(+0.527)#50 | 1.30%(-0.041)#434 |
| 53. | Franklin | 1.25% | 0.73%(+0.520)#51 | 1.30%(-0.047)#435 |
| 54. | Mellen | 1.23% | 0.73%(+0.506)#52 | 1.30%(-0.062)#436 |
| 55. | Green Bay | 1.21% | 0.73%(+0.484)#53 | 1.30%(-0.084)#437 |
| 56. | Chili | 1.20% | 0.73%(+0.473)#54 | 1.30%(-0.095)#438 |
| 57. | Lake Hallie | 1.20% | 0.73%(+0.470)#55 | 1.30%(-0.098)#439 |
| 58. | Glendale | 1.19% | 0.73%(+0.466)#56 | 1.30%(-0.102)#440 |
| 59. | Wisconsin Rapids | 1.19% | 0.73%(+0.459)#57 | 1.30%(-0.109)#441 |
| 60. | La Valle | 1.18% | 0.73%(+0.452)#58 | 1.30%(-0.116)#442 |
| 61. | Cudahy | 1.17% | 0.73%(+0.444)#59 | 1.30%(-0.124)#443 |
| 62. | Stevens Point | 1.16% | 0.73%(+0.434)#60 | 1.30%(-0.134)#444 |
| 63. | Oconomowoc Lake | 1.16% | 0.73%(+0.429)#61 | 1.30%(-0.139)#445 |
| 64. | La Crosse | 1.15% | 0.73%(+0.417)#62 | 1.30%(-0.151)#446 |
| 65. | Manawa | 1.13% | 0.73%(+0.402)#63 | 1.30%(-0.165)#447 |
| 66. | Greenville | 1.13% | 0.73%(+0.397)#64 | 1.30%(-0.171)#448 |
| 67. | Madison | 1.12% | 0.73%(+0.390)#65 | 1.30%(-0.178)#449 |
| 68. | Greenfield | 1.11% | 0.73%(+0.386)#66 | 1.30%(-0.182)#450 |
| 69. | Ashwaubenon | 1.10% | 0.73%(+0.376)#67 | 1.30%(-0.192)#451 |
| 70. | Green Lake | 1.10% | 0.73%(+0.372)#68 | 1.30%(-0.196)#452 |
| 71. | Harrison | 1.10% | 0.73%(+0.367)#69 | 1.30%(-0.201)#453 |
| 72. | Lone Rock | 1.08% | 0.73%(+0.351)#70 | 1.30%(-0.217)#454 |
| 73. | Brown Deer | 1.06% | 0.73%(+0.328)#71 | 1.30%(-0.240)#455 |
| 74. | Somers | 1.05% | 0.73%(+0.319)#72 | 1.30%(-0.248)#456 |
| 75. | Park Ridge | 1.04% | 0.73%(+0.315)#73 | 1.30%(-0.252)#457 |
| 76. | Oshkosh | 1.03% | 0.73%(+0.299)#74 | 1.30%(-0.269)#458 |
| 77. | Kohler | 1.03% | 0.73%(+0.299)#75 | 1.30%(-0.269)#459 |
| 78. | Schofield | 1.02% | 0.73%(+0.291)#76 | 1.30%(-0.277)#460 |
| 79. | Nekoosa | 1.00% | 0.73%(+0.276)#77 | 1.30%(-0.292)#461 |
| 80. | Cameron | 1.00% | 0.73%(+0.272)#78 | 1.30%(-0.296)#462 |
| 81. | Greendale | 0.97% | 0.73%(+0.243)#79 | 1.30%(-0.325)#463 |
| 82. | Gibbsville | 0.95% | 0.73%(+0.222)#80 | 1.30%(-0.346)#464 |
| 83. | Hixton | 0.94% | 0.73%(+0.215)#81 | 1.30%(-0.353)#465 |
| 84. | Deer Park | 0.92% | 0.73%(+0.193)#82 | 1.30%(-0.375)#466 |
| 85. | Hustisford | 0.91% | 0.73%(+0.186)#83 | 1.30%(-0.382)#467 |
| 86. | Oakfield | 0.90% | 0.73%(+0.175)#84 | 1.30%(-0.393)#468 |
| 87. | Deforest | 0.90% | 0.73%(+0.173)#85 | 1.30%(-0.395)#469 |
| 88. | Bagley | 0.90% | 0.73%(+0.167)#86 | 1.30%(-0.401)#470 |
| 89. | Neopit | 0.88% | 0.73%(+0.148)#87 | 1.30%(-0.420)#471 |
| 90. | Hartland | 0.86% | 0.73%(+0.136)#88 | 1.30%(-0.432)#472 |
| 91. | West Salem | 0.84% | 0.73%(+0.109)#89 | 1.30%(-0.459)#473 |
| 92. | Lauderdale Lakes | 0.82% | 0.73%(+0.092)#90 | 1.30%(-0.476)#474 |
| 93. | New Berlin | 0.82% | 0.73%(+0.091)#91 | 1.30%(-0.477)#475 |
| 94. | West Allis | 0.82% | 0.73%(+0.090)#92 | 1.30%(-0.478)#476 |
| 95. | Mineral Point | 0.82% | 0.73%(+0.089)#93 | 1.30%(-0.479)#477 |
| 96. | St Nazianz | 0.82% | 0.73%(+0.088)#94 | 1.30%(-0.480)#478 |
| 97. | Westfield | 0.79% | 0.73%(+0.059)#95 | 1.30%(-0.509)#479 |
| 98. | Beaver Dam | 0.79% | 0.73%(+0.058)#96 | 1.30%(-0.510)#480 |
| 99. | Hurley | 0.78% | 0.73%(+0.055)#97 | 1.30%(-0.513)#481 |
| 100. | Brookfield | 0.77% | 0.73%(+0.046)#98 | 1.30%(-0.522)#482 |
Common Questions
What are the Top 10 Cities with the Highest Percentage of Immigrants from South Eastern Asia in Wisconsin?
Top 10 Cities with the Highest Percentage of Immigrants from South Eastern Asia in Wisconsin are:
What city has the Highest Percentage of Immigrants from South Eastern Asia in Wisconsin?
Oakdale has the Highest Percentage of Immigrants from South Eastern Asia in Wisconsin with 11.58%.
What is the Percentage of Immigrants from South Eastern Asia in the State of Wisconsin?
Percentage of Immigrants from South Eastern Asia in Wisconsin is 0.73%.
What is the Percentage of Immigrants from South Eastern Asia in the United States?
Percentage of Immigrants from South Eastern Asia in the United States is 1.30%.