Cities with the Most Immigrants from Croatia in Illinois
RELATED REPORTS & OPTIONS
Croatia
Illinois
Compare Cities
Map of Cities with the Most Immigrants from Croatia in Illinois
0
1,500
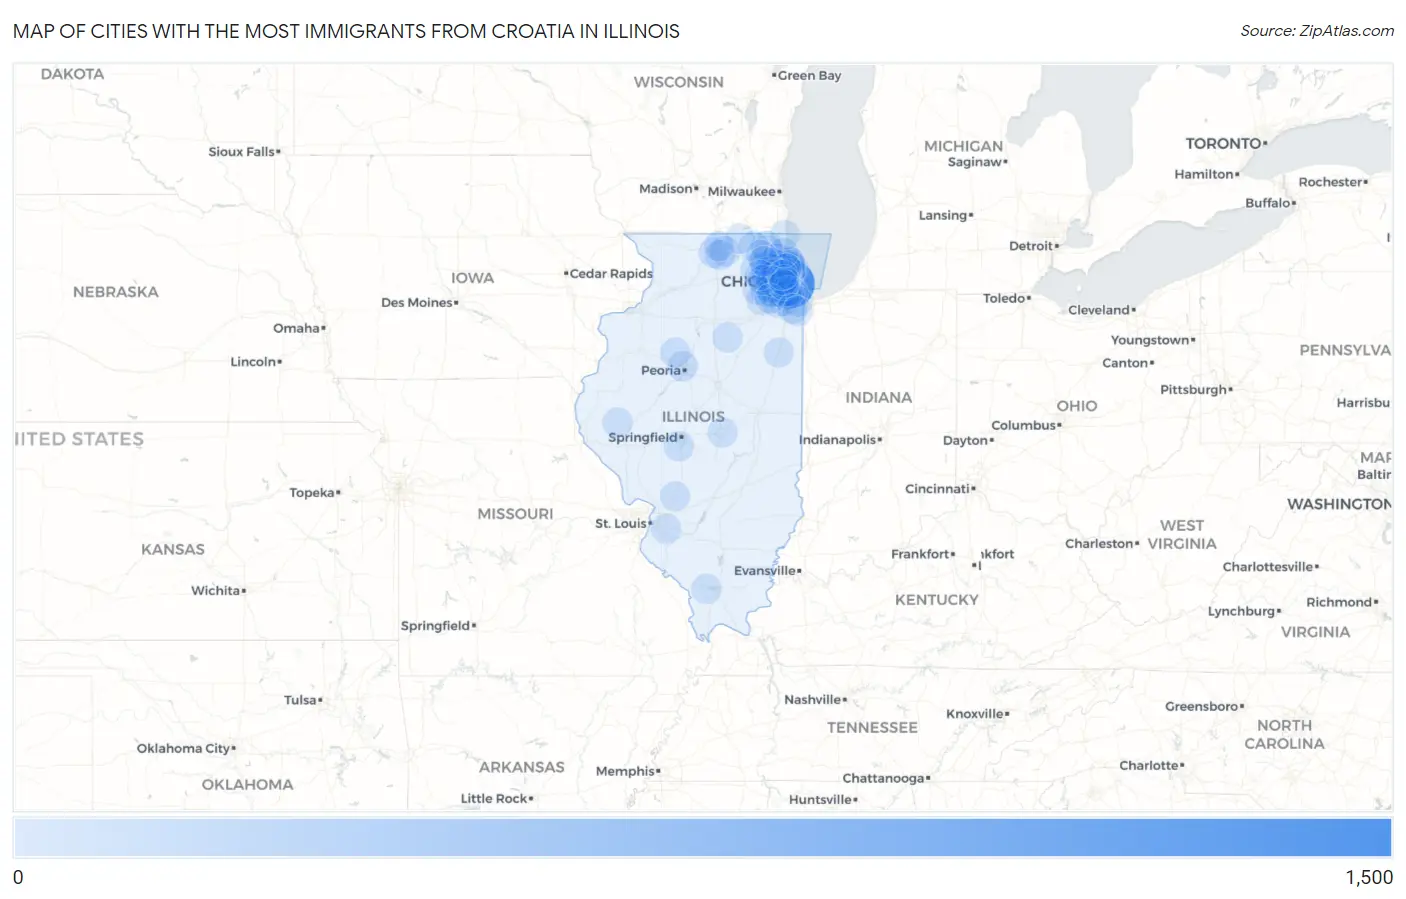
Cities with the Most Immigrants from Croatia in Illinois
| City | Croatia | vs State | vs National | |
| 1. | Chicago | 1,330 | 3,977(33.44%)#1 | 38,180(3.48%)#2 |
| 2. | Elk Grove Village | 125 | 3,977(3.14%)#2 | 38,180(0.33%)#31 |
| 3. | Addison | 100 | 3,977(2.51%)#3 | 38,180(0.26%)#51 |
| 4. | Skokie | 96 | 3,977(2.41%)#4 | 38,180(0.25%)#56 |
| 5. | Downers Grove | 73 | 3,977(1.84%)#5 | 38,180(0.19%)#86 |
| 6. | Hoffman Estates | 59 | 3,977(1.48%)#6 | 38,180(0.15%)#112 |
| 7. | Volo | 56 | 3,977(1.41%)#7 | 38,180(0.15%)#124 |
| 8. | Glendale Heights | 54 | 3,977(1.36%)#8 | 38,180(0.14%)#127 |
| 9. | Evanston | 53 | 3,977(1.33%)#9 | 38,180(0.14%)#128 |
| 10. | Park Ridge | 53 | 3,977(1.33%)#10 | 38,180(0.14%)#129 |
| 11. | Darien | 49 | 3,977(1.23%)#11 | 38,180(0.13%)#138 |
| 12. | Harwood Heights | 48 | 3,977(1.21%)#12 | 38,180(0.13%)#141 |
| 13. | Elgin | 47 | 3,977(1.18%)#13 | 38,180(0.12%)#146 |
| 14. | Berwyn | 44 | 3,977(1.11%)#14 | 38,180(0.12%)#156 |
| 15. | South Holland | 43 | 3,977(1.08%)#15 | 38,180(0.11%)#161 |
| 16. | Warrenville | 42 | 3,977(1.06%)#16 | 38,180(0.11%)#167 |
| 17. | Mount Prospect | 40 | 3,977(1.01%)#17 | 38,180(0.10%)#180 |
| 18. | Naperville | 38 | 3,977(0.96%)#18 | 38,180(0.10%)#186 |
| 19. | Franklin Park | 36 | 3,977(0.91%)#19 | 38,180(0.09%)#198 |
| 20. | Countryside | 36 | 3,977(0.91%)#20 | 38,180(0.09%)#199 |
| 21. | Glenview | 35 | 3,977(0.88%)#21 | 38,180(0.09%)#203 |
| 22. | Buffalo Grove | 33 | 3,977(0.83%)#22 | 38,180(0.09%)#217 |
| 23. | Itasca | 33 | 3,977(0.83%)#23 | 38,180(0.09%)#220 |
| 24. | Lyons | 31 | 3,977(0.78%)#24 | 38,180(0.08%)#237 |
| 25. | Burbank | 30 | 3,977(0.75%)#25 | 38,180(0.08%)#241 |
| 26. | Worth | 29 | 3,977(0.73%)#26 | 38,180(0.08%)#256 |
| 27. | Glencoe | 29 | 3,977(0.73%)#27 | 38,180(0.08%)#258 |
| 28. | Belvidere | 27 | 3,977(0.68%)#28 | 38,180(0.07%)#268 |
| 29. | Des Plaines | 25 | 3,977(0.63%)#29 | 38,180(0.07%)#285 |
| 30. | Lincolnwood | 25 | 3,977(0.63%)#30 | 38,180(0.07%)#289 |
| 31. | Winnetka | 25 | 3,977(0.63%)#31 | 38,180(0.07%)#290 |
| 32. | Niles | 24 | 3,977(0.60%)#32 | 38,180(0.06%)#296 |
| 33. | Homer Glen | 24 | 3,977(0.60%)#33 | 38,180(0.06%)#297 |
| 34. | Westchester | 24 | 3,977(0.60%)#34 | 38,180(0.06%)#301 |
| 35. | Rockford | 23 | 3,977(0.58%)#35 | 38,180(0.06%)#304 |
| 36. | Arlington Heights | 23 | 3,977(0.58%)#36 | 38,180(0.06%)#309 |
| 37. | Lombard | 23 | 3,977(0.58%)#37 | 38,180(0.06%)#311 |
| 38. | Evergreen Park | 23 | 3,977(0.58%)#38 | 38,180(0.06%)#316 |
| 39. | Peoria | 21 | 3,977(0.53%)#39 | 38,180(0.06%)#334 |
| 40. | Lisle | 19 | 3,977(0.48%)#40 | 38,180(0.05%)#372 |
| 41. | Wilmette | 18 | 3,977(0.45%)#41 | 38,180(0.05%)#388 |
| 42. | Palatine | 16 | 3,977(0.40%)#42 | 38,180(0.04%)#414 |
| 43. | Elmwood Park | 15 | 3,977(0.38%)#43 | 38,180(0.04%)#439 |
| 44. | Orland Park | 14 | 3,977(0.35%)#44 | 38,180(0.04%)#460 |
| 45. | Carol Stream | 14 | 3,977(0.35%)#45 | 38,180(0.04%)#464 |
| 46. | Bloomingdale | 14 | 3,977(0.35%)#46 | 38,180(0.04%)#471 |
| 47. | Chatham | 14 | 3,977(0.35%)#47 | 38,180(0.04%)#478 |
| 48. | Morton Grove | 13 | 3,977(0.33%)#48 | 38,180(0.03%)#501 |
| 49. | Schaumburg | 12 | 3,977(0.30%)#49 | 38,180(0.03%)#519 |
| 50. | Wauconda | 12 | 3,977(0.30%)#50 | 38,180(0.03%)#534 |
| 51. | Cherry Valley | 12 | 3,977(0.30%)#51 | 38,180(0.03%)#541 |
| 52. | Bull Valley | 12 | 3,977(0.30%)#52 | 38,180(0.03%)#545 |
| 53. | Plainfield | 11 | 3,977(0.28%)#53 | 38,180(0.03%)#558 |
| 54. | Streator | 11 | 3,977(0.28%)#54 | 38,180(0.03%)#565 |
| 55. | Willow Springs | 11 | 3,977(0.28%)#55 | 38,180(0.03%)#569 |
| 56. | Mount Sterling | 11 | 3,977(0.28%)#56 | 38,180(0.03%)#573 |
| 57. | Hanover Park | 10 | 3,977(0.25%)#57 | 38,180(0.03%)#590 |
| 58. | Cary | 10 | 3,977(0.25%)#58 | 38,180(0.03%)#595 |
| 59. | La Grange Park | 10 | 3,977(0.25%)#59 | 38,180(0.03%)#602 |
| 60. | Winthrop Harbor | 10 | 3,977(0.25%)#60 | 38,180(0.03%)#610 |
| 61. | Hometown | 10 | 3,977(0.25%)#61 | 38,180(0.03%)#614 |
| 62. | Glen Ellyn | 9 | 3,977(0.23%)#62 | 38,180(0.02%)#634 |
| 63. | Aurora | 8 | 3,977(0.20%)#63 | 38,180(0.02%)#663 |
| 64. | Decatur | 8 | 3,977(0.20%)#64 | 38,180(0.02%)#668 |
| 65. | Bridgeview | 8 | 3,977(0.20%)#65 | 38,180(0.02%)#683 |
| 66. | Oak Lawn | 7 | 3,977(0.18%)#66 | 38,180(0.02%)#708 |
| 67. | Wood Dale | 7 | 3,977(0.18%)#67 | 38,180(0.02%)#717 |
| 68. | Woodridge | 6 | 3,977(0.15%)#68 | 38,180(0.02%)#746 |
| 69. | Norridge | 6 | 3,977(0.15%)#69 | 38,180(0.02%)#750 |
| 70. | Harvard | 6 | 3,977(0.15%)#70 | 38,180(0.02%)#753 |
| 71. | West Chicago | 5 | 3,977(0.13%)#71 | 38,180(0.01%)#773 |
| 72. | Lake Forest | 5 | 3,977(0.13%)#72 | 38,180(0.01%)#776 |
| 73. | North Riverside | 5 | 3,977(0.13%)#73 | 38,180(0.01%)#781 |
| 74. | Wayne | 5 | 3,977(0.13%)#74 | 38,180(0.01%)#787 |
| 75. | Rest Haven | 5 | 3,977(0.13%)#75 | 38,180(0.01%)#792 |
| 76. | Brookfield | 3 | 3,977(0.08%)#76 | 38,180(0.01%)#822 |
| 77. | Shiloh | 3 | 3,977(0.08%)#77 | 38,180(0.01%)#824 |
| 78. | Steger | 3 | 3,977(0.08%)#78 | 38,180(0.01%)#826 |
| 79. | Romeoville | 2 | 3,977(0.05%)#79 | 38,180(0.01%)#835 |
| 80. | Maywood | 2 | 3,977(0.05%)#80 | 38,180(0.01%)#838 |
| 81. | Olympia Fields | 2 | 3,977(0.05%)#81 | 38,180(0.01%)#840 |
| 82. | Loves Park | 1 | 3,977(0.03%)#82 | 38,180(0.00%)#856 |
| 83. | Carbondale | 1 | 3,977(0.03%)#83 | 38,180(0.00%)#857 |
| 84. | Schiller Park | 1 | 3,977(0.03%)#84 | 38,180(0.00%)#860 |
| 85. | Barrington Hills | 1 | 3,977(0.03%)#85 | 38,180(0.00%)#863 |
| 86. | Princeville | 1 | 3,977(0.03%)#86 | 38,180(0.00%)#866 |
| 87. | Clifton | 1 | 3,977(0.03%)#87 | 38,180(0.00%)#867 |
| 88. | Williamson | 1 | 3,977(0.03%)#88 | 38,180(0.00%)#871 |
Common Questions
What are the Top 10 Cities with the Most Immigrants from Croatia in Illinois?
Top 10 Cities with the Most Immigrants from Croatia in Illinois are:
#1
1,330
#2
125
#3
100
#4
96
#5
73
#6
59
#7
56
#8
54
#9
53
#10
53
What city has the Most Immigrants from Croatia in Illinois?
Chicago has the Most Immigrants from Croatia in Illinois with 1,330.
What is the Total Immigrants from Croatia in the State of Illinois?
Total Immigrants from Croatia in Illinois is 3,977.
What is the Total Immigrants from Croatia in the United States?
Total Immigrants from Croatia in the United States is 38,180.