Cities with the Highest Percentage of Immigrants from Korea in Illinois
RELATED REPORTS & OPTIONS
Korea
Illinois
Compare Cities
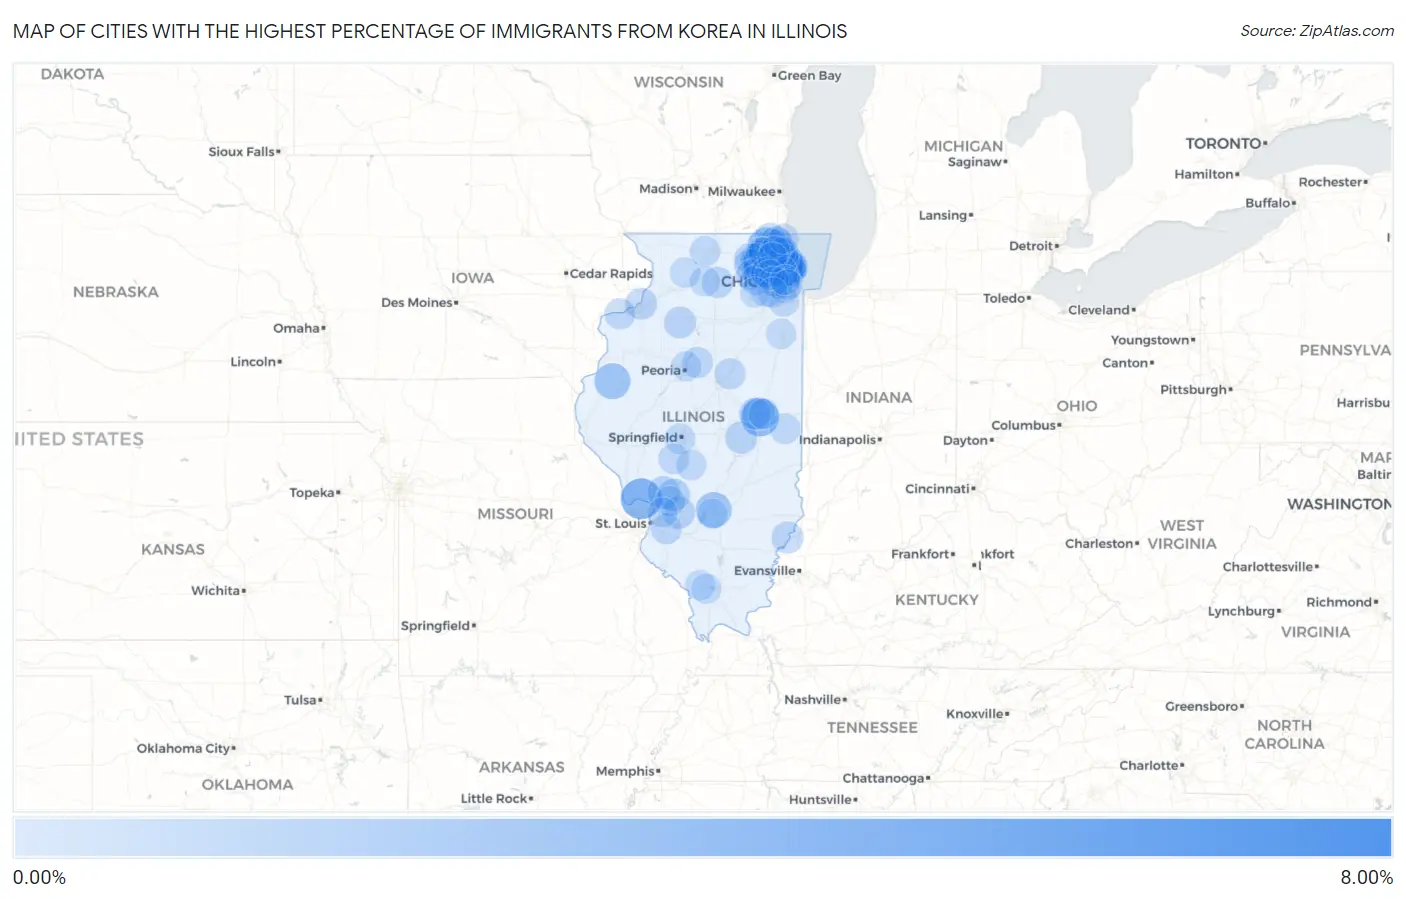
Map of Cities with the Highest Percentage of Immigrants from Korea in Illinois
0.00%
8.00%
Cities with the Highest Percentage of Immigrants from Korea in Illinois
| City | Korea | vs State | vs National | |
| 1. | Inverness | 7.02% | 0.32%(+6.70)#1 | 0.31%(+6.71)#54 |
| 2. | Elsah | 3.97% | 0.32%(+3.66)#2 | 0.31%(+3.66)#126 |
| 3. | Glenview | 3.53% | 0.32%(+3.21)#3 | 0.31%(+3.22)#149 |
| 4. | South Barrington | 3.36% | 0.32%(+3.04)#4 | 0.31%(+3.05)#157 |
| 5. | Northbrook | 3.07% | 0.32%(+2.75)#5 | 0.31%(+2.76)#181 |
| 6. | Savoy | 3.03% | 0.32%(+2.71)#6 | 0.31%(+2.72)#185 |
| 7. | Buffalo Grove | 3.02% | 0.32%(+2.70)#7 | 0.31%(+2.71)#186 |
| 8. | Volo | 2.81% | 0.32%(+2.49)#8 | 0.31%(+2.50)#210 |
| 9. | Blandinsville | 2.36% | 0.32%(+2.04)#9 | 0.31%(+2.05)#278 |
| 10. | Wheeling | 2.30% | 0.32%(+1.98)#10 | 0.31%(+1.98)#289 |
| 11. | Vernon | 2.25% | 0.32%(+1.93)#11 | 0.31%(+1.93)#303 |
| 12. | Lincolnshire | 2.18% | 0.32%(+1.86)#12 | 0.31%(+1.86)#314 |
| 13. | Niles | 2.04% | 0.32%(+1.72)#13 | 0.31%(+1.72)#343 |
| 14. | Golf | 2.01% | 0.32%(+1.70)#14 | 0.31%(+1.70)#348 |
| 15. | Vernon Hills | 1.93% | 0.32%(+1.62)#15 | 0.31%(+1.62)#370 |
| 16. | Morton Grove | 1.85% | 0.32%(+1.53)#16 | 0.31%(+1.54)#401 |
| 17. | Schaumburg | 1.71% | 0.32%(+1.39)#17 | 0.31%(+1.39)#440 |
| 18. | Wilmette | 1.51% | 0.32%(+1.20)#18 | 0.31%(+1.20)#511 |
| 19. | Long Grove | 1.43% | 0.32%(+1.11)#19 | 0.31%(+1.11)#554 |
| 20. | Hoffman Estates | 1.42% | 0.32%(+1.11)#20 | 0.31%(+1.11)#555 |
| 21. | Palatine | 1.30% | 0.32%(+0.982)#21 | 0.31%(+0.986)#624 |
| 22. | Bunker Hill | 1.29% | 0.32%(+0.976)#22 | 0.31%(+0.980)#630 |
| 23. | Lincolnwood | 1.28% | 0.32%(+0.965)#23 | 0.31%(+0.969)#641 |
| 24. | Champaign | 1.26% | 0.32%(+0.941)#24 | 0.31%(+0.946)#656 |
| 25. | Hainesville | 1.24% | 0.32%(+0.924)#25 | 0.31%(+0.928)#663 |
| 26. | Mount Prospect | 1.22% | 0.32%(+0.904)#26 | 0.31%(+0.908)#672 |
| 27. | West Dundee | 1.20% | 0.32%(+0.882)#27 | 0.31%(+0.886)#685 |
| 28. | Highland | 1.19% | 0.32%(+0.878)#28 | 0.31%(+0.882)#687 |
| 29. | Staunton | 1.16% | 0.32%(+0.841)#29 | 0.31%(+0.846)#715 |
| 30. | Bannockburn | 1.13% | 0.32%(+0.810)#30 | 0.31%(+0.814)#745 |
| 31. | Hammond | 1.10% | 0.32%(+0.782)#31 | 0.31%(+0.787)#761 |
| 32. | Skokie | 1.08% | 0.32%(+0.763)#32 | 0.31%(+0.767)#786 |
| 33. | Hawthorn Woods | 1.06% | 0.32%(+0.748)#33 | 0.31%(+0.752)#802 |
| 34. | Barrington | 1.06% | 0.32%(+0.742)#34 | 0.31%(+0.746)#806 |
| 35. | Arlington Heights | 1.04% | 0.32%(+0.721)#35 | 0.31%(+0.725)#826 |
| 36. | Lake Zurich | 1.02% | 0.32%(+0.701)#36 | 0.31%(+0.705)#852 |
| 37. | Prospect Heights | 1.02% | 0.32%(+0.698)#37 | 0.31%(+0.703)#854 |
| 38. | Mount Carmel | 0.99% | 0.32%(+0.672)#38 | 0.31%(+0.676)#882 |
| 39. | Streamwood | 0.98% | 0.32%(+0.659)#39 | 0.31%(+0.663)#897 |
| 40. | Northfield | 0.95% | 0.32%(+0.630)#40 | 0.31%(+0.634)#934 |
| 41. | Buda | 0.95% | 0.32%(+0.629)#41 | 0.31%(+0.633)#938 |
| 42. | Rapids City | 0.91% | 0.32%(+0.598)#42 | 0.31%(+0.602)#972 |
| 43. | Fox River Grove | 0.91% | 0.32%(+0.596)#43 | 0.31%(+0.601)#975 |
| 44. | Pingree Grove | 0.91% | 0.32%(+0.594)#44 | 0.31%(+0.598)#977 |
| 45. | Bondville | 0.87% | 0.32%(+0.558)#45 | 0.31%(+0.562)#1,023 |
| 46. | Deer Park | 0.84% | 0.32%(+0.523)#46 | 0.31%(+0.527)#1,068 |
| 47. | Lake Villa | 0.82% | 0.32%(+0.499)#47 | 0.31%(+0.504)#1,107 |
| 48. | Algonquin | 0.80% | 0.32%(+0.486)#48 | 0.31%(+0.491)#1,120 |
| 49. | Huntley | 0.79% | 0.32%(+0.472)#49 | 0.31%(+0.476)#1,135 |
| 50. | Rolling Meadows | 0.78% | 0.32%(+0.465)#50 | 0.31%(+0.469)#1,145 |
| 51. | Steward | 0.76% | 0.32%(+0.447)#51 | 0.31%(+0.451)#1,173 |
| 52. | Itasca | 0.76% | 0.32%(+0.442)#52 | 0.31%(+0.446)#1,179 |
| 53. | Evanston | 0.73% | 0.32%(+0.413)#53 | 0.31%(+0.417)#1,222 |
| 54. | Naperville | 0.73% | 0.32%(+0.411)#54 | 0.31%(+0.415)#1,226 |
| 55. | Summit | 0.72% | 0.32%(+0.408)#55 | 0.31%(+0.413)#1,229 |
| 56. | Lexington | 0.71% | 0.32%(+0.395)#56 | 0.31%(+0.399)#1,251 |
| 57. | Elk Grove Village | 0.71% | 0.32%(+0.394)#57 | 0.31%(+0.398)#1,253 |
| 58. | Des Plaines | 0.70% | 0.32%(+0.381)#58 | 0.31%(+0.385)#1,274 |
| 59. | Metamora | 0.69% | 0.32%(+0.372)#59 | 0.31%(+0.376)#1,291 |
| 60. | Shiloh | 0.68% | 0.32%(+0.367)#60 | 0.31%(+0.371)#1,296 |
| 61. | Mettawa | 0.67% | 0.32%(+0.349)#61 | 0.31%(+0.353)#1,329 |
| 62. | South Elgin | 0.66% | 0.32%(+0.346)#62 | 0.31%(+0.350)#1,335 |
| 63. | Andalusia | 0.66% | 0.32%(+0.341)#63 | 0.31%(+0.345)#1,347 |
| 64. | Gurnee | 0.66% | 0.32%(+0.340)#64 | 0.31%(+0.344)#1,349 |
| 65. | Campton Hills | 0.65% | 0.32%(+0.337)#65 | 0.31%(+0.341)#1,358 |
| 66. | Rosemont | 0.65% | 0.32%(+0.330)#66 | 0.31%(+0.335)#1,372 |
| 67. | Geneva | 0.64% | 0.32%(+0.319)#67 | 0.31%(+0.323)#1,399 |
| 68. | North Riverside | 0.63% | 0.32%(+0.318)#68 | 0.31%(+0.323)#1,403 |
| 69. | Orland Park | 0.63% | 0.32%(+0.314)#69 | 0.31%(+0.318)#1,412 |
| 70. | Lake Forest | 0.61% | 0.32%(+0.296)#70 | 0.31%(+0.300)#1,449 |
| 71. | Sidell | 0.61% | 0.32%(+0.296)#71 | 0.31%(+0.300)#1,450 |
| 72. | Grandwood Park | 0.59% | 0.32%(+0.277)#72 | 0.31%(+0.281)#1,491 |
| 73. | Jerome | 0.59% | 0.32%(+0.276)#73 | 0.31%(+0.280)#1,499 |
| 74. | Virden | 0.59% | 0.32%(+0.276)#74 | 0.31%(+0.280)#1,501 |
| 75. | Winnebago | 0.57% | 0.32%(+0.249)#75 | 0.31%(+0.254)#1,557 |
| 76. | Deerfield | 0.55% | 0.32%(+0.236)#76 | 0.31%(+0.240)#1,589 |
| 77. | Morrisonville | 0.53% | 0.32%(+0.218)#77 | 0.31%(+0.222)#1,644 |
| 78. | Oakwood Hills | 0.53% | 0.32%(+0.209)#78 | 0.31%(+0.213)#1,673 |
| 79. | Urbana | 0.52% | 0.32%(+0.202)#79 | 0.31%(+0.206)#1,686 |
| 80. | Polo | 0.52% | 0.32%(+0.199)#80 | 0.31%(+0.203)#1,700 |
| 81. | Port Barrington | 0.51% | 0.32%(+0.197)#81 | 0.31%(+0.201)#1,706 |
| 82. | Ashton | 0.50% | 0.32%(+0.178)#82 | 0.31%(+0.183)#1,762 |
| 83. | Oak Brook | 0.48% | 0.32%(+0.167)#83 | 0.31%(+0.171)#1,801 |
| 84. | Peoria Heights | 0.48% | 0.32%(+0.159)#84 | 0.31%(+0.163)#1,834 |
| 85. | Hanover Park | 0.47% | 0.32%(+0.154)#85 | 0.31%(+0.158)#1,852 |
| 86. | Bourbonnais | 0.47% | 0.32%(+0.152)#86 | 0.31%(+0.157)#1,857 |
| 87. | Lombard | 0.46% | 0.32%(+0.142)#87 | 0.31%(+0.146)#1,892 |
| 88. | Worden | 0.46% | 0.32%(+0.141)#88 | 0.31%(+0.145)#1,897 |
| 89. | Mundelein | 0.46% | 0.32%(+0.139)#89 | 0.31%(+0.144)#1,901 |
| 90. | Bloomingdale | 0.45% | 0.32%(+0.134)#90 | 0.31%(+0.138)#1,920 |
| 91. | Beach Park | 0.45% | 0.32%(+0.134)#91 | 0.31%(+0.138)#1,921 |
| 92. | Patoka | 0.45% | 0.32%(+0.133)#92 | 0.31%(+0.137)#1,922 |
| 93. | Stickney | 0.44% | 0.32%(+0.124)#93 | 0.31%(+0.129)#1,947 |
| 94. | Woodridge | 0.44% | 0.32%(+0.124)#94 | 0.31%(+0.128)#1,948 |
| 95. | Murphysboro | 0.44% | 0.32%(+0.120)#95 | 0.31%(+0.124)#1,972 |
| 96. | Montgomery | 0.44% | 0.32%(+0.119)#96 | 0.31%(+0.124)#1,977 |
| 97. | Kildeer | 0.44% | 0.32%(+0.119)#97 | 0.31%(+0.123)#1,979 |
| 98. | Carbondale | 0.43% | 0.32%(+0.114)#98 | 0.31%(+0.119)#1,997 |
| 99. | Glen Carbon | 0.42% | 0.32%(+0.108)#99 | 0.31%(+0.112)#2,025 |
| 100. | River Forest | 0.42% | 0.32%(+0.107)#100 | 0.31%(+0.111)#2,030 |
Common Questions
What are the Top 10 Cities with the Highest Percentage of Immigrants from Korea in Illinois?
Top 10 Cities with the Highest Percentage of Immigrants from Korea in Illinois are:
#1
7.02%
#2
3.97%
#3
3.53%
#4
3.36%
#5
3.07%
#6
3.03%
#7
3.02%
#8
2.81%
#9
2.36%
#10
2.30%
What city has the Highest Percentage of Immigrants from Korea in Illinois?
Inverness has the Highest Percentage of Immigrants from Korea in Illinois with 7.02%.
What is the Percentage of Immigrants from Korea in the State of Illinois?
Percentage of Immigrants from Korea in Illinois is 0.32%.
What is the Percentage of Immigrants from Korea in the United States?
Percentage of Immigrants from Korea in the United States is 0.31%.