Cities with the Highest Percentage of Population Employed in Security & Protection in Illinois
RELATED REPORTS & OPTIONS
Security & Protection
Illinois
Compare Cities
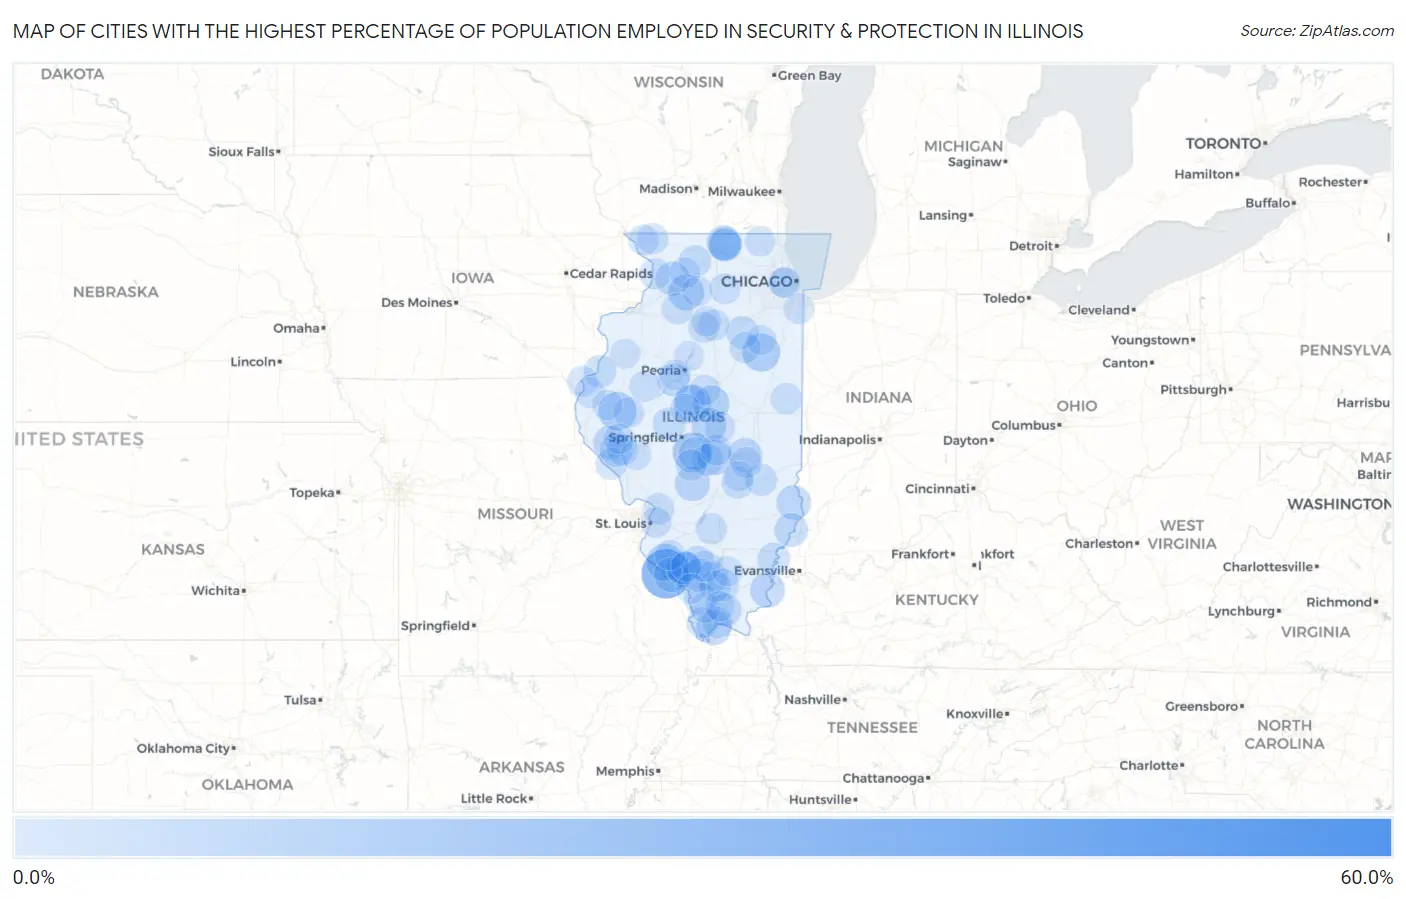
Map of Cities with the Highest Percentage of Population Employed in Security & Protection in Illinois
0.0%
60.0%
Cities with the Highest Percentage of Population Employed in Security & Protection in Illinois
| City | % Employed | vs State | vs National | |
| 1. | Paloma | 55.3% | 2.2%(+53.1)#1 | 2.1%(+53.1)#23 |
| 2. | Kaskaskia | 33.3% | 2.2%(+31.1)#2 | 2.1%(+31.2)#93 |
| 3. | Shirley | 31.2% | 2.2%(+29.1)#3 | 2.1%(+29.1)#108 |
| 4. | Blairsville | 28.4% | 2.2%(+26.2)#4 | 2.1%(+26.3)#134 |
| 5. | Tovey | 19.2% | 2.2%(+17.0)#5 | 2.1%(+17.1)#298 |
| 6. | Literberry | 17.5% | 2.2%(+15.3)#6 | 2.1%(+15.3)#359 |
| 7. | Camden | 17.4% | 2.2%(+15.2)#7 | 2.1%(+15.2)#362 |
| 8. | Kempton | 16.9% | 2.2%(+14.8)#8 | 2.1%(+14.8)#385 |
| 9. | Hartsburg | 16.3% | 2.2%(+14.1)#9 | 2.1%(+14.1)#420 |
| 10. | Evansville | 16.0% | 2.2%(+13.8)#10 | 2.1%(+13.8)#437 |
| 11. | Waynesville | 14.6% | 2.2%(+12.5)#11 | 2.1%(+12.5)#507 |
| 12. | Nachusa | 14.3% | 2.2%(+12.1)#12 | 2.1%(+12.1)#543 |
| 13. | Harmon | 13.8% | 2.2%(+11.6)#13 | 2.1%(+11.6)#583 |
| 14. | Olmsted | 12.9% | 2.2%(+10.7)#14 | 2.1%(+10.8)#669 |
| 15. | Schram City | 12.8% | 2.2%(+10.6)#15 | 2.1%(+10.7)#676 |
| 16. | Assumption | 12.8% | 2.2%(+10.6)#16 | 2.1%(+10.6)#681 |
| 17. | Willisville | 12.6% | 2.2%(+10.4)#17 | 2.1%(+10.5)#699 |
| 18. | Latham | 12.6% | 2.2%(+10.4)#18 | 2.1%(+10.5)#700 |
| 19. | Old Shawneetown | 12.5% | 2.2%(+10.3)#19 | 2.1%(+10.4)#708 |
| 20. | Cable | 12.5% | 2.2%(+10.3)#20 | 2.1%(+10.4)#714 |
| 21. | Chester | 12.0% | 2.2%(+9.76)#21 | 2.1%(+9.81)#766 |
| 22. | Flat Rock | 11.9% | 2.2%(+9.66)#22 | 2.1%(+9.71)#781 |
| 23. | Caledonia | 11.7% | 2.2%(+9.54)#23 | 2.1%(+9.58)#806 |
| 24. | Coleta | 11.6% | 2.2%(+9.44)#24 | 2.1%(+9.48)#819 |
| 25. | Allenville | 11.4% | 2.2%(+9.17)#25 | 2.1%(+9.22)#854 |
| 26. | Candlewick Lake | 11.1% | 2.2%(+8.91)#26 | 2.1%(+8.95)#910 |
| 27. | Allendale | 10.9% | 2.2%(+8.67)#27 | 2.1%(+8.71)#944 |
| 28. | Baylis | 10.8% | 2.2%(+8.58)#28 | 2.1%(+8.62)#960 |
| 29. | Percy | 10.7% | 2.2%(+8.46)#29 | 2.1%(+8.51)#982 |
| 30. | Pittsfield | 10.4% | 2.2%(+8.19)#30 | 2.1%(+8.24)#1,029 |
| 31. | Pinckneyville | 10.2% | 2.2%(+7.98)#31 | 2.1%(+8.03)#1,063 |
| 32. | Prairietown | 10.1% | 2.2%(+7.95)#32 | 2.1%(+8.00)#1,072 |
| 33. | Vergennes | 10.0% | 2.2%(+7.81)#33 | 2.1%(+7.85)#1,093 |
| 34. | Kingston Mines | 9.9% | 2.2%(+7.67)#34 | 2.1%(+7.71)#1,119 |
| 35. | Timberlane | 9.8% | 2.2%(+7.62)#35 | 2.1%(+7.66)#1,134 |
| 36. | Vienna | 9.8% | 2.2%(+7.59)#36 | 2.1%(+7.63)#1,146 |
| 37. | Jeisyville | 9.6% | 2.2%(+7.42)#37 | 2.1%(+7.47)#1,174 |
| 38. | Kinsman | 9.5% | 2.2%(+7.33)#38 | 2.1%(+7.38)#1,194 |
| 39. | Royalton | 9.5% | 2.2%(+7.26)#39 | 2.1%(+7.31)#1,208 |
| 40. | Spillertown | 9.4% | 2.2%(+7.24)#40 | 2.1%(+7.29)#1,217 |
| 41. | Ritchie | 9.4% | 2.2%(+7.24)#41 | 2.1%(+7.29)#1,218 |
| 42. | Lomax | 9.3% | 2.2%(+7.09)#42 | 2.1%(+7.14)#1,247 |
| 43. | Lake Petersburg | 9.2% | 2.2%(+7.06)#43 | 2.1%(+7.10)#1,253 |
| 44. | Phillipstown | 9.1% | 2.2%(+6.90)#44 | 2.1%(+6.94)#1,311 |
| 45. | Leaf River | 8.7% | 2.2%(+6.56)#45 | 2.1%(+6.60)#1,407 |
| 46. | Jewett | 8.7% | 2.2%(+6.46)#46 | 2.1%(+6.51)#1,446 |
| 47. | Alto Pass | 8.5% | 2.2%(+6.33)#47 | 2.1%(+6.37)#1,482 |
| 48. | Shumway | 8.5% | 2.2%(+6.30)#48 | 2.1%(+6.34)#1,493 |
| 49. | Owaneco | 8.3% | 2.2%(+6.09)#49 | 2.1%(+6.13)#1,563 |
| 50. | Pleasant Hill | 8.1% | 2.2%(+5.91)#50 | 2.1%(+5.95)#1,623 |
| 51. | Crainville | 8.0% | 2.2%(+5.80)#51 | 2.1%(+5.85)#1,663 |
| 52. | Morrisonville | 7.8% | 2.2%(+5.65)#52 | 2.1%(+5.69)#1,715 |
| 53. | Potomac | 7.8% | 2.2%(+5.62)#53 | 2.1%(+5.66)#1,724 |
| 54. | New Bedford | 7.7% | 2.2%(+5.50)#54 | 2.1%(+5.54)#1,769 |
| 55. | Detroit | 7.7% | 2.2%(+5.50)#55 | 2.1%(+5.54)#1,770 |
| 56. | Tamms | 7.6% | 2.2%(+5.40)#56 | 2.1%(+5.45)#1,802 |
| 57. | Oglesby | 7.6% | 2.2%(+5.40)#57 | 2.1%(+5.44)#1,803 |
| 58. | Roxana | 7.6% | 2.2%(+5.39)#58 | 2.1%(+5.43)#1,808 |
| 59. | Thomson | 7.5% | 2.2%(+5.28)#59 | 2.1%(+5.32)#1,866 |
| 60. | Moweaqua | 7.5% | 2.2%(+5.28)#60 | 2.1%(+5.32)#1,867 |
| 61. | Smithfield | 7.5% | 2.2%(+5.27)#61 | 2.1%(+5.31)#1,870 |
| 62. | Apple Canyon Lake | 7.4% | 2.2%(+5.23)#62 | 2.1%(+5.28)#1,891 |
| 63. | Central City | 7.4% | 2.2%(+5.22)#63 | 2.1%(+5.26)#1,897 |
| 64. | St Johns | 7.4% | 2.2%(+5.22)#64 | 2.1%(+5.26)#1,902 |
| 65. | Odell | 7.4% | 2.2%(+5.20)#65 | 2.1%(+5.24)#1,909 |
| 66. | New Grand Chain | 7.3% | 2.2%(+5.08)#66 | 2.1%(+5.12)#1,955 |
| 67. | Mark | 7.2% | 2.2%(+5.05)#67 | 2.1%(+5.09)#1,963 |
| 68. | Gays | 7.2% | 2.2%(+5.04)#68 | 2.1%(+5.08)#1,970 |
| 69. | North Riverside | 7.2% | 2.2%(+5.04)#69 | 2.1%(+5.08)#1,971 |
| 70. | Shabbona | 7.1% | 2.2%(+4.89)#70 | 2.1%(+4.93)#2,034 |
| 71. | Nauvoo | 7.0% | 2.2%(+4.83)#71 | 2.1%(+4.87)#2,065 |
| 72. | Emden | 6.9% | 2.2%(+4.74)#72 | 2.1%(+4.79)#2,112 |
| 73. | Forsyth | 6.9% | 2.2%(+4.74)#73 | 2.1%(+4.78)#2,118 |
| 74. | Washington Park | 6.9% | 2.2%(+4.72)#74 | 2.1%(+4.77)#2,122 |
| 75. | Elvaston | 6.8% | 2.2%(+4.66)#75 | 2.1%(+4.70)#2,163 |
| 76. | The Galena Territory | 6.8% | 2.2%(+4.63)#76 | 2.1%(+4.67)#2,174 |
| 77. | Polo | 6.7% | 2.2%(+4.49)#77 | 2.1%(+4.54)#2,248 |
| 78. | Rushville | 6.6% | 2.2%(+4.39)#78 | 2.1%(+4.43)#2,315 |
| 79. | Lake Camelot | 6.5% | 2.2%(+4.34)#79 | 2.1%(+4.38)#2,339 |
| 80. | Anna | 6.5% | 2.2%(+4.30)#80 | 2.1%(+4.34)#2,359 |
| 81. | Perry | 6.5% | 2.2%(+4.26)#81 | 2.1%(+4.30)#2,389 |
| 82. | Stanford | 6.4% | 2.2%(+4.21)#82 | 2.1%(+4.26)#2,422 |
| 83. | Ford Heights | 6.4% | 2.2%(+4.20)#83 | 2.1%(+4.24)#2,433 |
| 84. | Baldwin | 6.3% | 2.2%(+4.16)#84 | 2.1%(+4.20)#2,470 |
| 85. | Rockport | 6.3% | 2.2%(+4.16)#85 | 2.1%(+4.20)#2,473 |
| 86. | Johnsburg | 6.3% | 2.2%(+4.15)#86 | 2.1%(+4.19)#2,475 |
| 87. | Augusta | 6.2% | 2.2%(+4.06)#87 | 2.1%(+4.10)#2,525 |
| 88. | Alsey | 6.2% | 2.2%(+4.06)#88 | 2.1%(+4.10)#2,530 |
| 89. | Amboy | 6.2% | 2.2%(+4.02)#89 | 2.1%(+4.06)#2,556 |
| 90. | Stewardson | 6.1% | 2.2%(+3.95)#90 | 2.1%(+4.00)#2,594 |
| 91. | Rome | 6.1% | 2.2%(+3.92)#91 | 2.1%(+3.96)#2,619 |
| 92. | Broadview | 6.1% | 2.2%(+3.88)#92 | 2.1%(+3.93)#2,641 |
| 93. | Cutler | 6.1% | 2.2%(+3.87)#93 | 2.1%(+3.91)#2,658 |
| 94. | Buncombe | 6.0% | 2.2%(+3.84)#94 | 2.1%(+3.89)#2,682 |
| 95. | Reddick | 6.0% | 2.2%(+3.83)#95 | 2.1%(+3.88)#2,691 |
| 96. | Hanaford | 6.0% | 2.2%(+3.81)#96 | 2.1%(+3.85)#2,708 |
| 97. | Monmouth | 6.0% | 2.2%(+3.79)#97 | 2.1%(+3.84)#2,720 |
| 98. | Gorham | 6.0% | 2.2%(+3.78)#98 | 2.1%(+3.82)#2,730 |
| 99. | New Holland | 5.9% | 2.2%(+3.74)#99 | 2.1%(+3.78)#2,770 |
| 100. | Spring Valley | 5.9% | 2.2%(+3.73)#100 | 2.1%(+3.78)#2,774 |
Common Questions
What are the Top 10 Cities with the Highest Percentage of Population Employed in Security & Protection in Illinois?
Top 10 Cities with the Highest Percentage of Population Employed in Security & Protection in Illinois are:
#1
33.3%
#2
19.2%
#3
17.4%
#4
16.9%
#5
16.3%
#6
16.0%
#7
14.6%
#8
13.8%
#9
12.9%
#10
12.8%
What city has the Highest Percentage of Population Employed in Security & Protection in Illinois?
Kaskaskia has the Highest Percentage of Population Employed in Security & Protection in Illinois with 33.3%.
What is the Percentage of Population Employed in Security & Protection in the State of Illinois?
Percentage of Population Employed in Security & Protection in Illinois is 2.2%.
What is the Percentage of Population Employed in Security & Protection in the United States?
Percentage of Population Employed in Security & Protection in the United States is 2.1%.