Cities with the Highest Percentage of Immigrants from Southern Europe in Illinois
RELATED REPORTS & OPTIONS
Southern Europe
Illinois
Compare Cities
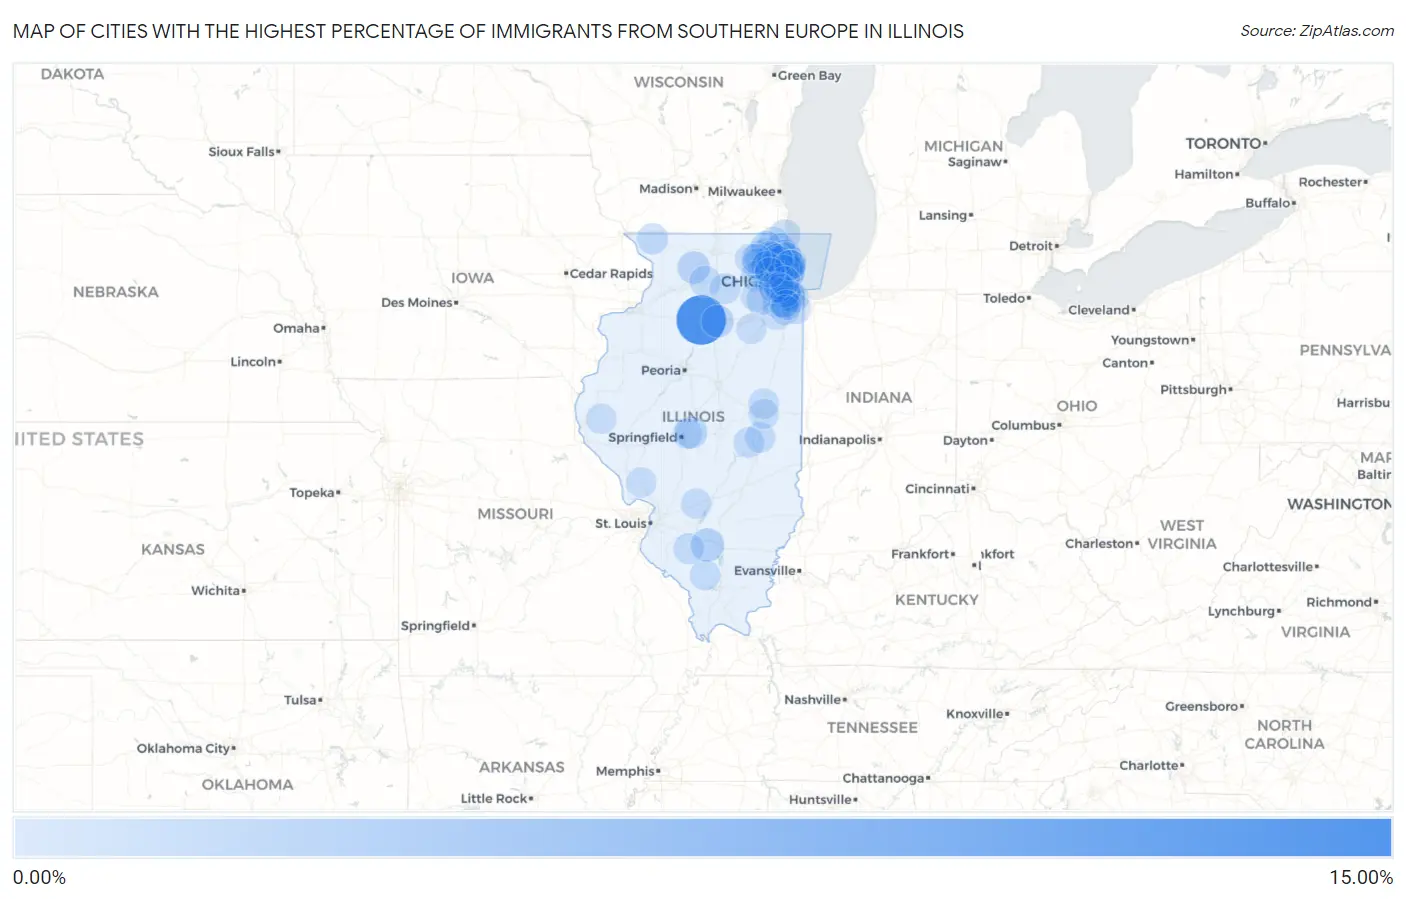
Map of Cities with the Highest Percentage of Immigrants from Southern Europe in Illinois
0.00%
15.00%
Cities with the Highest Percentage of Immigrants from Southern Europe in Illinois
| City | Southern Europe | vs State | vs National | |
| 1. | Hollowayville | 12.20% | 0.23%(+12.0)#1 | 0.22%(+12.0)#11 |
| 2. | Norridge | 5.11% | 0.23%(+4.87)#2 | 0.22%(+4.89)#71 |
| 3. | Addison | 3.00% | 0.23%(+2.76)#3 | 0.22%(+2.78)#156 |
| 4. | Harwood Heights | 2.77% | 0.23%(+2.54)#4 | 0.22%(+2.55)#175 |
| 5. | Ashley | 2.19% | 0.23%(+1.96)#5 | 0.22%(+1.97)#252 |
| 6. | Schiller Park | 2.14% | 0.23%(+1.90)#6 | 0.22%(+1.92)#261 |
| 7. | Winnetka | 1.84% | 0.23%(+1.61)#7 | 0.22%(+1.62)#322 |
| 8. | Mount Morris | 1.72% | 0.23%(+1.48)#8 | 0.22%(+1.50)#363 |
| 9. | Niles | 1.70% | 0.23%(+1.46)#9 | 0.22%(+1.48)#370 |
| 10. | North Utica | 1.67% | 0.23%(+1.44)#10 | 0.22%(+1.45)#374 |
| 11. | Westchester | 1.57% | 0.23%(+1.34)#11 | 0.22%(+1.35)#410 |
| 12. | Dawson | 1.49% | 0.23%(+1.26)#12 | 0.22%(+1.27)#438 |
| 13. | Bannockburn | 1.41% | 0.23%(+1.17)#13 | 0.22%(+1.19)#470 |
| 14. | Morton Grove | 1.40% | 0.23%(+1.16)#14 | 0.22%(+1.18)#477 |
| 15. | Mount Prospect | 1.32% | 0.23%(+1.09)#15 | 0.22%(+1.10)#526 |
| 16. | Bloomingdale | 1.31% | 0.23%(+1.08)#16 | 0.22%(+1.09)#535 |
| 17. | Elmwood Park | 1.25% | 0.23%(+1.01)#17 | 0.22%(+1.03)#568 |
| 18. | Northfield | 1.24% | 0.23%(+1.01)#18 | 0.22%(+1.02)#569 |
| 19. | Palos Hills | 1.23% | 0.23%(+0.992)#19 | 0.22%(+1.01)#581 |
| 20. | Melrose Park | 1.16% | 0.23%(+0.926)#20 | 0.22%(+0.940)#628 |
| 21. | South Barrington | 1.14% | 0.23%(+0.906)#21 | 0.22%(+0.920)#643 |
| 22. | Wood Dale | 1.09% | 0.23%(+0.852)#22 | 0.22%(+0.866)#693 |
| 23. | Bartlett | 1.04% | 0.23%(+0.802)#23 | 0.22%(+0.816)#745 |
| 24. | North Riverside | 1.04% | 0.23%(+0.801)#24 | 0.22%(+0.815)#749 |
| 25. | Prospect Heights | 1.03% | 0.23%(+0.794)#25 | 0.22%(+0.808)#755 |
| 26. | Tower Lakes | 1.01% | 0.23%(+0.780)#26 | 0.22%(+0.794)#763 |
| 27. | Trout Valley | 1.01% | 0.23%(+0.778)#27 | 0.22%(+0.792)#765 |
| 28. | Apple Canyon Lake | 0.99% | 0.23%(+0.760)#28 | 0.22%(+0.774)#785 |
| 29. | Itasca | 0.98% | 0.23%(+0.742)#29 | 0.22%(+0.756)#804 |
| 30. | Orland Park | 0.97% | 0.23%(+0.734)#30 | 0.22%(+0.748)#813 |
| 31. | Winthrop Harbor | 0.94% | 0.23%(+0.707)#31 | 0.22%(+0.721)#840 |
| 32. | Third Lake | 0.91% | 0.23%(+0.672)#32 | 0.22%(+0.686)#883 |
| 33. | Darien | 0.88% | 0.23%(+0.650)#33 | 0.22%(+0.664)#908 |
| 34. | Ashton | 0.87% | 0.23%(+0.632)#34 | 0.22%(+0.646)#923 |
| 35. | Worth | 0.82% | 0.23%(+0.586)#35 | 0.22%(+0.600)#974 |
| 36. | Bedford Park | 0.81% | 0.23%(+0.574)#36 | 0.22%(+0.588)#989 |
| 37. | Inverness | 0.79% | 0.23%(+0.556)#37 | 0.22%(+0.570)#1,024 |
| 38. | Northbrook | 0.78% | 0.23%(+0.541)#38 | 0.22%(+0.555)#1,039 |
| 39. | Deerfield | 0.76% | 0.23%(+0.528)#39 | 0.22%(+0.541)#1,059 |
| 40. | Shabbona | 0.76% | 0.23%(+0.527)#40 | 0.22%(+0.541)#1,060 |
| 41. | River Grove | 0.74% | 0.23%(+0.507)#41 | 0.22%(+0.521)#1,087 |
| 42. | Highwood | 0.73% | 0.23%(+0.493)#42 | 0.22%(+0.507)#1,122 |
| 43. | Green Oaks | 0.71% | 0.23%(+0.474)#43 | 0.22%(+0.488)#1,169 |
| 44. | Oak Lawn | 0.71% | 0.23%(+0.474)#44 | 0.22%(+0.487)#1,170 |
| 45. | Arlington Heights | 0.69% | 0.23%(+0.454)#45 | 0.22%(+0.468)#1,209 |
| 46. | Glenview | 0.68% | 0.23%(+0.445)#46 | 0.22%(+0.459)#1,228 |
| 47. | Oakdale | 0.68% | 0.23%(+0.444)#47 | 0.22%(+0.458)#1,230 |
| 48. | Volo | 0.66% | 0.23%(+0.426)#48 | 0.22%(+0.439)#1,282 |
| 49. | Sleepy Hollow | 0.66% | 0.23%(+0.421)#49 | 0.22%(+0.435)#1,292 |
| 50. | Arthur | 0.65% | 0.23%(+0.419)#50 | 0.22%(+0.433)#1,297 |
| 51. | Highland Park | 0.65% | 0.23%(+0.418)#51 | 0.22%(+0.432)#1,299 |
| 52. | Homer Glen | 0.65% | 0.23%(+0.415)#52 | 0.22%(+0.429)#1,303 |
| 53. | Bensenville | 0.64% | 0.23%(+0.403)#53 | 0.22%(+0.417)#1,332 |
| 54. | Burr Ridge | 0.63% | 0.23%(+0.395)#54 | 0.22%(+0.409)#1,348 |
| 55. | St Charles | 0.61% | 0.23%(+0.379)#55 | 0.22%(+0.393)#1,391 |
| 56. | Elkville | 0.61% | 0.23%(+0.377)#56 | 0.22%(+0.391)#1,396 |
| 57. | Carol Stream | 0.61% | 0.23%(+0.374)#57 | 0.22%(+0.388)#1,405 |
| 58. | Greenville | 0.60% | 0.23%(+0.370)#58 | 0.22%(+0.384)#1,412 |
| 59. | Elk Grove Village | 0.59% | 0.23%(+0.360)#59 | 0.22%(+0.374)#1,427 |
| 60. | Oswego | 0.59% | 0.23%(+0.355)#60 | 0.22%(+0.369)#1,438 |
| 61. | Lincolnwood | 0.59% | 0.23%(+0.354)#61 | 0.22%(+0.368)#1,442 |
| 62. | Thomasboro | 0.59% | 0.23%(+0.353)#62 | 0.22%(+0.366)#1,444 |
| 63. | Palos Heights | 0.59% | 0.23%(+0.351)#63 | 0.22%(+0.365)#1,448 |
| 64. | Oak Brook | 0.58% | 0.23%(+0.349)#64 | 0.22%(+0.363)#1,452 |
| 65. | Franklin Park | 0.57% | 0.23%(+0.337)#65 | 0.22%(+0.351)#1,474 |
| 66. | Alsip | 0.57% | 0.23%(+0.333)#66 | 0.22%(+0.347)#1,492 |
| 67. | Tuscola | 0.55% | 0.23%(+0.318)#67 | 0.22%(+0.332)#1,539 |
| 68. | Des Plaines | 0.54% | 0.23%(+0.310)#68 | 0.22%(+0.324)#1,557 |
| 69. | Skokie | 0.52% | 0.23%(+0.282)#69 | 0.22%(+0.296)#1,630 |
| 70. | Kenilworth | 0.51% | 0.23%(+0.278)#70 | 0.22%(+0.292)#1,640 |
| 71. | Kildeer | 0.51% | 0.23%(+0.274)#71 | 0.22%(+0.288)#1,655 |
| 72. | Huntley | 0.51% | 0.23%(+0.272)#72 | 0.22%(+0.286)#1,659 |
| 73. | Schaumburg | 0.50% | 0.23%(+0.269)#73 | 0.22%(+0.283)#1,666 |
| 74. | Camp Point | 0.50% | 0.23%(+0.266)#74 | 0.22%(+0.280)#1,672 |
| 75. | Wheeling | 0.50% | 0.23%(+0.263)#75 | 0.22%(+0.277)#1,679 |
| 76. | Riverton | 0.48% | 0.23%(+0.248)#76 | 0.22%(+0.262)#1,735 |
| 77. | Lake Zurich | 0.48% | 0.23%(+0.242)#77 | 0.22%(+0.256)#1,755 |
| 78. | Park Ridge | 0.48% | 0.23%(+0.241)#78 | 0.22%(+0.255)#1,758 |
| 79. | Urbana | 0.47% | 0.23%(+0.236)#79 | 0.22%(+0.250)#1,774 |
| 80. | Manhattan | 0.47% | 0.23%(+0.235)#80 | 0.22%(+0.249)#1,776 |
| 81. | Plainfield | 0.47% | 0.23%(+0.231)#81 | 0.22%(+0.245)#1,789 |
| 82. | Bridgeview | 0.45% | 0.23%(+0.221)#82 | 0.22%(+0.235)#1,820 |
| 83. | Blue Island | 0.45% | 0.23%(+0.220)#83 | 0.22%(+0.233)#1,824 |
| 84. | Elmhurst | 0.45% | 0.23%(+0.217)#84 | 0.22%(+0.231)#1,830 |
| 85. | Kane | 0.44% | 0.23%(+0.207)#85 | 0.22%(+0.220)#1,876 |
| 86. | Hoffman Estates | 0.44% | 0.23%(+0.203)#86 | 0.22%(+0.217)#1,881 |
| 87. | Downers Grove | 0.43% | 0.23%(+0.194)#87 | 0.22%(+0.208)#1,915 |
| 88. | Indian Head Park | 0.42% | 0.23%(+0.189)#88 | 0.22%(+0.203)#1,938 |
| 89. | Buffalo Grove | 0.41% | 0.23%(+0.178)#89 | 0.22%(+0.192)#1,966 |
| 90. | Orland Hills | 0.41% | 0.23%(+0.175)#90 | 0.22%(+0.189)#1,981 |
| 91. | Chicago Heights | 0.41% | 0.23%(+0.172)#91 | 0.22%(+0.186)#1,997 |
| 92. | Algonquin | 0.40% | 0.23%(+0.164)#92 | 0.22%(+0.178)#2,017 |
| 93. | Hickory Hills | 0.40% | 0.23%(+0.162)#93 | 0.22%(+0.176)#2,030 |
| 94. | Wilmette | 0.39% | 0.23%(+0.155)#94 | 0.22%(+0.168)#2,056 |
| 95. | Hinsdale | 0.38% | 0.23%(+0.150)#95 | 0.22%(+0.164)#2,074 |
| 96. | Forest Park | 0.38% | 0.23%(+0.147)#96 | 0.22%(+0.161)#2,097 |
| 97. | Mazon | 0.38% | 0.23%(+0.146)#97 | 0.22%(+0.160)#2,101 |
| 98. | Frankfort | 0.38% | 0.23%(+0.146)#98 | 0.22%(+0.160)#2,102 |
| 99. | Tinley Park | 0.38% | 0.23%(+0.144)#99 | 0.22%(+0.158)#2,112 |
| 100. | Roselle | 0.38% | 0.23%(+0.142)#100 | 0.22%(+0.156)#2,118 |
Common Questions
What are the Top 10 Cities with the Highest Percentage of Immigrants from Southern Europe in Illinois?
Top 10 Cities with the Highest Percentage of Immigrants from Southern Europe in Illinois are:
#1
12.20%
#2
5.11%
#3
3.00%
#4
2.77%
#5
2.19%
#6
2.14%
#7
1.84%
#8
1.72%
#9
1.70%
#10
1.67%
What city has the Highest Percentage of Immigrants from Southern Europe in Illinois?
Hollowayville has the Highest Percentage of Immigrants from Southern Europe in Illinois with 12.20%.
What is the Percentage of Immigrants from Southern Europe in the State of Illinois?
Percentage of Immigrants from Southern Europe in Illinois is 0.23%.
What is the Percentage of Immigrants from Southern Europe in the United States?
Percentage of Immigrants from Southern Europe in the United States is 0.22%.