Cities with the Highest Percentage of Immigrants from South Eastern Asia in Georgia
RELATED REPORTS & OPTIONS
South Eastern Asia
Georgia
Compare Cities
Map of Cities with the Highest Percentage of Immigrants from South Eastern Asia in Georgia
0.00%
30.00%
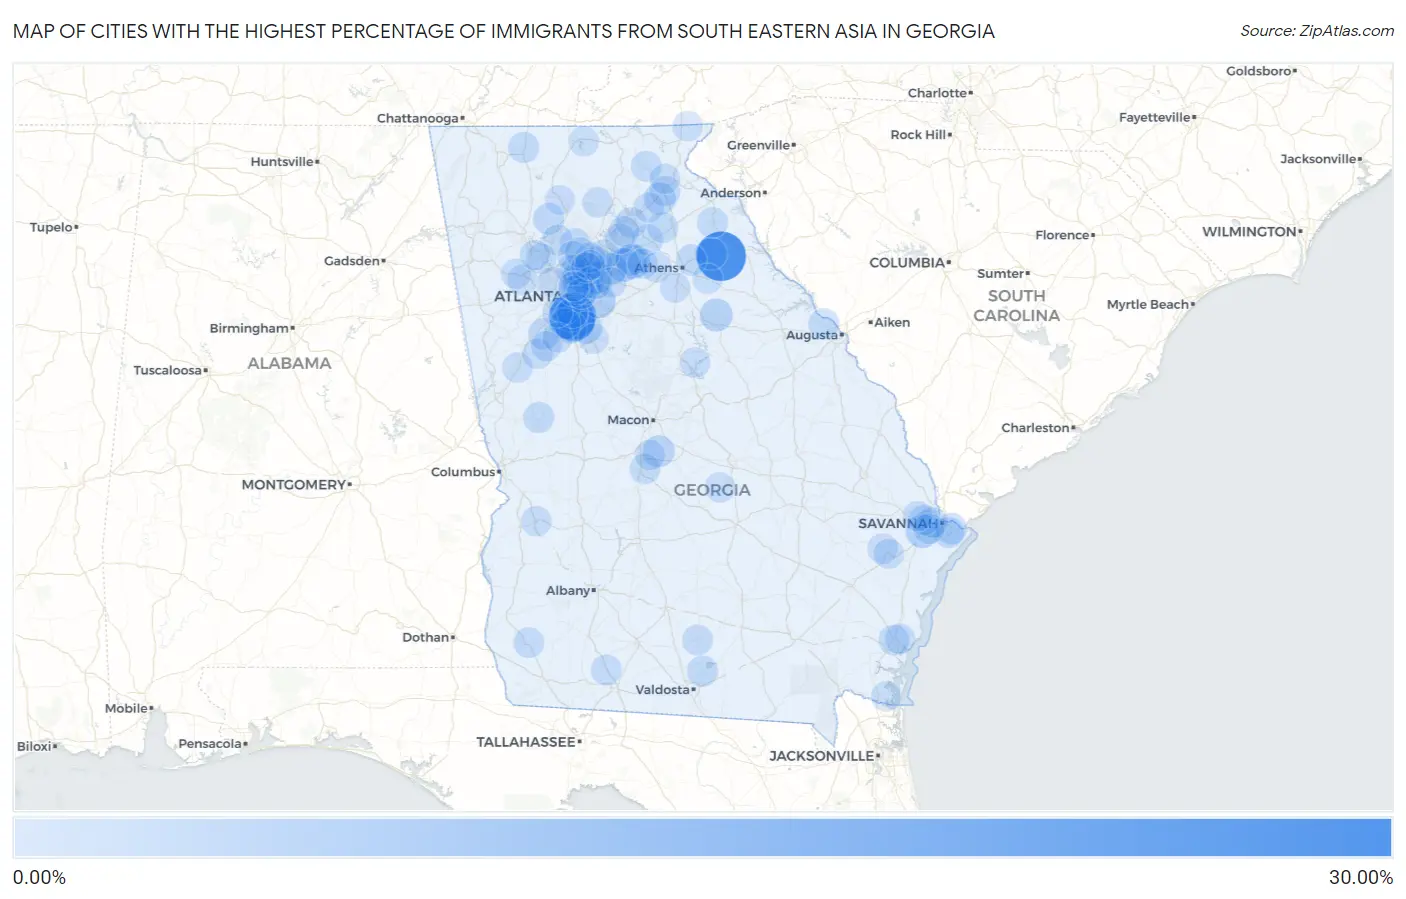
Cities with the Highest Percentage of Immigrants from South Eastern Asia in Georgia
| City | South Eastern Asia | vs State | vs National | |
| 1. | Carlton | 28.78% | 0.84%(+27.9)#-1 | 1.30%(+27.5)#0 |
| 2. | Lake City | 24.21% | 0.84%(+23.4)#0 | 1.30%(+22.9)#1 |
| 3. | Morrow | 18.56% | 0.84%(+17.7)#1 | 1.30%(+17.3)#2 |
| 4. | Carl | 7.43% | 0.84%(+6.60)#2 | 1.30%(+6.14)#3 |
| 5. | Clarkston | 5.99% | 0.84%(+5.16)#3 | 1.30%(+4.70)#4 |
| 6. | Lithonia | 5.93% | 0.84%(+5.09)#4 | 1.30%(+4.63)#5 |
| 7. | Dacula | 5.59% | 0.84%(+4.75)#5 | 1.30%(+4.29)#6 |
| 8. | Henderson | 5.22% | 0.84%(+4.39)#6 | 1.30%(+3.93)#7 |
| 9. | Doraville | 5.13% | 0.84%(+4.29)#7 | 1.30%(+3.83)#8 |
| 10. | Lilburn | 4.98% | 0.84%(+4.14)#8 | 1.30%(+3.68)#177 |
| 11. | Forest Park | 4.45% | 0.84%(+3.62)#9 | 1.30%(+3.16)#178 |
| 12. | Union Point | 4.33% | 0.84%(+3.50)#10 | 1.30%(+3.04)#179 |
| 13. | Norcross | 4.24% | 0.84%(+3.41)#11 | 1.30%(+2.95)#180 |
| 14. | Lawrenceville | 3.47% | 0.84%(+2.64)#12 | 1.30%(+2.18)#181 |
| 15. | Alto | 3.46% | 0.84%(+2.63)#13 | 1.30%(+2.17)#182 |
| 16. | Stockbridge | 3.44% | 0.84%(+2.60)#14 | 1.30%(+2.14)#183 |
| 17. | Robins Afb | 3.42% | 0.84%(+2.58)#15 | 1.30%(+2.12)#184 |
| 18. | Comer | 3.15% | 0.84%(+2.31)#16 | 1.30%(+1.85)#185 |
| 19. | Jonesboro | 3.01% | 0.84%(+2.18)#17 | 1.30%(+1.72)#186 |
| 20. | Duluth | 2.87% | 0.84%(+2.03)#18 | 1.30%(+1.57)#187 |
| 21. | Tucker | 2.53% | 0.84%(+1.69)#19 | 1.30%(+1.23)#188 |
| 22. | Waleska | 2.36% | 0.84%(+1.52)#20 | 1.30%(+1.06)#189 |
| 23. | Chamblee | 2.32% | 0.84%(+1.48)#21 | 1.30%(+1.02)#190 |
| 24. | Auburn | 2.28% | 0.84%(+1.45)#22 | 1.30%(+0.987)#191 |
| 25. | Tyrone | 2.23% | 0.84%(+1.39)#23 | 1.30%(+0.935)#192 |
| 26. | Whitemarsh Island | 2.16% | 0.84%(+1.33)#24 | 1.30%(+0.869)#193 |
| 27. | Pendergrass | 2.11% | 0.84%(+1.28)#25 | 1.30%(+0.815)#194 |
| 28. | Eton | 2.10% | 0.84%(+1.26)#26 | 1.30%(+0.800)#195 |
| 29. | Hapeville | 1.98% | 0.84%(+1.14)#27 | 1.30%(+0.684)#196 |
| 30. | Conley | 1.95% | 0.84%(+1.12)#28 | 1.30%(+0.655)#197 |
| 31. | Hull | 1.95% | 0.84%(+1.11)#29 | 1.30%(+0.655)#198 |
| 32. | Manchester | 1.91% | 0.84%(+1.07)#30 | 1.30%(+0.614)#199 |
| 33. | Ellerslie | 1.83% | 0.84%(+0.996)#31 | 1.30%(+0.536)#200 |
| 34. | Dutch Island | 1.81% | 0.84%(+0.977)#32 | 1.30%(+0.518)#201 |
| 35. | Moody Afb | 1.79% | 0.84%(+0.956)#33 | 1.30%(+0.497)#202 |
| 36. | Milton | 1.77% | 0.84%(+0.936)#34 | 1.30%(+0.476)#203 |
| 37. | Garden City | 1.77% | 0.84%(+0.931)#35 | 1.30%(+0.471)#204 |
| 38. | Evans | 1.74% | 0.84%(+0.899)#36 | 1.30%(+0.439)#205 |
| 39. | Riverdale | 1.70% | 0.84%(+0.865)#37 | 1.30%(+0.405)#206 |
| 40. | Maysville | 1.68% | 0.84%(+0.845)#38 | 1.30%(+0.385)#207 |
| 41. | Ochlocknee | 1.64% | 0.84%(+0.801)#39 | 1.30%(+0.341)#208 |
| 42. | Mountain Park | 1.63% | 0.84%(+0.791)#40 | 1.30%(+0.331)#209 |
| 43. | Gainesville | 1.56% | 0.84%(+0.720)#41 | 1.30%(+0.260)#210 |
| 44. | North Decatur | 1.54% | 0.84%(+0.700)#42 | 1.30%(+0.240)#211 |
| 45. | Royston | 1.48% | 0.84%(+0.639)#43 | 1.30%(+0.179)#212 |
| 46. | Suwanee | 1.43% | 0.84%(+0.595)#44 | 1.30%(+0.135)#213 |
| 47. | Nashville | 1.43% | 0.84%(+0.590)#45 | 1.30%(+0.130)#214 |
| 48. | Perry | 1.41% | 0.84%(+0.578)#46 | 1.30%(+0.118)#215 |
| 49. | Pooler | 1.40% | 0.84%(+0.569)#47 | 1.30%(+0.109)#216 |
| 50. | Holly Springs | 1.39% | 0.84%(+0.555)#48 | 1.30%(+0.095)#217 |
| 51. | Savannah | 1.38% | 0.84%(+0.547)#49 | 1.30%(+0.087)#218 |
| 52. | Cornelia | 1.38% | 0.84%(+0.541)#50 | 1.30%(+0.081)#219 |
| 53. | Dock Junction | 1.37% | 0.84%(+0.533)#51 | 1.30%(+0.074)#220 |
| 54. | Druid Hills | 1.33% | 0.84%(+0.498)#52 | 1.30%(+0.038)#221 |
| 55. | Kennesaw | 1.32% | 0.84%(+0.480)#53 | 1.30%(+0.020)#222 |
| 56. | Bemiss | 1.29% | 0.84%(+0.457)#54 | 1.30%(-0.003)#223 |
| 57. | Colquitt | 1.27% | 0.84%(+0.431)#55 | 1.30%(-0.029)#224 |
| 58. | Dunwoody | 1.26% | 0.84%(+0.423)#56 | 1.30%(-0.037)#293 |
| 59. | Sautee Nacoochee | 1.23% | 0.84%(+0.398)#57 | 1.30%(-0.062)#294 |
| 60. | Cusseta Chattahoochee County Unified Government | 1.22% | 0.84%(+0.387)#58 | 1.30%(-0.073)#295 |
| 61. | Sandy Springs | 1.18% | 0.84%(+0.348)#59 | 1.30%(-0.112)#296 |
| 62. | Warner Robins | 1.17% | 0.84%(+0.334)#60 | 1.30%(-0.126)#297 |
| 63. | Fort Stewart | 1.16% | 0.84%(+0.322)#61 | 1.30%(-0.138)#298 |
| 64. | Grantville | 1.10% | 0.84%(+0.266)#62 | 1.30%(-0.194)#299 |
| 65. | Richland | 1.09% | 0.84%(+0.249)#63 | 1.30%(-0.211)#300 |
| 66. | Avondale Estates | 1.08% | 0.84%(+0.247)#64 | 1.30%(-0.213)#301 |
| 67. | Roswell | 1.08% | 0.84%(+0.247)#65 | 1.30%(-0.213)#302 |
| 68. | Snellville | 1.08% | 0.84%(+0.245)#66 | 1.30%(-0.215)#303 |
| 69. | Flowery Branch | 1.06% | 0.84%(+0.225)#67 | 1.30%(-0.234)#304 |
| 70. | Sharpsburg | 1.05% | 0.84%(+0.216)#68 | 1.30%(-0.244)#305 |
| 71. | Johns Creek | 1.03% | 0.84%(+0.196)#69 | 1.30%(-0.264)#358 |
| 72. | Alpharetta | 1.03% | 0.84%(+0.191)#70 | 1.30%(-0.269)#359 |
| 73. | Hiram | 1.00% | 0.84%(+0.161)#71 | 1.30%(-0.299)#360 |
| 74. | Oakwood | 0.99% | 0.84%(+0.157)#72 | 1.30%(-0.303)#361 |
| 75. | Winder | 0.96% | 0.84%(+0.125)#73 | 1.30%(-0.335)#362 |
| 76. | Country Club Estates | 0.96% | 0.84%(+0.124)#74 | 1.30%(-0.336)#363 |
| 77. | Dawsonville | 0.96% | 0.84%(+0.119)#75 | 1.30%(-0.340)#364 |
| 78. | Peachtree City | 0.92% | 0.84%(+0.088)#76 | 1.30%(-0.372)#365 |
| 79. | Crooked Creek | 0.89% | 0.84%(+0.054)#77 | 1.30%(-0.406)#366 |
| 80. | Fayetteville | 0.88% | 0.84%(+0.042)#78 | 1.30%(-0.418)#367 |
| 81. | Bishop | 0.88% | 0.84%(+0.041)#79 | 1.30%(-0.419)#368 |
| 82. | Smyrna | 0.86% | 0.84%(+0.025)#80 | 1.30%(-0.435)#369 |
| 83. | Dallas | 0.86% | 0.84%(+0.020)#81 | 1.30%(-0.440)#370 |
| 84. | Acworth | 0.85% | 0.84%(+0.015)#82 | 1.30%(-0.445)#371 |
| 85. | Clarkesville | 0.85% | 0.84%(+0.012)#83 | 1.30%(-0.448)#372 |
| 86. | Sky Valley | 0.83% | 0.84%(-0.002)#84 | 1.30%(-0.462)#373 |
| 87. | Bloomingdale | 0.82% | 0.84%(-0.018)#85 | 1.30%(-0.478)#374 |
| 88. | Peachtree Corners | 0.81% | 0.84%(-0.030)#86 | 1.30%(-0.490)#375 |
| 89. | Lula | 0.80% | 0.84%(-0.038)#87 | 1.30%(-0.498)#376 |
| 90. | Berkeley Lake | 0.79% | 0.84%(-0.045)#88 | 1.30%(-0.505)#377 |
| 91. | Cadwell | 0.79% | 0.84%(-0.047)#89 | 1.30%(-0.506)#378 |
| 92. | North Druid Hills | 0.78% | 0.84%(-0.059)#90 | 1.30%(-0.519)#379 |
| 93. | Flemington | 0.75% | 0.84%(-0.088)#91 | 1.30%(-0.548)#380 |
| 94. | Statham | 0.74% | 0.84%(-0.094)#92 | 1.30%(-0.554)#381 |
| 95. | Mcdonough | 0.72% | 0.84%(-0.119)#93 | 1.30%(-0.579)#382 |
| 96. | St Marys | 0.70% | 0.84%(-0.134)#94 | 1.30%(-0.594)#383 |
| 97. | Morganton | 0.69% | 0.84%(-0.142)#95 | 1.30%(-0.602)#384 |
| 98. | Jasper | 0.69% | 0.84%(-0.142)#96 | 1.30%(-0.602)#385 |
| 99. | College Park | 0.69% | 0.84%(-0.149)#97 | 1.30%(-0.609)#386 |
| 100. | Crawford | 0.69% | 0.84%(-0.149)#98 | 1.30%(-0.609)#387 |
Common Questions
What are the Top 10 Cities with the Highest Percentage of Immigrants from South Eastern Asia in Georgia?
Top 10 Cities with the Highest Percentage of Immigrants from South Eastern Asia in Georgia are:
What city has the Highest Percentage of Immigrants from South Eastern Asia in Georgia?
Carlton has the Highest Percentage of Immigrants from South Eastern Asia in Georgia with 28.78%.
What is the Percentage of Immigrants from South Eastern Asia in the State of Georgia?
Percentage of Immigrants from South Eastern Asia in Georgia is 0.84%.
What is the Percentage of Immigrants from South Eastern Asia in the United States?
Percentage of Immigrants from South Eastern Asia in the United States is 1.30%.