Cities with the Most Immigrants from Nepal in Illinois
RELATED REPORTS & OPTIONS
Nepal
Illinois
Compare Cities
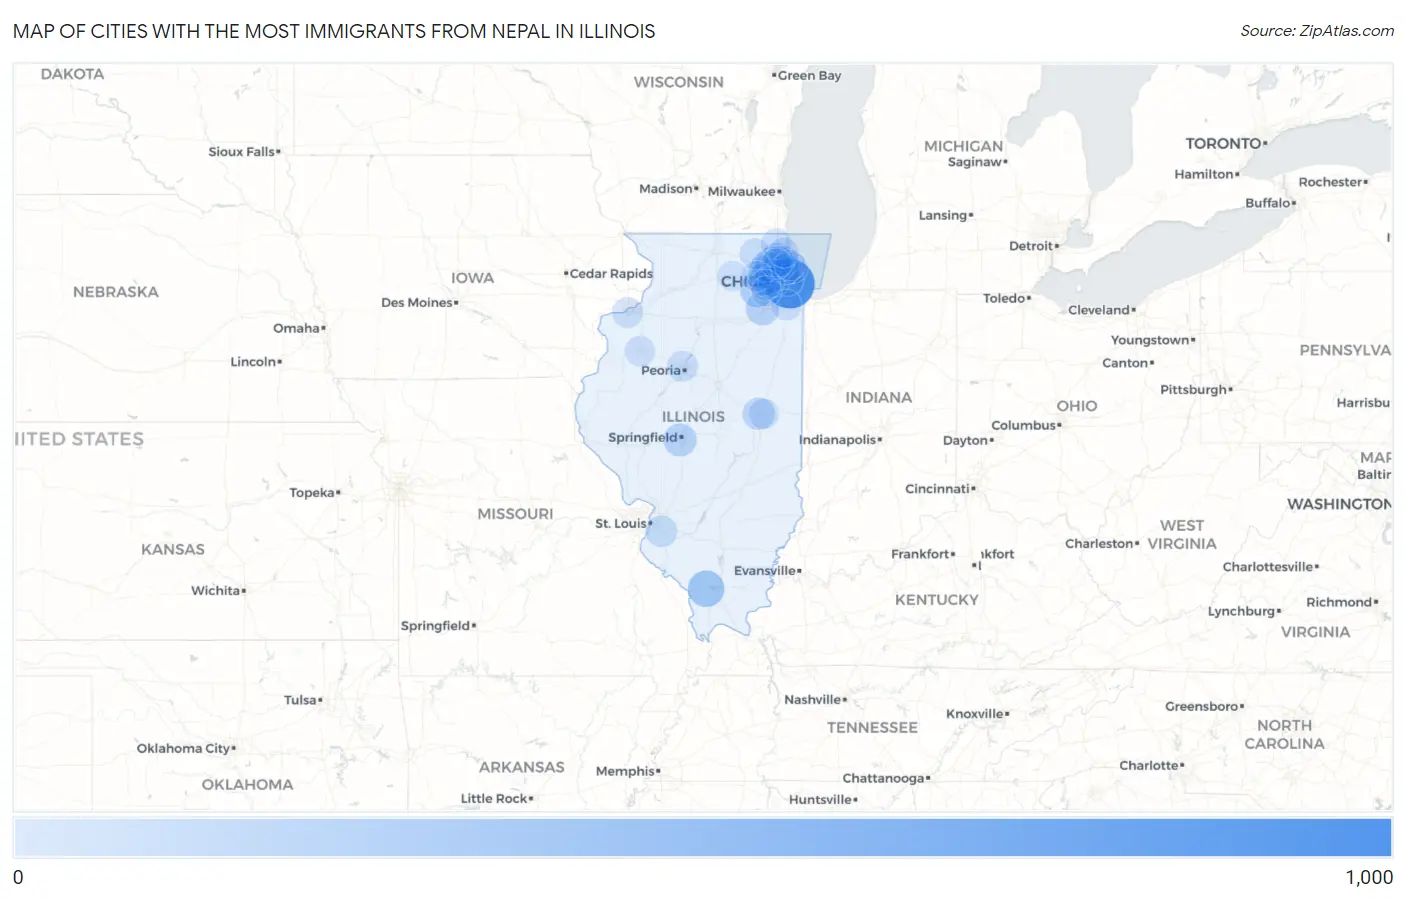
Map of Cities with the Most Immigrants from Nepal in Illinois
0
1,000
Cities with the Most Immigrants from Nepal in Illinois
| City | Nepal | vs State | vs National | |
| 1. | Chicago | 974 | 3,231(30.15%)#1 | 165,080(0.59%)#12 |
| 2. | Carbondale | 304 | 3,231(9.41%)#2 | 165,080(0.18%)#96 |
| 3. | Aurora | 212 | 3,231(6.56%)#3 | 165,080(0.13%)#153 |
| 4. | Carol Stream | 206 | 3,231(6.38%)#4 | 165,080(0.12%)#161 |
| 5. | Shorewood | 150 | 3,231(4.64%)#5 | 165,080(0.09%)#231 |
| 6. | Springfield | 139 | 3,231(4.30%)#6 | 165,080(0.08%)#246 |
| 7. | Bartlett | 119 | 3,231(3.68%)#7 | 165,080(0.07%)#277 |
| 8. | Palatine | 115 | 3,231(3.56%)#8 | 165,080(0.07%)#286 |
| 9. | Champaign | 103 | 3,231(3.19%)#9 | 165,080(0.06%)#316 |
| 10. | Buffalo Grove | 86 | 3,231(2.66%)#10 | 165,080(0.05%)#372 |
| 11. | West Chicago | 80 | 3,231(2.48%)#11 | 165,080(0.05%)#398 |
| 12. | Schaumburg | 73 | 3,231(2.26%)#12 | 165,080(0.04%)#430 |
| 13. | Oak Park | 73 | 3,231(2.26%)#13 | 165,080(0.04%)#432 |
| 14. | Belleville | 69 | 3,231(2.14%)#14 | 165,080(0.04%)#451 |
| 15. | Park Ridge | 39 | 3,231(1.21%)#15 | 165,080(0.02%)#637 |
| 16. | Peoria | 35 | 3,231(1.08%)#16 | 165,080(0.02%)#670 |
| 17. | Crystal Lake | 30 | 3,231(0.93%)#17 | 165,080(0.02%)#734 |
| 18. | Evanston | 28 | 3,231(0.87%)#18 | 165,080(0.02%)#752 |
| 19. | Rock Island | 28 | 3,231(0.87%)#19 | 165,080(0.02%)#759 |
| 20. | Northbrook | 28 | 3,231(0.87%)#20 | 165,080(0.02%)#760 |
| 21. | Mount Prospect | 27 | 3,231(0.84%)#21 | 165,080(0.02%)#770 |
| 22. | Lombard | 24 | 3,231(0.74%)#22 | 165,080(0.01%)#809 |
| 23. | Tinley Park | 20 | 3,231(0.62%)#23 | 165,080(0.01%)#873 |
| 24. | Wheaton | 19 | 3,231(0.59%)#24 | 165,080(0.01%)#891 |
| 25. | Hoffman Estates | 19 | 3,231(0.59%)#25 | 165,080(0.01%)#892 |
| 26. | Gages Lake | 19 | 3,231(0.59%)#26 | 165,080(0.01%)#899 |
| 27. | Morton Grove | 17 | 3,231(0.53%)#27 | 165,080(0.01%)#932 |
| 28. | Wheeling | 13 | 3,231(0.40%)#28 | 165,080(0.01%)#1,003 |
| 29. | Wilmette | 13 | 3,231(0.40%)#29 | 165,080(0.01%)#1,007 |
| 30. | Urbana | 11 | 3,231(0.34%)#30 | 165,080(0.01%)#1,051 |
| 31. | Arlington Heights | 10 | 3,231(0.31%)#31 | 165,080(0.01%)#1,071 |
| 32. | Galesburg | 10 | 3,231(0.31%)#32 | 165,080(0.01%)#1,074 |
| 33. | Lake Forest | 9 | 3,231(0.28%)#33 | 165,080(0.01%)#1,096 |
| 34. | St Charles | 8 | 3,231(0.25%)#34 | 165,080(0.00%)#1,114 |
| 35. | Dekalb | 7 | 3,231(0.22%)#35 | 165,080(0.00%)#1,137 |
| 36. | Warrenville | 7 | 3,231(0.22%)#36 | 165,080(0.00%)#1,149 |
| 37. | Naperville | 3 | 3,231(0.09%)#37 | 165,080(0.00%)#1,220 |
Common Questions
What are the Top 10 Cities with the Most Immigrants from Nepal in Illinois?
Top 10 Cities with the Most Immigrants from Nepal in Illinois are:
#1
974
#2
304
#3
212
#4
206
#5
150
#6
139
#7
119
#8
115
#9
103
#10
86
What city has the Most Immigrants from Nepal in Illinois?
Chicago has the Most Immigrants from Nepal in Illinois with 974.
What is the Total Immigrants from Nepal in the State of Illinois?
Total Immigrants from Nepal in Illinois is 3,231.
What is the Total Immigrants from Nepal in the United States?
Total Immigrants from Nepal in the United States is 165,080.