Cities with the Most Immigrants from Haiti in Illinois
RELATED REPORTS & OPTIONS
Haiti
Illinois
Compare Cities
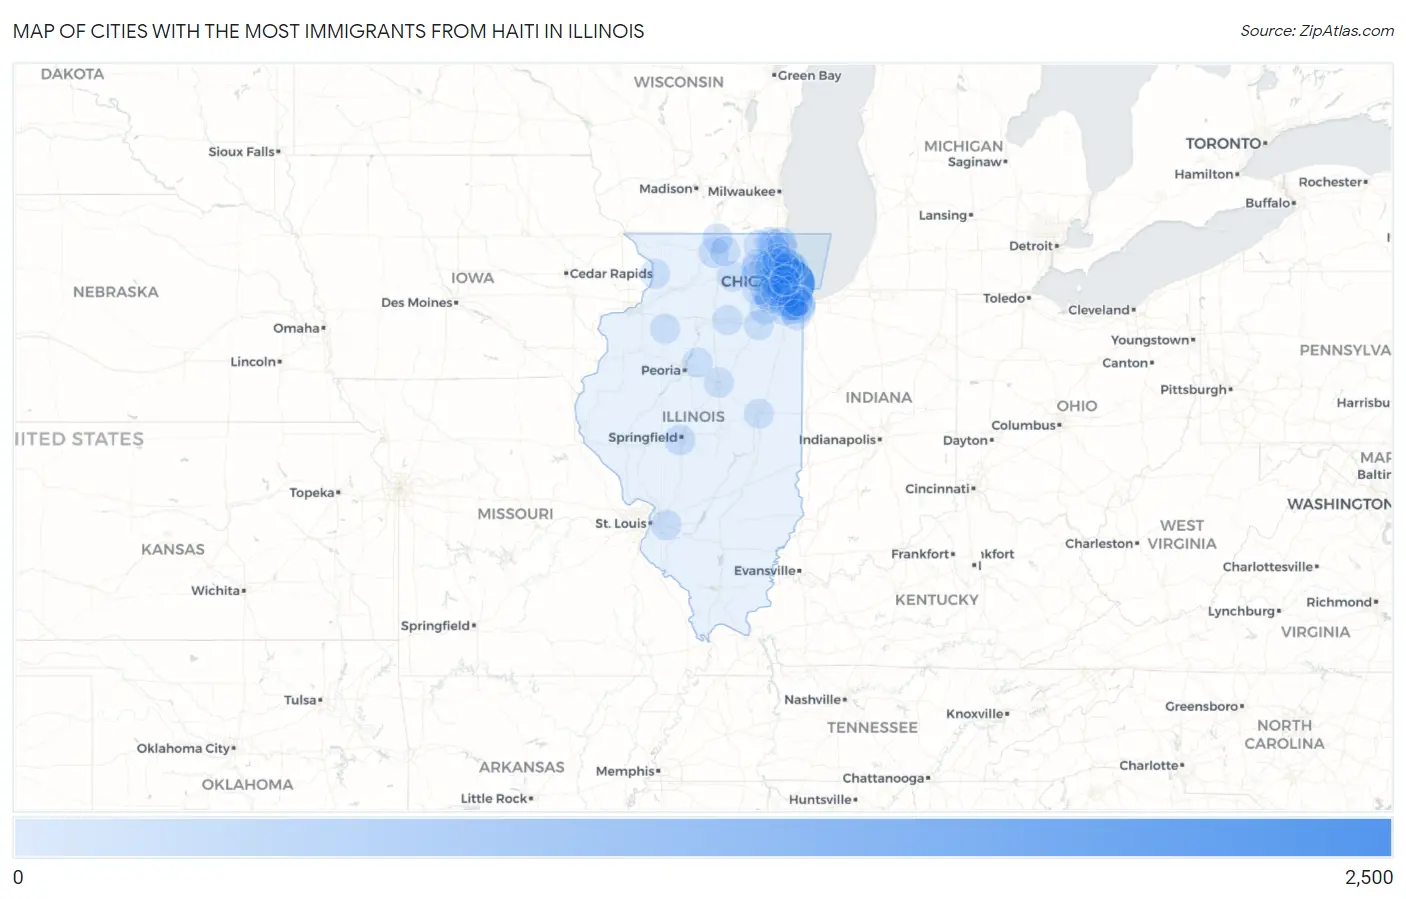
Map of Cities with the Most Immigrants from Haiti in Illinois
0
2,500
Cities with the Most Immigrants from Haiti in Illinois
| City | Haiti | vs State | vs National | |
| 1. | Chicago | 2,276 | 4,533(50.21%)#1 | 694,547(0.33%)#50 |
| 2. | Skokie | 172 | 4,533(3.79%)#2 | 694,547(0.02%)#355 |
| 3. | Evanston | 165 | 4,533(3.64%)#3 | 694,547(0.02%)#366 |
| 4. | Grayslake | 131 | 4,533(2.89%)#4 | 694,547(0.02%)#436 |
| 5. | Des Plaines | 108 | 4,533(2.38%)#5 | 694,547(0.02%)#506 |
| 6. | Joliet | 91 | 4,533(2.01%)#6 | 694,547(0.01%)#572 |
| 7. | Lynwood | 74 | 4,533(1.63%)#7 | 694,547(0.01%)#650 |
| 8. | Bolingbrook | 71 | 4,533(1.57%)#8 | 694,547(0.01%)#663 |
| 9. | Niles | 71 | 4,533(1.57%)#9 | 694,547(0.01%)#664 |
| 10. | Naperville | 70 | 4,533(1.54%)#10 | 694,547(0.01%)#668 |
| 11. | Frankfort | 62 | 4,533(1.37%)#11 | 694,547(0.01%)#716 |
| 12. | Springfield | 61 | 4,533(1.35%)#12 | 694,547(0.01%)#720 |
| 13. | Calumet City | 55 | 4,533(1.21%)#13 | 694,547(0.01%)#766 |
| 14. | Waukegan | 49 | 4,533(1.08%)#14 | 694,547(0.01%)#819 |
| 15. | Harvey | 49 | 4,533(1.08%)#15 | 694,547(0.01%)#823 |
| 16. | Dolton | 47 | 4,533(1.04%)#16 | 694,547(0.01%)#848 |
| 17. | Mundelein | 46 | 4,533(1.01%)#17 | 694,547(0.01%)#856 |
| 18. | Dekalb | 45 | 4,533(0.99%)#18 | 694,547(0.01%)#864 |
| 19. | Bensenville | 43 | 4,533(0.95%)#19 | 694,547(0.01%)#883 |
| 20. | Rockford | 42 | 4,533(0.93%)#20 | 694,547(0.01%)#888 |
| 21. | Lansing | 39 | 4,533(0.86%)#21 | 694,547(0.01%)#928 |
| 22. | Palatine | 35 | 4,533(0.77%)#22 | 694,547(0.01%)#978 |
| 23. | Roscoe | 35 | 4,533(0.77%)#23 | 694,547(0.01%)#982 |
| 24. | Olympia Fields | 35 | 4,533(0.77%)#24 | 694,547(0.01%)#987 |
| 25. | Country Club Hills | 34 | 4,533(0.75%)#25 | 694,547(0.00%)#994 |
| 26. | Oak Park | 32 | 4,533(0.71%)#26 | 694,547(0.00%)#1,011 |
| 27. | O Fallon | 32 | 4,533(0.71%)#27 | 694,547(0.00%)#1,015 |
| 28. | Hoffman Estates | 27 | 4,533(0.60%)#28 | 694,547(0.00%)#1,081 |
| 29. | Romeoville | 26 | 4,533(0.57%)#29 | 694,547(0.00%)#1,087 |
| 30. | Orland Park | 25 | 4,533(0.55%)#30 | 694,547(0.00%)#1,115 |
| 31. | Round Lake Beach | 25 | 4,533(0.55%)#31 | 694,547(0.00%)#1,118 |
| 32. | Homewood | 23 | 4,533(0.51%)#32 | 694,547(0.00%)#1,158 |
| 33. | St Charles | 22 | 4,533(0.49%)#33 | 694,547(0.00%)#1,175 |
| 34. | Mchenry | 15 | 4,533(0.33%)#34 | 694,547(0.00%)#1,344 |
| 35. | Coal City | 15 | 4,533(0.33%)#35 | 694,547(0.00%)#1,362 |
| 36. | Elgin | 13 | 4,533(0.29%)#36 | 694,547(0.00%)#1,402 |
| 37. | Oakbrook Terrace | 13 | 4,533(0.29%)#37 | 694,547(0.00%)#1,429 |
| 38. | Wheaton | 12 | 4,533(0.26%)#38 | 694,547(0.00%)#1,434 |
| 39. | Flossmoor | 12 | 4,533(0.26%)#39 | 694,547(0.00%)#1,447 |
| 40. | Crete | 12 | 4,533(0.26%)#40 | 694,547(0.00%)#1,449 |
| 41. | Ottawa | 11 | 4,533(0.24%)#41 | 694,547(0.00%)#1,482 |
| 42. | Bridgeview | 11 | 4,533(0.24%)#42 | 694,547(0.00%)#1,484 |
| 43. | Schaumburg | 10 | 4,533(0.22%)#43 | 694,547(0.00%)#1,507 |
| 44. | Morton Grove | 10 | 4,533(0.22%)#44 | 694,547(0.00%)#1,514 |
| 45. | Arlington Heights | 9 | 4,533(0.20%)#45 | 694,547(0.00%)#1,547 |
| 46. | Buffalo Grove | 9 | 4,533(0.20%)#46 | 694,547(0.00%)#1,554 |
| 47. | Wilmette | 9 | 4,533(0.20%)#47 | 694,547(0.00%)#1,557 |
| 48. | La Grange | 9 | 4,533(0.20%)#48 | 694,547(0.00%)#1,568 |
| 49. | Northbrook | 7 | 4,533(0.15%)#49 | 694,547(0.00%)#1,631 |
| 50. | Thomson | 7 | 4,533(0.15%)#50 | 694,547(0.00%)#1,662 |
| 51. | Aurora | 6 | 4,533(0.13%)#51 | 694,547(0.00%)#1,669 |
| 52. | Kewanee | 6 | 4,533(0.13%)#52 | 694,547(0.00%)#1,685 |
| 53. | Sleepy Hollow | 6 | 4,533(0.13%)#53 | 694,547(0.00%)#1,702 |
| 54. | Belvidere | 5 | 4,533(0.11%)#54 | 694,547(0.00%)#1,718 |
| 55. | Forest Park | 5 | 4,533(0.11%)#55 | 694,547(0.00%)#1,722 |
| 56. | South Holland | 4 | 4,533(0.09%)#56 | 694,547(0.00%)#1,754 |
| 57. | North Chicago | 3 | 4,533(0.07%)#57 | 694,547(0.00%)#1,789 |
| 58. | Champaign | 2 | 4,533(0.04%)#58 | 694,547(0.00%)#1,820 |
| 59. | Normal | 1 | 4,533(0.02%)#59 | 694,547(0.00%)#1,853 |
| 60. | Darien | 1 | 4,533(0.02%)#60 | 694,547(0.00%)#1,863 |
| 61. | River Forest | 1 | 4,533(0.02%)#61 | 694,547(0.00%)#1,868 |
| 62. | Metamora | 1 | 4,533(0.02%)#62 | 694,547(0.00%)#1,880 |
Common Questions
What are the Top 10 Cities with the Most Immigrants from Haiti in Illinois?
Top 10 Cities with the Most Immigrants from Haiti in Illinois are:
#1
2,276
#2
172
#3
165
#4
131
#5
108
#6
91
#7
74
#8
71
#9
71
#10
70
What city has the Most Immigrants from Haiti in Illinois?
Chicago has the Most Immigrants from Haiti in Illinois with 2,276.
What is the Total Immigrants from Haiti in the State of Illinois?
Total Immigrants from Haiti in Illinois is 4,533.
What is the Total Immigrants from Haiti in the United States?
Total Immigrants from Haiti in the United States is 694,547.