Cities with the Highest Percentage of Immigrants from South Eastern Asia in West Virginia
RELATED REPORTS & OPTIONS
South Eastern Asia
West Virginia
Compare Cities
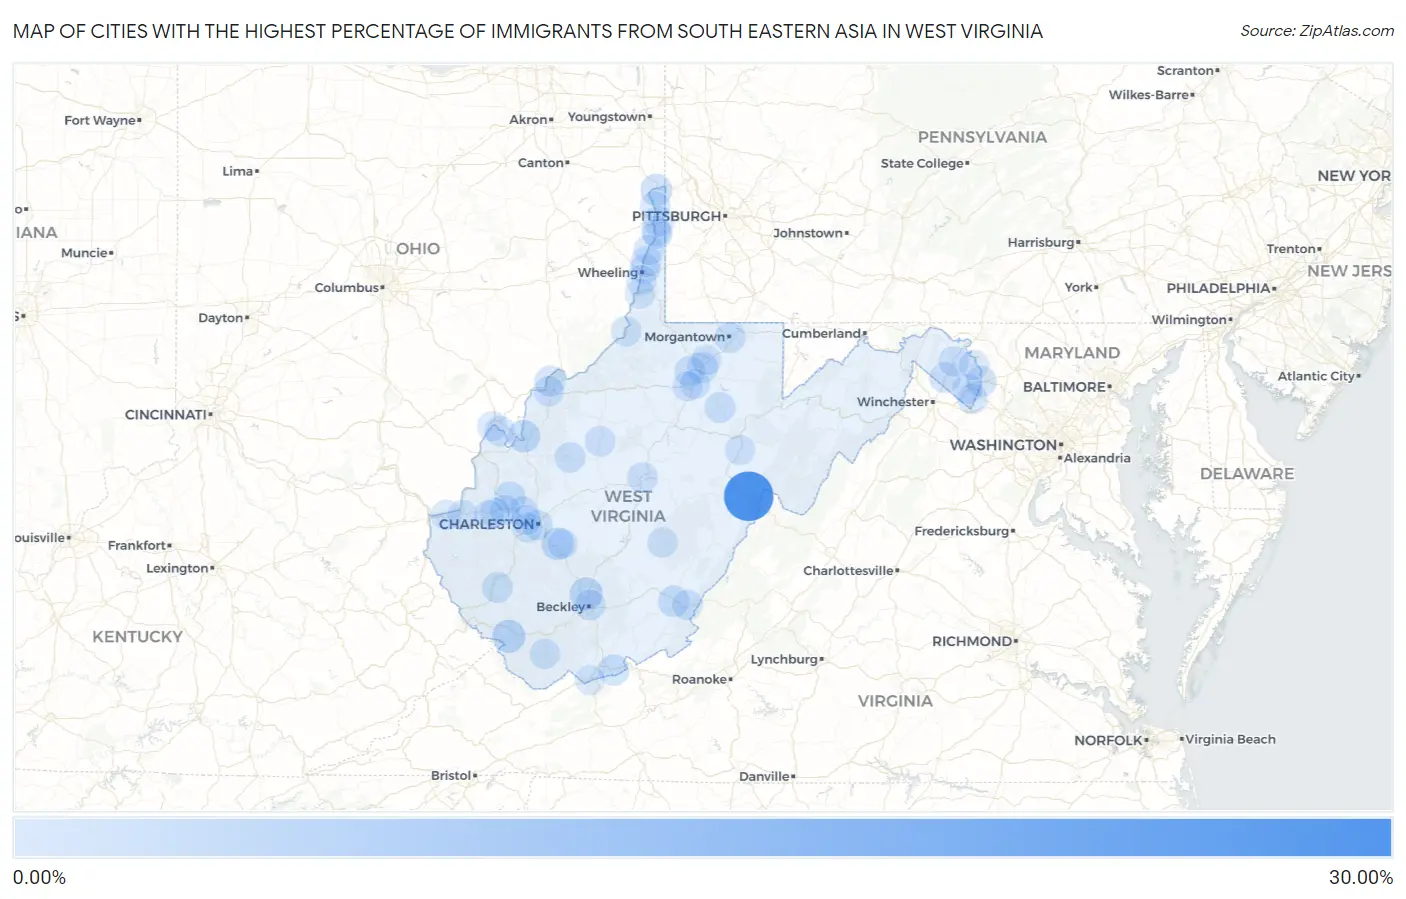
Map of Cities with the Highest Percentage of Immigrants from South Eastern Asia in West Virginia
0.00%
30.00%
Cities with the Highest Percentage of Immigrants from South Eastern Asia in West Virginia
| City | South Eastern Asia | vs State | vs National | |
| 1. | Bartow | 25.23% | 0.18%(+25.0)#-1 | 1.30%(+23.9)#0 |
| 2. | Gilbert Creek | 3.60% | 0.18%(+3.42)#0 | 1.30%(+2.31)#1 |
| 3. | Bradley | 3.37% | 0.18%(+3.19)#1 | 1.30%(+2.07)#2 |
| 4. | Ravenswood | 2.96% | 0.18%(+2.78)#2 | 1.30%(+1.66)#3 |
| 5. | Shrewsbury | 2.89% | 0.18%(+2.71)#3 | 1.30%(+1.59)#4 |
| 6. | Ranson Corporation | 2.62% | 0.18%(+2.44)#4 | 1.30%(+1.32)#5 |
| 7. | Newell | 2.21% | 0.18%(+2.03)#5 | 1.30%(+0.918)#6 |
| 8. | Winfield | 1.65% | 0.18%(+1.47)#6 | 1.30%(+0.351)#7 |
| 9. | Lewisburg | 1.62% | 0.18%(+1.44)#7 | 1.30%(+0.323)#8 |
| 10. | Oakvale | 1.40% | 0.18%(+1.22)#8 | 1.30%(+0.106)#9 |
| 11. | White Hall | 1.37% | 0.18%(+1.18)#9 | 1.30%(+0.070)#10 |
| 12. | Morgantown | 1.03% | 0.18%(+0.844)#10 | 1.30%(-0.271)#11 |
| 13. | Harpers Ferry | 1.00% | 0.18%(+0.815)#11 | 1.30%(-0.300)#12 |
| 14. | Inwood | 0.99% | 0.18%(+0.808)#12 | 1.30%(-0.307)#13 |
| 15. | Shinnston | 0.99% | 0.18%(+0.806)#13 | 1.30%(-0.308)#14 |
| 16. | Mitchell Heights | 0.97% | 0.18%(+0.785)#14 | 1.30%(-0.330)#15 |
| 17. | Beckley | 0.93% | 0.18%(+0.747)#15 | 1.30%(-0.368)#16 |
| 18. | Philippi | 0.89% | 0.18%(+0.709)#16 | 1.30%(-0.406)#17 |
| 19. | Vienna | 0.77% | 0.18%(+0.589)#17 | 1.30%(-0.526)#18 |
| 20. | Spencer | 0.73% | 0.18%(+0.548)#18 | 1.30%(-0.567)#19 |
| 21. | Sutton | 0.58% | 0.18%(+0.401)#19 | 1.30%(-0.714)#20 |
| 22. | Grantsville | 0.54% | 0.18%(+0.358)#20 | 1.30%(-0.757)#21 |
| 23. | Clearview | 0.51% | 0.18%(+0.325)#21 | 1.30%(-0.790)#22 |
| 24. | Martinsburg | 0.50% | 0.18%(+0.316)#22 | 1.30%(-0.798)#23 |
| 25. | Weirton | 0.48% | 0.18%(+0.303)#23 | 1.30%(-0.811)#24 |
| 26. | White Sulphur Springs | 0.44% | 0.18%(+0.262)#24 | 1.30%(-0.853)#25 |
| 27. | Parkersburg | 0.39% | 0.18%(+0.206)#25 | 1.30%(-0.909)#26 |
| 28. | Shannondale | 0.33% | 0.18%(+0.152)#26 | 1.30%(-0.962)#27 |
| 29. | Cross Lanes | 0.33% | 0.18%(+0.147)#27 | 1.30%(-0.968)#28 |
| 30. | Charleston | 0.30% | 0.18%(+0.116)#28 | 1.30%(-0.999)#29 |
| 31. | Charles Town | 0.29% | 0.18%(+0.107)#29 | 1.30%(-1.01)#30 |
| 32. | Welch | 0.29% | 0.18%(+0.106)#30 | 1.30%(-1.01)#31 |
| 33. | New Haven | 0.28% | 0.18%(+0.102)#31 | 1.30%(-1.01)#32 |
| 34. | Follansbee | 0.25% | 0.18%(+0.067)#32 | 1.30%(-1.05)#33 |
| 35. | Huntington | 0.22% | 0.18%(+0.039)#33 | 1.30%(-1.08)#34 |
| 36. | New Martinsville | 0.21% | 0.18%(+0.030)#34 | 1.30%(-1.09)#35 |
| 37. | Teays Valley | 0.20% | 0.18%(+0.014)#35 | 1.30%(-1.10)#36 |
| 38. | Wheeling | 0.17% | 0.18%(-0.007)#36 | 1.30%(-1.12)#37 |
| 39. | Bridgeport | 0.17% | 0.18%(-0.009)#37 | 1.30%(-1.12)#38 |
| 40. | South Charleston | 0.17% | 0.18%(-0.011)#38 | 1.30%(-1.13)#39 |
| 41. | Benwood | 0.16% | 0.18%(-0.022)#39 | 1.30%(-1.14)#40 |
| 42. | Beech Bottom | 0.16% | 0.18%(-0.022)#40 | 1.30%(-1.14)#41 |
| 43. | Dunbar | 0.15% | 0.18%(-0.033)#41 | 1.30%(-1.15)#42 |
| 44. | Beverly | 0.15% | 0.18%(-0.035)#42 | 1.30%(-1.15)#43 |
| 45. | Hurricane | 0.14% | 0.18%(-0.037)#43 | 1.30%(-1.15)#44 |
| 46. | Barboursville | 0.14% | 0.18%(-0.045)#44 | 1.30%(-1.16)#45 |
| 47. | Glasgow | 0.12% | 0.18%(-0.057)#45 | 1.30%(-1.17)#46 |
| 48. | Shepherdstown | 0.12% | 0.18%(-0.057)#46 | 1.30%(-1.17)#47 |
| 49. | Mason | 0.12% | 0.18%(-0.059)#47 | 1.30%(-1.17)#48 |
| 50. | Richwood | 0.12% | 0.18%(-0.065)#48 | 1.30%(-1.18)#49 |
| 51. | New Cumberland | 0.089% | 0.18%(-0.092)#49 | 1.30%(-1.21)#50 |
| 52. | Bluefield | 0.073% | 0.18%(-0.109)#50 | 1.30%(-1.22)#51 |
| 53. | Fairmont | 0.054% | 0.18%(-0.127)#51 | 1.30%(-1.24)#52 |
| 54. | Moundsville | 0.050% | 0.18%(-0.132)#52 | 1.30%(-1.25)#53 |
| 55. | Clarksburg | 0.044% | 0.18%(-0.138)#53 | 1.30%(-1.25)#54 |
| 56. | Hooverson Heights | 0.043% | 0.18%(-0.139)#54 | 1.30%(-1.25)#55 |
| 57. | Culloden | 0.034% | 0.18%(-0.147)#55 | 1.30%(-1.26)#56 |
1
2Common Questions
What are the Top 10 Cities with the Highest Percentage of Immigrants from South Eastern Asia in West Virginia?
Top 10 Cities with the Highest Percentage of Immigrants from South Eastern Asia in West Virginia are:
#1
25.23%
#2
3.60%
#3
3.37%
#4
2.96%
#5
2.89%
#6
2.21%
#7
1.65%
#8
1.62%
#9
1.40%
#10
1.37%
What city has the Highest Percentage of Immigrants from South Eastern Asia in West Virginia?
Bartow has the Highest Percentage of Immigrants from South Eastern Asia in West Virginia with 25.23%.
What is the Percentage of Immigrants from South Eastern Asia in the State of West Virginia?
Percentage of Immigrants from South Eastern Asia in West Virginia is 0.18%.
What is the Percentage of Immigrants from South Eastern Asia in the United States?
Percentage of Immigrants from South Eastern Asia in the United States is 1.30%.