Cities with the Most Immigrants from England in Illinois
RELATED REPORTS & OPTIONS
England
Illinois
Compare Cities
Map of Cities with the Most Immigrants from England in Illinois
0
2,500
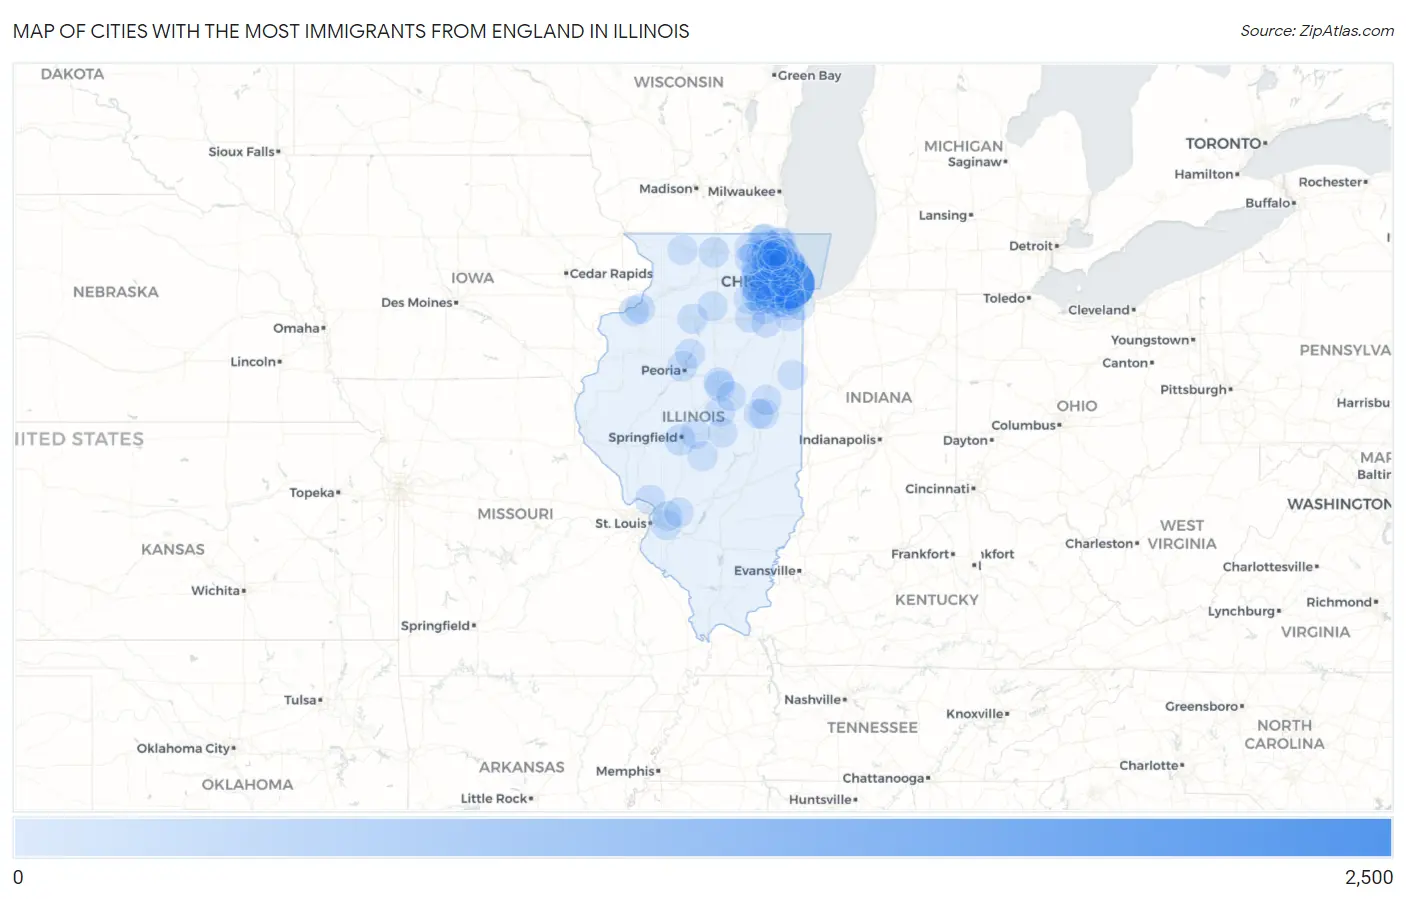
Cities with the Most Immigrants from England in Illinois
| City | England | vs State | vs National | |
| 1. | Chicago | 2,180 | 8,551(25.49%)#1 | 318,896(0.68%)#3 |
| 2. | Naperville | 396 | 8,551(4.63%)#2 | 318,896(0.12%)#72 |
| 3. | Skokie | 214 | 8,551(2.50%)#3 | 318,896(0.07%)#172 |
| 4. | Evanston | 170 | 8,551(1.99%)#4 | 318,896(0.05%)#244 |
| 5. | Wheaton | 129 | 8,551(1.51%)#5 | 318,896(0.04%)#342 |
| 6. | Springfield | 117 | 8,551(1.37%)#6 | 318,896(0.04%)#409 |
| 7. | Batavia | 101 | 8,551(1.18%)#7 | 318,896(0.03%)#496 |
| 8. | Bloomingdale | 81 | 8,551(0.95%)#8 | 318,896(0.03%)#635 |
| 9. | Streamwood | 77 | 8,551(0.90%)#9 | 318,896(0.02%)#675 |
| 10. | Lemont | 77 | 8,551(0.90%)#10 | 318,896(0.02%)#679 |
| 11. | Gurnee | 76 | 8,551(0.89%)#11 | 318,896(0.02%)#689 |
| 12. | Lombard | 75 | 8,551(0.88%)#12 | 318,896(0.02%)#699 |
| 13. | Glenview | 71 | 8,551(0.83%)#13 | 318,896(0.02%)#744 |
| 14. | Winnetka | 71 | 8,551(0.83%)#14 | 318,896(0.02%)#749 |
| 15. | Schaumburg | 70 | 8,551(0.82%)#15 | 318,896(0.02%)#752 |
| 16. | Elmhurst | 69 | 8,551(0.81%)#16 | 318,896(0.02%)#763 |
| 17. | Wilmette | 69 | 8,551(0.81%)#17 | 318,896(0.02%)#765 |
| 18. | Long Grove | 66 | 8,551(0.77%)#18 | 318,896(0.02%)#799 |
| 19. | Tinley Park | 60 | 8,551(0.70%)#19 | 318,896(0.02%)#878 |
| 20. | Rockford | 59 | 8,551(0.69%)#20 | 318,896(0.02%)#892 |
| 21. | Lake Barrington | 57 | 8,551(0.67%)#21 | 318,896(0.02%)#934 |
| 22. | Bolingbrook | 56 | 8,551(0.65%)#22 | 318,896(0.02%)#938 |
| 23. | Arlington Heights | 55 | 8,551(0.64%)#23 | 318,896(0.02%)#962 |
| 24. | Bloomington | 54 | 8,551(0.63%)#24 | 318,896(0.02%)#981 |
| 25. | Joliet | 51 | 8,551(0.60%)#25 | 318,896(0.02%)#1,035 |
| 26. | Palatine | 50 | 8,551(0.58%)#26 | 318,896(0.02%)#1,065 |
| 27. | Hanover Park | 50 | 8,551(0.58%)#27 | 318,896(0.02%)#1,069 |
| 28. | Elgin | 47 | 8,551(0.55%)#28 | 318,896(0.01%)#1,137 |
| 29. | Des Plaines | 46 | 8,551(0.54%)#29 | 318,896(0.01%)#1,164 |
| 30. | Oak Lawn | 46 | 8,551(0.54%)#30 | 318,896(0.01%)#1,165 |
| 31. | Urbana | 44 | 8,551(0.51%)#31 | 318,896(0.01%)#1,231 |
| 32. | Godfrey | 44 | 8,551(0.51%)#32 | 318,896(0.01%)#1,234 |
| 33. | Burr Ridge | 44 | 8,551(0.51%)#33 | 318,896(0.01%)#1,238 |
| 34. | Inverness | 44 | 8,551(0.51%)#34 | 318,896(0.01%)#1,241 |
| 35. | Downers Grove | 43 | 8,551(0.50%)#35 | 318,896(0.01%)#1,250 |
| 36. | Homer Glen | 43 | 8,551(0.50%)#36 | 318,896(0.01%)#1,255 |
| 37. | Waukegan | 39 | 8,551(0.46%)#37 | 318,896(0.01%)#1,349 |
| 38. | Crystal Lake | 38 | 8,551(0.44%)#38 | 318,896(0.01%)#1,386 |
| 39. | Yorkville | 38 | 8,551(0.44%)#39 | 318,896(0.01%)#1,391 |
| 40. | Rantoul | 37 | 8,551(0.43%)#40 | 318,896(0.01%)#1,421 |
| 41. | Palos Park | 37 | 8,551(0.43%)#41 | 318,896(0.01%)#1,430 |
| 42. | Aurora | 36 | 8,551(0.42%)#42 | 318,896(0.01%)#1,435 |
| 43. | Green Oaks | 36 | 8,551(0.42%)#43 | 318,896(0.01%)#1,460 |
| 44. | Peoria | 35 | 8,551(0.41%)#44 | 318,896(0.01%)#1,466 |
| 45. | Westmont | 34 | 8,551(0.40%)#45 | 318,896(0.01%)#1,520 |
| 46. | Round Lake | 34 | 8,551(0.40%)#46 | 318,896(0.01%)#1,526 |
| 47. | Monee | 34 | 8,551(0.40%)#47 | 318,896(0.01%)#1,541 |
| 48. | Oak Park | 33 | 8,551(0.39%)#48 | 318,896(0.01%)#1,549 |
| 49. | Normal | 33 | 8,551(0.39%)#49 | 318,896(0.01%)#1,551 |
| 50. | O Fallon | 33 | 8,551(0.39%)#50 | 318,896(0.01%)#1,556 |
| 51. | Berwyn | 32 | 8,551(0.37%)#51 | 318,896(0.01%)#1,590 |
| 52. | Plainfield | 32 | 8,551(0.37%)#52 | 318,896(0.01%)#1,595 |
| 53. | Lake Forest | 32 | 8,551(0.37%)#53 | 318,896(0.01%)#1,606 |
| 54. | Clinton | 32 | 8,551(0.37%)#54 | 318,896(0.01%)#1,614 |
| 55. | Orland Hills | 32 | 8,551(0.37%)#55 | 318,896(0.01%)#1,615 |
| 56. | South Elgin | 31 | 8,551(0.36%)#56 | 318,896(0.01%)#1,639 |
| 57. | Cary | 31 | 8,551(0.36%)#57 | 318,896(0.01%)#1,645 |
| 58. | Hinsdale | 29 | 8,551(0.34%)#58 | 318,896(0.01%)#1,724 |
| 59. | Elk Grove Village | 28 | 8,551(0.33%)#59 | 318,896(0.01%)#1,772 |
| 60. | Woodstock | 28 | 8,551(0.33%)#60 | 318,896(0.01%)#1,778 |
| 61. | Princeton | 28 | 8,551(0.33%)#61 | 318,896(0.01%)#1,794 |
| 62. | Buffalo Grove | 27 | 8,551(0.32%)#62 | 318,896(0.01%)#1,809 |
| 63. | Wheeling | 27 | 8,551(0.32%)#63 | 318,896(0.01%)#1,811 |
| 64. | St Charles | 27 | 8,551(0.32%)#64 | 318,896(0.01%)#1,818 |
| 65. | Glen Ellyn | 27 | 8,551(0.32%)#65 | 318,896(0.01%)#1,822 |
| 66. | Pistakee Highlands | 27 | 8,551(0.32%)#66 | 318,896(0.01%)#1,851 |
| 67. | Tower Lakes | 27 | 8,551(0.32%)#67 | 318,896(0.01%)#1,854 |
| 68. | Alsip | 26 | 8,551(0.30%)#68 | 318,896(0.01%)#1,873 |
| 69. | North Aurora | 26 | 8,551(0.30%)#69 | 318,896(0.01%)#1,874 |
| 70. | Morris | 25 | 8,551(0.29%)#70 | 318,896(0.01%)#1,930 |
| 71. | Romeoville | 23 | 8,551(0.27%)#71 | 318,896(0.01%)#2,034 |
| 72. | Lake Zurich | 23 | 8,551(0.27%)#72 | 318,896(0.01%)#2,048 |
| 73. | Warrenville | 23 | 8,551(0.27%)#73 | 318,896(0.01%)#2,055 |
| 74. | Fox Lake | 23 | 8,551(0.27%)#74 | 318,896(0.01%)#2,060 |
| 75. | Chillicothe | 23 | 8,551(0.27%)#75 | 318,896(0.01%)#2,072 |
| 76. | Wilmington | 23 | 8,551(0.27%)#76 | 318,896(0.01%)#2,074 |
| 77. | South Barrington | 23 | 8,551(0.27%)#77 | 318,896(0.01%)#2,078 |
| 78. | Buffalo | 23 | 8,551(0.27%)#78 | 318,896(0.01%)#2,089 |
| 79. | Moline | 22 | 8,551(0.26%)#79 | 318,896(0.01%)#2,102 |
| 80. | Midlothian | 22 | 8,551(0.26%)#80 | 318,896(0.01%)#2,121 |
| 81. | Kildeer | 22 | 8,551(0.26%)#81 | 318,896(0.01%)#2,149 |
| 82. | Huntley | 21 | 8,551(0.25%)#82 | 318,896(0.01%)#2,184 |
| 83. | Mendota | 21 | 8,551(0.25%)#83 | 318,896(0.01%)#2,217 |
| 84. | Troy | 20 | 8,551(0.23%)#84 | 318,896(0.01%)#2,283 |
| 85. | Le Roy | 20 | 8,551(0.23%)#85 | 318,896(0.01%)#2,306 |
| 86. | Northbrook | 19 | 8,551(0.22%)#86 | 318,896(0.01%)#2,327 |
| 87. | Oswego | 19 | 8,551(0.22%)#87 | 318,896(0.01%)#2,328 |
| 88. | East Moline | 19 | 8,551(0.22%)#88 | 318,896(0.01%)#2,340 |
| 89. | Forest Park | 19 | 8,551(0.22%)#89 | 318,896(0.01%)#2,351 |
| 90. | Champaign | 18 | 8,551(0.21%)#90 | 318,896(0.01%)#2,408 |
| 91. | Decatur | 18 | 8,551(0.21%)#91 | 318,896(0.01%)#2,409 |
| 92. | Mundelein | 18 | 8,551(0.21%)#92 | 318,896(0.01%)#2,422 |
| 93. | Lansing | 18 | 8,551(0.21%)#93 | 318,896(0.01%)#2,423 |
| 94. | Rolling Meadows | 18 | 8,551(0.21%)#94 | 318,896(0.01%)#2,430 |
| 95. | Taylorville | 18 | 8,551(0.21%)#95 | 318,896(0.01%)#2,454 |
| 96. | Highland | 18 | 8,551(0.21%)#96 | 318,896(0.01%)#2,463 |
| 97. | Milford | 18 | 8,551(0.21%)#97 | 318,896(0.01%)#2,511 |
| 98. | Vernon Hills | 17 | 8,551(0.20%)#98 | 318,896(0.01%)#2,541 |
| 99. | Freeport | 17 | 8,551(0.20%)#99 | 318,896(0.01%)#2,544 |
| 100. | Forest Lake | 17 | 8,551(0.20%)#100 | 318,896(0.01%)#2,603 |
Common Questions
What are the Top 10 Cities with the Most Immigrants from England in Illinois?
Top 10 Cities with the Most Immigrants from England in Illinois are:
#1
2,180
#2
396
#3
214
#4
170
#5
129
#6
117
#7
101
#8
81
#9
77
#10
77
What city has the Most Immigrants from England in Illinois?
Chicago has the Most Immigrants from England in Illinois with 2,180.
What is the Total Immigrants from England in the State of Illinois?
Total Immigrants from England in Illinois is 8,551.
What is the Total Immigrants from England in the United States?
Total Immigrants from England in the United States is 318,896.