Cities with the Most Immigrants from Korea in Illinois
RELATED REPORTS & OPTIONS
Korea
Illinois
Compare Cities
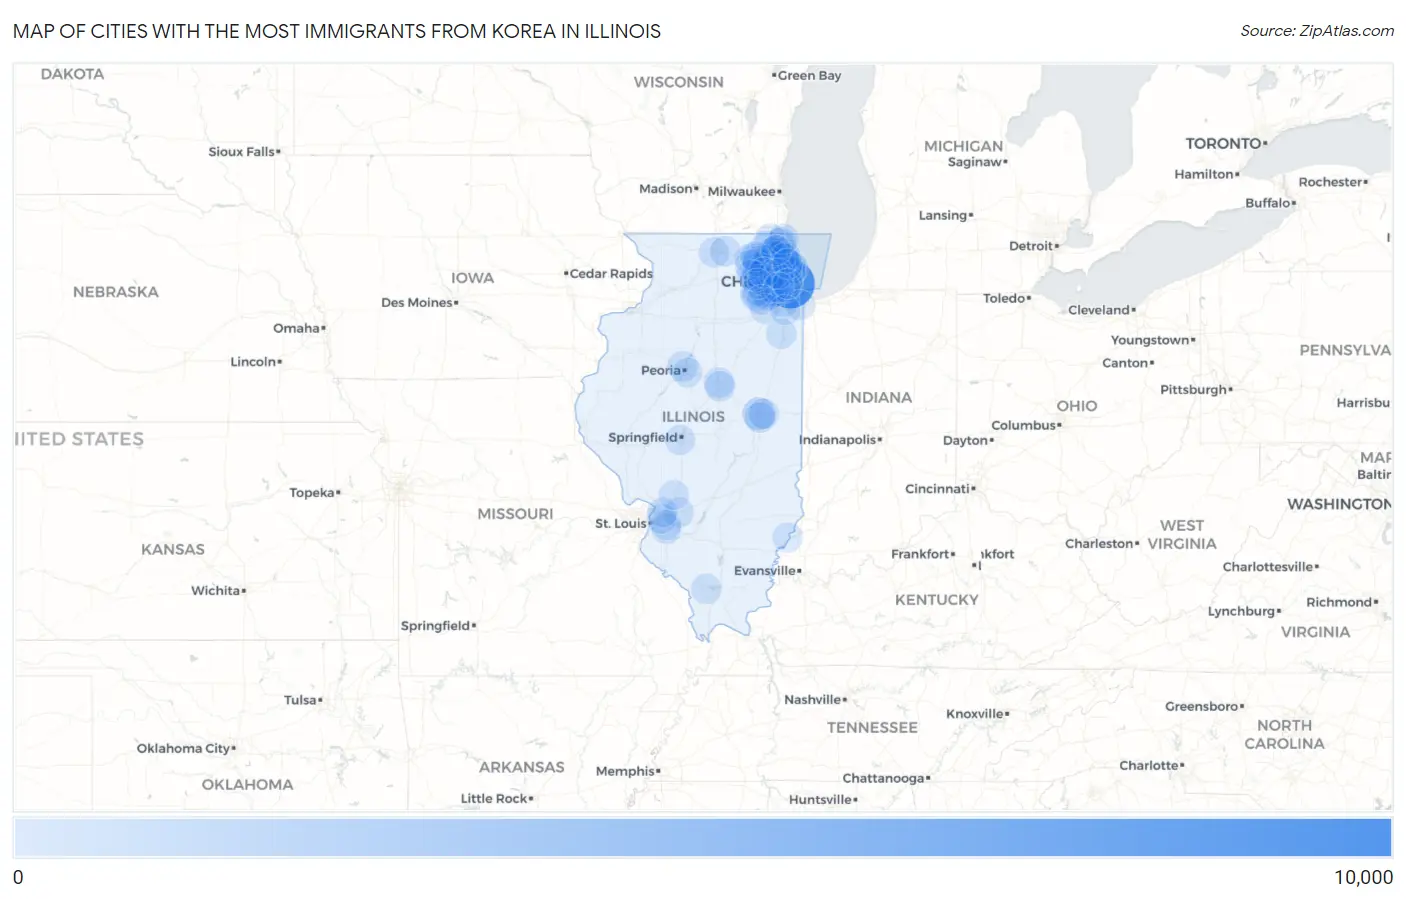
Map of Cities with the Most Immigrants from Korea in Illinois
0
10,000
Cities with the Most Immigrants from Korea in Illinois
| City | Korea | vs State | vs National | |
| 1. | Chicago | 8,850 | 40,393(21.91%)#1 | 1,034,299(0.86%)#8 |
| 2. | Glenview | 1,691 | 40,393(4.19%)#2 | 1,034,299(0.16%)#73 |
| 3. | Schaumburg | 1,323 | 40,393(3.28%)#3 | 1,034,299(0.13%)#103 |
| 4. | Buffalo Grove | 1,296 | 40,393(3.21%)#4 | 1,034,299(0.13%)#108 |
| 5. | Champaign | 1,115 | 40,393(2.76%)#5 | 1,034,299(0.11%)#124 |
| 6. | Naperville | 1,085 | 40,393(2.69%)#6 | 1,034,299(0.10%)#132 |
| 7. | Northbrook | 1,073 | 40,393(2.66%)#7 | 1,034,299(0.10%)#135 |
| 8. | Wheeling | 891 | 40,393(2.21%)#8 | 1,034,299(0.09%)#168 |
| 9. | Palatine | 873 | 40,393(2.16%)#9 | 1,034,299(0.08%)#174 |
| 10. | Arlington Heights | 797 | 40,393(1.97%)#10 | 1,034,299(0.08%)#192 |
| 11. | Hoffman Estates | 736 | 40,393(1.82%)#11 | 1,034,299(0.07%)#214 |
| 12. | Skokie | 724 | 40,393(1.79%)#12 | 1,034,299(0.07%)#215 |
| 13. | Mount Prospect | 686 | 40,393(1.70%)#13 | 1,034,299(0.07%)#233 |
| 14. | Niles | 624 | 40,393(1.54%)#14 | 1,034,299(0.06%)#251 |
| 15. | Evanston | 563 | 40,393(1.39%)#15 | 1,034,299(0.05%)#279 |
| 16. | Inverness | 542 | 40,393(1.34%)#16 | 1,034,299(0.05%)#289 |
| 17. | Vernon Hills | 517 | 40,393(1.28%)#17 | 1,034,299(0.05%)#317 |
| 18. | Morton Grove | 461 | 40,393(1.14%)#18 | 1,034,299(0.04%)#349 |
| 19. | Wilmette | 421 | 40,393(1.04%)#19 | 1,034,299(0.04%)#378 |
| 20. | Des Plaines | 419 | 40,393(1.04%)#20 | 1,034,299(0.04%)#379 |
| 21. | Streamwood | 386 | 40,393(0.96%)#21 | 1,034,299(0.04%)#403 |
| 22. | Orland Park | 368 | 40,393(0.91%)#22 | 1,034,299(0.04%)#418 |
| 23. | Savoy | 263 | 40,393(0.65%)#23 | 1,034,299(0.03%)#568 |
| 24. | Algonquin | 240 | 40,393(0.59%)#24 | 1,034,299(0.02%)#623 |
| 25. | Peoria | 234 | 40,393(0.58%)#25 | 1,034,299(0.02%)#644 |
| 26. | Elk Grove Village | 231 | 40,393(0.57%)#26 | 1,034,299(0.02%)#652 |
| 27. | Oak Park | 226 | 40,393(0.56%)#27 | 1,034,299(0.02%)#666 |
| 28. | Huntley | 218 | 40,393(0.54%)#28 | 1,034,299(0.02%)#689 |
| 29. | Lombard | 202 | 40,393(0.50%)#29 | 1,034,299(0.02%)#735 |
| 30. | Urbana | 201 | 40,393(0.50%)#30 | 1,034,299(0.02%)#743 |
| 31. | Gurnee | 201 | 40,393(0.50%)#31 | 1,034,299(0.02%)#744 |
| 32. | Lake Zurich | 201 | 40,393(0.50%)#32 | 1,034,299(0.02%)#745 |
| 33. | Rolling Meadows | 188 | 40,393(0.47%)#33 | 1,034,299(0.02%)#788 |
| 34. | Wheaton | 180 | 40,393(0.45%)#34 | 1,034,299(0.02%)#812 |
| 35. | Volo | 179 | 40,393(0.44%)#35 | 1,034,299(0.02%)#816 |
| 36. | Hanover Park | 175 | 40,393(0.43%)#36 | 1,034,299(0.02%)#829 |
| 37. | Elgin | 174 | 40,393(0.43%)#37 | 1,034,299(0.02%)#832 |
| 38. | Bolingbrook | 174 | 40,393(0.43%)#38 | 1,034,299(0.02%)#834 |
| 39. | Lincolnshire | 172 | 40,393(0.43%)#39 | 1,034,299(0.02%)#839 |
| 40. | Lincolnwood | 170 | 40,393(0.42%)#40 | 1,034,299(0.02%)#848 |
| 41. | South Barrington | 168 | 40,393(0.42%)#41 | 1,034,299(0.02%)#863 |
| 42. | Normal | 166 | 40,393(0.41%)#42 | 1,034,299(0.02%)#867 |
| 43. | Prospect Heights | 161 | 40,393(0.40%)#43 | 1,034,299(0.02%)#885 |
| 44. | South Elgin | 158 | 40,393(0.39%)#44 | 1,034,299(0.02%)#895 |
| 45. | Aurora | 155 | 40,393(0.38%)#45 | 1,034,299(0.01%)#905 |
| 46. | Woodridge | 150 | 40,393(0.37%)#46 | 1,034,299(0.01%)#940 |
| 47. | Mundelein | 144 | 40,393(0.36%)#47 | 1,034,299(0.01%)#968 |
| 48. | Rockford | 143 | 40,393(0.35%)#48 | 1,034,299(0.01%)#971 |
| 49. | Addison | 138 | 40,393(0.34%)#49 | 1,034,299(0.01%)#1,001 |
| 50. | Bloomington | 137 | 40,393(0.34%)#50 | 1,034,299(0.01%)#1,006 |
| 51. | Geneva | 136 | 40,393(0.34%)#51 | 1,034,299(0.01%)#1,015 |
| 52. | Glendale Heights | 131 | 40,393(0.32%)#52 | 1,034,299(0.01%)#1,038 |
| 53. | Downers Grove | 127 | 40,393(0.31%)#53 | 1,034,299(0.01%)#1,051 |
| 54. | Springfield | 125 | 40,393(0.31%)#54 | 1,034,299(0.01%)#1,065 |
| 55. | Highland | 122 | 40,393(0.30%)#55 | 1,034,299(0.01%)#1,094 |
| 56. | Lake Forest | 119 | 40,393(0.29%)#56 | 1,034,299(0.01%)#1,117 |
| 57. | Barrington | 119 | 40,393(0.29%)#57 | 1,034,299(0.01%)#1,121 |
| 58. | Long Grove | 118 | 40,393(0.29%)#58 | 1,034,299(0.01%)#1,127 |
| 59. | Waukegan | 116 | 40,393(0.29%)#59 | 1,034,299(0.01%)#1,135 |
| 60. | Oswego | 111 | 40,393(0.27%)#60 | 1,034,299(0.01%)#1,176 |
| 61. | Deerfield | 106 | 40,393(0.26%)#61 | 1,034,299(0.01%)#1,222 |
| 62. | Elmhurst | 102 | 40,393(0.25%)#62 | 1,034,299(0.01%)#1,240 |
| 63. | Bloomingdale | 101 | 40,393(0.25%)#63 | 1,034,299(0.01%)#1,253 |
| 64. | Belvidere | 99 | 40,393(0.25%)#64 | 1,034,299(0.01%)#1,265 |
| 65. | Hawthorn Woods | 97 | 40,393(0.24%)#65 | 1,034,299(0.01%)#1,288 |
| 66. | Carbondale | 95 | 40,393(0.24%)#66 | 1,034,299(0.01%)#1,303 |
| 67. | Shiloh | 95 | 40,393(0.24%)#67 | 1,034,299(0.01%)#1,304 |
| 68. | West Dundee | 94 | 40,393(0.23%)#68 | 1,034,299(0.01%)#1,313 |
| 69. | Lisle | 93 | 40,393(0.23%)#69 | 1,034,299(0.01%)#1,317 |
| 70. | Pingree Grove | 93 | 40,393(0.23%)#70 | 1,034,299(0.01%)#1,321 |
| 71. | Montgomery | 90 | 40,393(0.22%)#71 | 1,034,299(0.01%)#1,345 |
| 72. | Bourbonnais | 85 | 40,393(0.21%)#72 | 1,034,299(0.01%)#1,396 |
| 73. | St Charles | 84 | 40,393(0.21%)#73 | 1,034,299(0.01%)#1,406 |
| 74. | West Chicago | 84 | 40,393(0.21%)#74 | 1,034,299(0.01%)#1,407 |
| 75. | Summit | 80 | 40,393(0.20%)#75 | 1,034,299(0.01%)#1,457 |
| 76. | Carpentersville | 74 | 40,393(0.18%)#76 | 1,034,299(0.01%)#1,529 |
| 77. | O Fallon | 73 | 40,393(0.18%)#77 | 1,034,299(0.01%)#1,541 |
| 78. | Darien | 73 | 40,393(0.18%)#78 | 1,034,299(0.01%)#1,544 |
| 79. | Itasca | 73 | 40,393(0.18%)#79 | 1,034,299(0.01%)#1,549 |
| 80. | Highland Park | 72 | 40,393(0.18%)#80 | 1,034,299(0.01%)#1,555 |
| 81. | Lake Villa | 71 | 40,393(0.18%)#81 | 1,034,299(0.01%)#1,572 |
| 82. | Campton Hills | 69 | 40,393(0.17%)#82 | 1,034,299(0.01%)#1,607 |
| 83. | Mount Carmel | 69 | 40,393(0.17%)#83 | 1,034,299(0.01%)#1,611 |
| 84. | Joliet | 65 | 40,393(0.16%)#84 | 1,034,299(0.01%)#1,654 |
| 85. | Lake In The Hills | 63 | 40,393(0.16%)#85 | 1,034,299(0.01%)#1,684 |
| 86. | Beach Park | 63 | 40,393(0.16%)#86 | 1,034,299(0.01%)#1,685 |
| 87. | Collinsville | 62 | 40,393(0.15%)#87 | 1,034,299(0.01%)#1,697 |
| 88. | Bensenville | 62 | 40,393(0.15%)#88 | 1,034,299(0.01%)#1,701 |
| 89. | Lansing | 61 | 40,393(0.15%)#89 | 1,034,299(0.01%)#1,717 |
| 90. | Libertyville | 61 | 40,393(0.15%)#90 | 1,034,299(0.01%)#1,720 |
| 91. | Batavia | 59 | 40,393(0.15%)#91 | 1,034,299(0.01%)#1,744 |
| 92. | Glen Carbon | 58 | 40,393(0.14%)#92 | 1,034,299(0.01%)#1,772 |
| 93. | Frankfort | 56 | 40,393(0.14%)#93 | 1,034,299(0.01%)#1,802 |
| 94. | Bartlett | 54 | 40,393(0.13%)#94 | 1,034,299(0.01%)#1,839 |
| 95. | Northfield | 54 | 40,393(0.13%)#95 | 1,034,299(0.01%)#1,850 |
| 96. | Staunton | 53 | 40,393(0.13%)#96 | 1,034,299(0.01%)#1,874 |
| 97. | Hinsdale | 52 | 40,393(0.13%)#97 | 1,034,299(0.01%)#1,883 |
| 98. | Plainfield | 51 | 40,393(0.13%)#98 | 1,034,299(0.00%)#1,894 |
| 99. | East Peoria | 51 | 40,393(0.13%)#99 | 1,034,299(0.00%)#1,901 |
| 100. | Berwyn | 50 | 40,393(0.12%)#100 | 1,034,299(0.00%)#1,920 |
Common Questions
What are the Top 10 Cities with the Most Immigrants from Korea in Illinois?
Top 10 Cities with the Most Immigrants from Korea in Illinois are:
#1
8,850
#2
1,691
#3
1,323
#4
1,296
#5
1,115
#6
1,085
#7
1,073
#8
891
#9
873
#10
797
What city has the Most Immigrants from Korea in Illinois?
Chicago has the Most Immigrants from Korea in Illinois with 8,850.
What is the Total Immigrants from Korea in the State of Illinois?
Total Immigrants from Korea in Illinois is 40,393.
What is the Total Immigrants from Korea in the United States?
Total Immigrants from Korea in the United States is 1,034,299.