Cities with the Highest Percentage of Population with a Degree in Science and Engineering in Illinois
RELATED REPORTS & OPTIONS
Science and Engineering
Illinois
Compare Cities
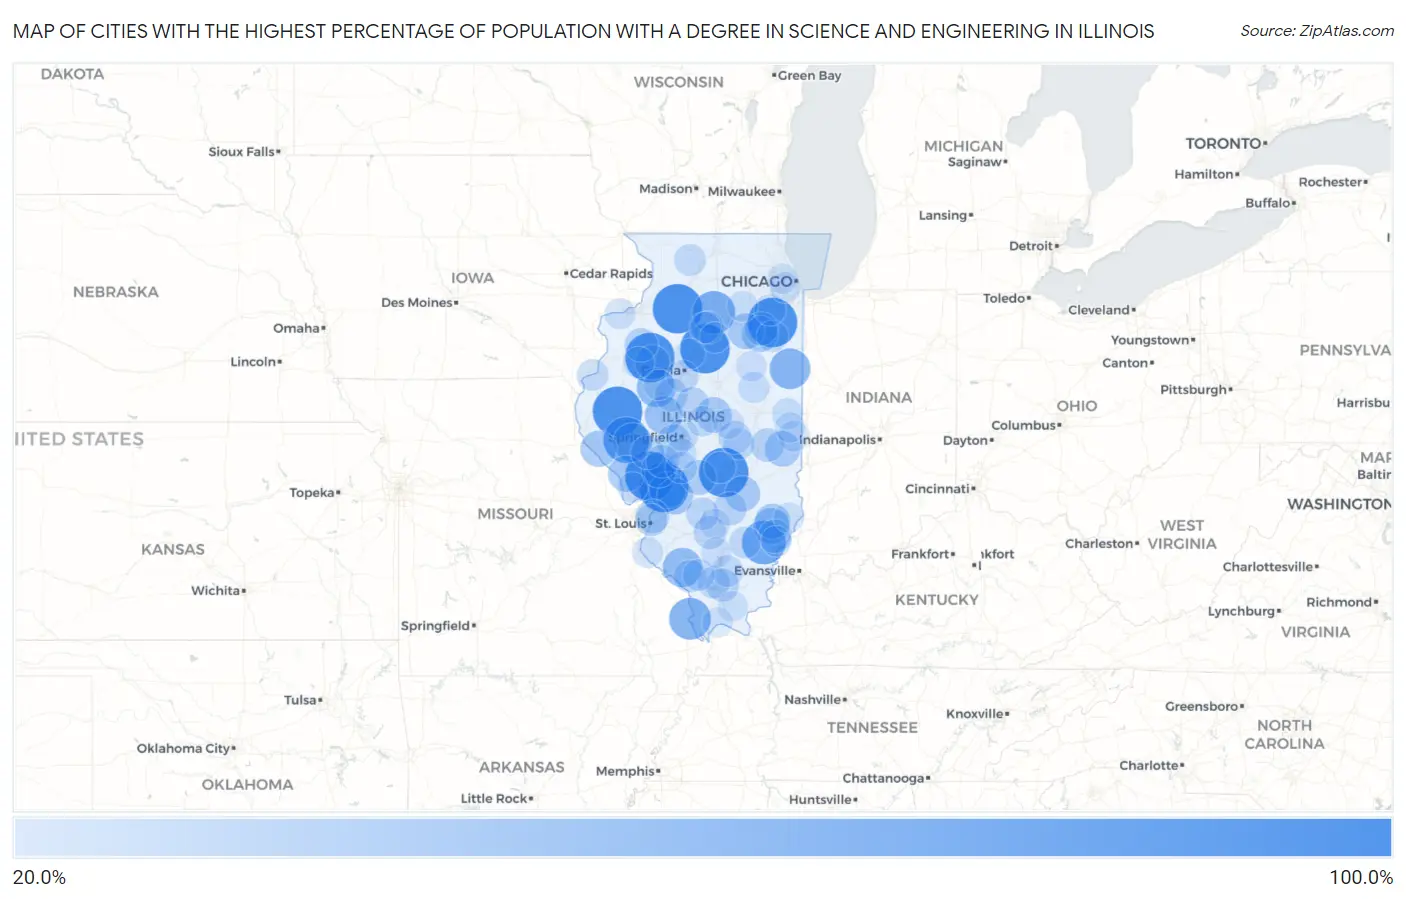
Map of Cities with the Highest Percentage of Population with a Degree in Science and Engineering in Illinois
0.0%
100.0%
Cities with the Highest Percentage of Population with a Degree in Science and Engineering in Illinois
| City | % Graduates | vs State | vs National | |
| 1. | Dundas | 100.0% | 9.8%(+90.2)#1 | 9.8%(+90.2)#55 |
| 2. | Royal Lakes | 100.0% | 9.8%(+90.2)#2 | 9.8%(+90.2)#60 |
| 3. | Smithville | 100.0% | 9.8%(+90.2)#3 | 9.8%(+90.2)#80 |
| 4. | Lawrence | 100.0% | 9.8%(+90.2)#4 | 9.8%(+90.2)#85 |
| 5. | Rockbridge | 100.0% | 9.8%(+90.2)#5 | 9.8%(+90.2)#112 |
| 6. | Gilson | 100.0% | 9.8%(+90.2)#6 | 9.8%(+90.2)#119 |
| 7. | Eagle Lake | 100.0% | 9.8%(+90.2)#7 | 9.8%(+90.2)#124 |
| 8. | La Rose | 100.0% | 9.8%(+90.2)#8 | 9.8%(+90.2)#130 |
| 9. | Rockport | 100.0% | 9.8%(+90.2)#9 | 9.8%(+90.2)#143 |
| 10. | Camden | 100.0% | 9.8%(+90.2)#10 | 9.8%(+90.2)#144 |
| 11. | Symerton | 100.0% | 9.8%(+90.2)#11 | 9.8%(+90.2)#155 |
| 12. | New Bedford | 100.0% | 9.8%(+90.2)#12 | 9.8%(+90.2)#173 |
| 13. | Marcelline | 100.0% | 9.8%(+90.2)#13 | 9.8%(+90.2)#189 |
| 14. | Lakewood | 100.0% | 9.8%(+90.2)#14 | 9.8%(+90.2)#201 |
| 15. | Naples | 85.7% | 9.8%(+75.9)#15 | 9.8%(+75.9)#228 |
| 16. | Golden Gate | 77.8% | 9.8%(+67.9)#16 | 9.8%(+68.0)#257 |
| 17. | Troy Grove | 75.0% | 9.8%(+65.2)#17 | 9.8%(+65.2)#268 |
| 18. | East Cape Girardeau | 70.6% | 9.8%(+60.7)#18 | 9.8%(+60.8)#299 |
| 19. | Woodland | 66.7% | 9.8%(+56.8)#19 | 9.8%(+56.9)#324 |
| 20. | Blairsville | 61.9% | 9.8%(+52.1)#20 | 9.8%(+52.1)#381 |
| 21. | Percy | 60.7% | 9.8%(+50.9)#21 | 9.8%(+50.9)#393 |
| 22. | Lockport Heights | 60.0% | 9.8%(+50.2)#22 | 9.8%(+50.2)#401 |
| 23. | Bryant | 60.0% | 9.8%(+50.2)#23 | 9.8%(+50.2)#407 |
| 24. | Exeter | 60.0% | 9.8%(+50.2)#24 | 9.8%(+50.2)#412 |
| 25. | Trilla | 56.2% | 9.8%(+46.4)#25 | 9.8%(+46.5)#457 |
| 26. | Oakford | 55.6% | 9.8%(+45.7)#26 | 9.8%(+45.8)#469 |
| 27. | Prairietown | 55.3% | 9.8%(+45.4)#27 | 9.8%(+45.5)#480 |
| 28. | Kampsville | 50.0% | 9.8%(+40.2)#28 | 9.8%(+40.2)#566 |
| 29. | Parkersburg | 50.0% | 9.8%(+40.2)#29 | 9.8%(+40.2)#568 |
| 30. | New Canton | 50.0% | 9.8%(+40.2)#30 | 9.8%(+40.2)#570 |
| 31. | Dorchester | 50.0% | 9.8%(+40.2)#31 | 9.8%(+40.2)#586 |
| 32. | Williamson | 50.0% | 9.8%(+40.2)#32 | 9.8%(+40.2)#588 |
| 33. | East Brooklyn | 50.0% | 9.8%(+40.2)#33 | 9.8%(+40.2)#620 |
| 34. | Verona | 48.3% | 9.8%(+38.4)#34 | 9.8%(+38.5)#660 |
| 35. | Kenney | 48.0% | 9.8%(+38.2)#35 | 9.8%(+38.2)#673 |
| 36. | Redmon | 47.4% | 9.8%(+37.5)#36 | 9.8%(+37.6)#691 |
| 37. | Watson | 46.8% | 9.8%(+36.9)#37 | 9.8%(+37.0)#707 |
| 38. | Hettick | 46.7% | 9.8%(+36.8)#38 | 9.8%(+36.9)#711 |
| 39. | Calhoun | 45.5% | 9.8%(+35.6)#39 | 9.8%(+35.7)#733 |
| 40. | Witt | 45.0% | 9.8%(+35.2)#40 | 9.8%(+35.2)#744 |
| 41. | Maquon | 44.4% | 9.8%(+34.6)#41 | 9.8%(+34.7)#764 |
| 42. | Madison | 41.6% | 9.8%(+31.7)#42 | 9.8%(+31.8)#893 |
| 43. | Curran | 41.2% | 9.8%(+31.3)#43 | 9.8%(+31.4)#907 |
| 44. | Hindsboro | 40.0% | 9.8%(+30.2)#44 | 9.8%(+30.2)#948 |
| 45. | Henderson | 40.0% | 9.8%(+30.2)#45 | 9.8%(+30.2)#955 |
| 46. | Bone Gap | 40.0% | 9.8%(+30.2)#46 | 9.8%(+30.2)#961 |
| 47. | Farina | 39.1% | 9.8%(+29.3)#47 | 9.8%(+29.3)#998 |
| 48. | Forest City | 39.1% | 9.8%(+29.3)#48 | 9.8%(+29.3)#1,004 |
| 49. | Murrayville | 39.0% | 9.8%(+29.2)#49 | 9.8%(+29.2)#1,007 |
| 50. | Godley | 39.0% | 9.8%(+29.2)#50 | 9.8%(+29.2)#1,009 |
| 51. | Hartsburg | 38.2% | 9.8%(+28.4)#51 | 9.8%(+28.5)#1,062 |
| 52. | Spillertown | 38.2% | 9.8%(+28.3)#52 | 9.8%(+28.4)#1,063 |
| 53. | Ridgefield | 38.0% | 9.8%(+28.2)#53 | 9.8%(+28.2)#1,069 |
| 54. | Modesto | 37.9% | 9.8%(+28.1)#54 | 9.8%(+28.1)#1,074 |
| 55. | Wamac | 37.5% | 9.8%(+27.7)#55 | 9.8%(+27.7)#1,083 |
| 56. | Laplace | 37.5% | 9.8%(+27.7)#56 | 9.8%(+27.7)#1,104 |
| 57. | Keyesport | 36.4% | 9.8%(+26.5)#57 | 9.8%(+26.6)#1,146 |
| 58. | Ava | 36.4% | 9.8%(+26.5)#58 | 9.8%(+26.6)#1,147 |
| 59. | Standard | 36.1% | 9.8%(+26.3)#59 | 9.8%(+26.3)#1,166 |
| 60. | Literberry | 36.0% | 9.8%(+26.2)#60 | 9.8%(+26.2)#1,174 |
| 61. | Venice | 35.6% | 9.8%(+25.8)#61 | 9.8%(+25.8)#1,198 |
| 62. | North Pekin | 35.0% | 9.8%(+25.2)#62 | 9.8%(+25.2)#1,236 |
| 63. | Colp | 34.8% | 9.8%(+24.9)#63 | 9.8%(+25.0)#1,255 |
| 64. | Grandview | 33.6% | 9.8%(+23.8)#64 | 9.8%(+23.8)#1,305 |
| 65. | Hanaford | 33.3% | 9.8%(+23.5)#65 | 9.8%(+23.6)#1,331 |
| 66. | Vergennes | 33.3% | 9.8%(+23.5)#66 | 9.8%(+23.6)#1,338 |
| 67. | Sims | 33.3% | 9.8%(+23.5)#67 | 9.8%(+23.6)#1,356 |
| 68. | Waggoner | 33.3% | 9.8%(+23.5)#68 | 9.8%(+23.6)#1,362 |
| 69. | Pontoosuc | 33.3% | 9.8%(+23.5)#69 | 9.8%(+23.6)#1,388 |
| 70. | Adeline | 33.3% | 9.8%(+23.5)#70 | 9.8%(+23.6)#1,395 |
| 71. | Lovington | 32.9% | 9.8%(+23.0)#71 | 9.8%(+23.1)#1,428 |
| 72. | Bonfield | 32.3% | 9.8%(+22.4)#72 | 9.8%(+22.5)#1,461 |
| 73. | Preston Heights | 32.2% | 9.8%(+22.4)#73 | 9.8%(+22.4)#1,465 |
| 74. | Tower Hill | 32.1% | 9.8%(+22.3)#74 | 9.8%(+22.4)#1,472 |
| 75. | Abingdon | 32.1% | 9.8%(+22.2)#75 | 9.8%(+22.3)#1,476 |
| 76. | Granville | 31.8% | 9.8%(+21.9)#76 | 9.8%(+22.0)#1,496 |
| 77. | Baileyville | 31.4% | 9.8%(+21.6)#77 | 9.8%(+21.6)#1,532 |
| 78. | Oakwood | 31.2% | 9.8%(+21.3)#78 | 9.8%(+21.4)#1,555 |
| 79. | Gibson City | 31.0% | 9.8%(+21.2)#79 | 9.8%(+21.3)#1,565 |
| 80. | Maeystown | 30.8% | 9.8%(+20.9)#80 | 9.8%(+21.0)#1,608 |
| 81. | Chrisman | 30.6% | 9.8%(+20.7)#81 | 9.8%(+20.8)#1,616 |
| 82. | Andalusia | 30.4% | 9.8%(+20.5)#82 | 9.8%(+20.6)#1,633 |
| 83. | Newark | 30.1% | 9.8%(+20.3)#83 | 9.8%(+20.3)#1,655 |
| 84. | Mount Pulaski | 29.9% | 9.8%(+20.0)#84 | 9.8%(+20.1)#1,698 |
| 85. | Divernon | 29.4% | 9.8%(+19.5)#85 | 9.8%(+19.6)#1,761 |
| 86. | Argenta | 29.3% | 9.8%(+19.5)#86 | 9.8%(+19.5)#1,764 |
| 87. | Lostant | 29.3% | 9.8%(+19.4)#87 | 9.8%(+19.5)#1,769 |
| 88. | Summit | 29.2% | 9.8%(+19.4)#88 | 9.8%(+19.5)#1,773 |
| 89. | Browns | 29.2% | 9.8%(+19.3)#89 | 9.8%(+19.4)#1,788 |
| 90. | Forrest | 29.1% | 9.8%(+19.2)#90 | 9.8%(+19.3)#1,798 |
| 91. | Odin | 28.6% | 9.8%(+18.7)#91 | 9.8%(+18.8)#1,852 |
| 92. | St David | 28.6% | 9.8%(+18.7)#92 | 9.8%(+18.8)#1,857 |
| 93. | Waltonville | 28.6% | 9.8%(+18.7)#93 | 9.8%(+18.8)#1,864 |
| 94. | Indianola | 28.6% | 9.8%(+18.7)#94 | 9.8%(+18.8)#1,875 |
| 95. | Fieldon | 28.6% | 9.8%(+18.7)#95 | 9.8%(+18.8)#1,879 |
| 96. | Simpson | 28.6% | 9.8%(+18.7)#96 | 9.8%(+18.8)#1,897 |
| 97. | Chillicothe | 28.3% | 9.8%(+18.4)#97 | 9.8%(+18.5)#1,928 |
| 98. | Stone Park | 27.8% | 9.8%(+18.0)#98 | 9.8%(+18.1)#1,971 |
| 99. | Bridgeport | 27.8% | 9.8%(+17.9)#99 | 9.8%(+18.0)#1,978 |
| 100. | New Grand Chain | 27.8% | 9.8%(+17.9)#100 | 9.8%(+18.0)#1,988 |
Common Questions
What are the Top 10 Cities with the Highest Percentage of Population with a Degree in Science and Engineering in Illinois?
Top 10 Cities with the Highest Percentage of Population with a Degree in Science and Engineering in Illinois are:
#1
100.0%
#2
100.0%
#3
100.0%
#4
100.0%
#5
100.0%
#6
100.0%
#7
100.0%
#8
100.0%
#9
85.7%
#10
77.8%
What city has the Highest Percentage of Population with a Degree in Science and Engineering in Illinois?
Royal Lakes has the Highest Percentage of Population with a Degree in Science and Engineering in Illinois with 100.0%.
What is the Percentage of Population with a Degree in Science and Engineering in the State of Illinois?
Percentage of Population with a Degree in Science and Engineering in Illinois is 9.8%.
What is the Percentage of Population with a Degree in Science and Engineering in the United States?
Percentage of Population with a Degree in Science and Engineering in the United States is 9.8%.