Cities with the Highest Percentage of Immigrants from Uganda in Illinois
RELATED REPORTS & OPTIONS
Uganda
Illinois
Compare Cities
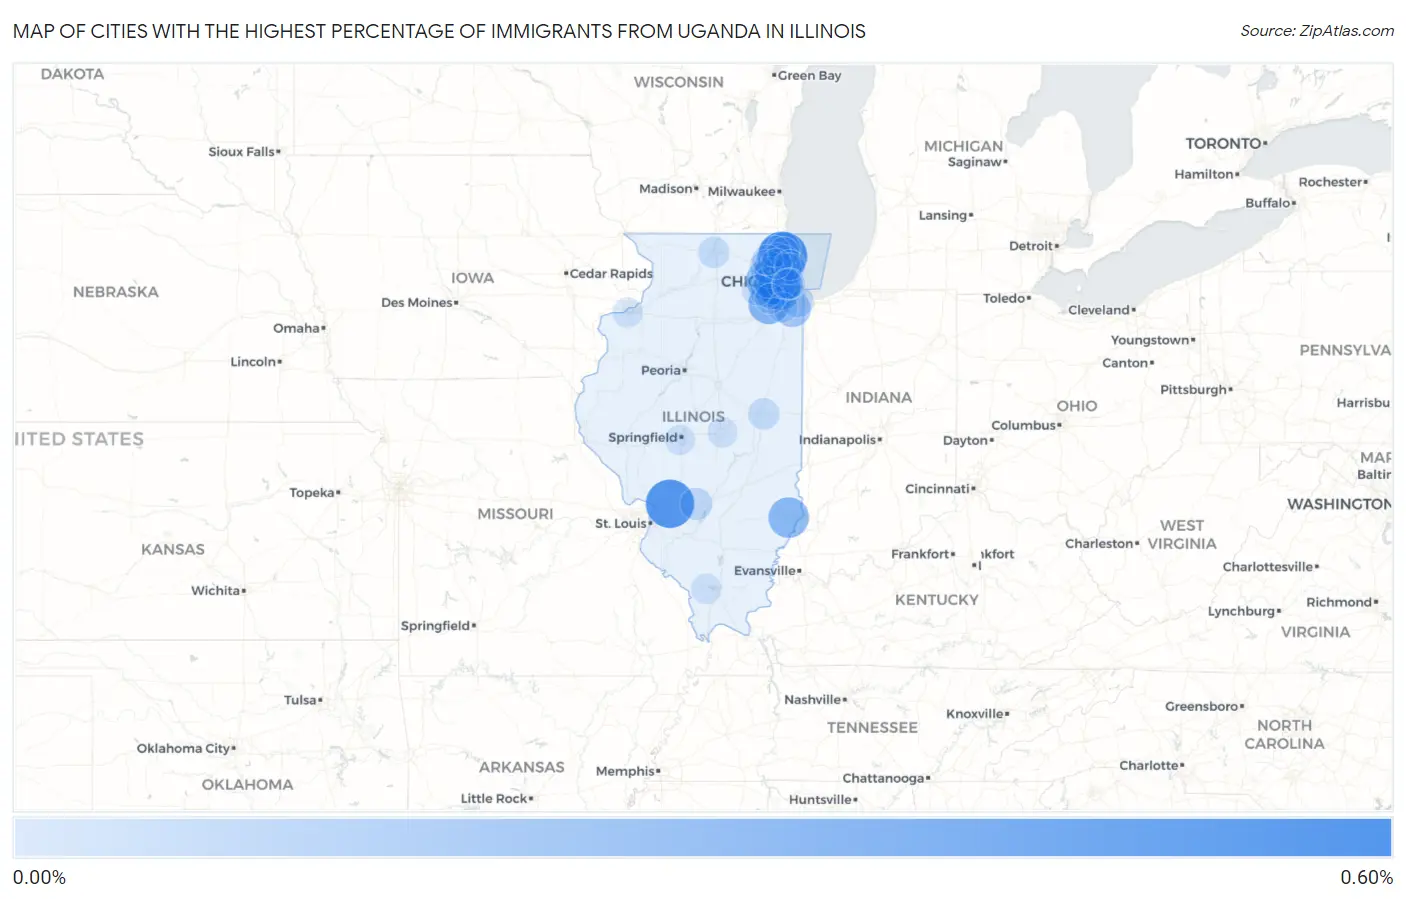
Map of Cities with the Highest Percentage of Immigrants from Uganda in Illinois
0.00%
0.60%
Cities with the Highest Percentage of Immigrants from Uganda in Illinois
| City | Uganda | vs State | vs National | |
| 1. | Bannockburn | 0.56% | 0.0082%(+0.555)#-1 | 0.011%(+0.552)#0 |
| 2. | Hamel | 0.53% | 0.0082%(+0.519)#0 | 0.011%(+0.516)#1 |
| 3. | Oak Brook | 0.41% | 0.0082%(+0.401)#1 | 0.011%(+0.398)#2 |
| 4. | Crest Hill | 0.30% | 0.0082%(+0.294)#2 | 0.011%(+0.291)#3 |
| 5. | Bridgeport | 0.30% | 0.0082%(+0.287)#3 | 0.011%(+0.284)#4 |
| 6. | Burr Ridge | 0.29% | 0.0082%(+0.279)#4 | 0.011%(+0.276)#5 |
| 7. | Winfield | 0.28% | 0.0082%(+0.273)#5 | 0.011%(+0.270)#6 |
| 8. | Olympia Fields | 0.18% | 0.0082%(+0.175)#6 | 0.011%(+0.172)#7 |
| 9. | Westmont | 0.14% | 0.0082%(+0.128)#7 | 0.011%(+0.125)#8 |
| 10. | Carol Stream | 0.11% | 0.0082%(+0.098)#8 | 0.011%(+0.095)#9 |
| 11. | Downers Grove | 0.10% | 0.0082%(+0.094)#9 | 0.011%(+0.091)#10 |
| 12. | Woodridge | 0.100% | 0.0082%(+0.092)#10 | 0.011%(+0.089)#11 |
| 13. | Schaumburg | 0.090% | 0.0082%(+0.082)#11 | 0.011%(+0.079)#12 |
| 14. | Lake Bluff | 0.084% | 0.0082%(+0.076)#12 | 0.011%(+0.073)#13 |
| 15. | Hoffman Estates | 0.077% | 0.0082%(+0.069)#13 | 0.011%(+0.066)#14 |
| 16. | Northbrook | 0.063% | 0.0082%(+0.055)#14 | 0.011%(+0.052)#15 |
| 17. | South Holland | 0.061% | 0.0082%(+0.053)#15 | 0.011%(+0.050)#16 |
| 18. | Des Plaines | 0.058% | 0.0082%(+0.050)#16 | 0.011%(+0.047)#17 |
| 19. | Naperville | 0.056% | 0.0082%(+0.048)#17 | 0.011%(+0.045)#18 |
| 20. | Greenville | 0.056% | 0.0082%(+0.048)#18 | 0.011%(+0.045)#19 |
| 21. | Cicero | 0.049% | 0.0082%(+0.041)#19 | 0.011%(+0.038)#20 |
| 22. | Westchester | 0.036% | 0.0082%(+0.028)#20 | 0.011%(+0.025)#21 |
| 23. | Buffalo Grove | 0.035% | 0.0082%(+0.027)#21 | 0.011%(+0.024)#22 |
| 24. | Urbana | 0.034% | 0.0082%(+0.025)#22 | 0.011%(+0.022)#23 |
| 25. | Morton Grove | 0.032% | 0.0082%(+0.024)#23 | 0.011%(+0.021)#208 |
| 26. | Rockford | 0.026% | 0.0082%(+0.018)#24 | 0.011%(+0.015)#209 |
| 27. | Roselle | 0.026% | 0.0082%(+0.018)#25 | 0.011%(+0.015)#210 |
| 28. | Mundelein | 0.022% | 0.0082%(+0.014)#26 | 0.011%(+0.011)#211 |
| 29. | Aurora | 0.021% | 0.0082%(+0.013)#27 | 0.011%(+0.010)#395 |
| 30. | Lake Forest | 0.021% | 0.0082%(+0.012)#28 | 0.011%(+0.010)#396 |
| 31. | Skokie | 0.015% | 0.0082%(+0.007)#29 | 0.011%(+0.004)#397 |
| 32. | Wheaton | 0.015% | 0.0082%(+0.007)#30 | 0.011%(+0.004)#398 |
| 33. | Stickney | 0.014% | 0.0082%(+0.006)#31 | 0.011%(+0.003)#399 |
| 34. | Barrington | 0.0089% | 0.0082%(+0.001)#32 | 0.011%(-0.002)#400 |
| 35. | Chicago | 0.0061% | 0.0082%(-0.002)#33 | 0.011%(-0.005)#401 |
| 36. | Mokena | 0.0050% | 0.0082%(-0.003)#34 | 0.011%(-0.006)#402 |
| 37. | Carbondale | 0.0045% | 0.0082%(-0.004)#35 | 0.011%(-0.007)#403 |
| 38. | Wilmette | 0.0036% | 0.0082%(-0.005)#36 | 0.011%(-0.007)#404 |
| 39. | Rock Island | 0.0027% | 0.0082%(-0.005)#37 | 0.011%(-0.008)#405 |
| 40. | Romeoville | 0.0025% | 0.0082%(-0.006)#38 | 0.011%(-0.009)#406 |
| 41. | Berwyn | 0.0018% | 0.0082%(-0.006)#39 | 0.011%(-0.009)#407 |
| 42. | Decatur | 0.0014% | 0.0082%(-0.007)#40 | 0.011%(-0.010)#408 |
| 43. | Arlington Heights | 0.0013% | 0.0082%(-0.007)#41 | 0.011%(-0.010)#409 |
| 44. | Springfield | 0.00087% | 0.0082%(-0.007)#42 | 0.011%(-0.010)#432 |
Common Questions
What are the Top 10 Cities with the Highest Percentage of Immigrants from Uganda in Illinois?
Top 10 Cities with the Highest Percentage of Immigrants from Uganda in Illinois are:
#1
0.56%
#2
0.53%
#3
0.41%
#4
0.30%
#5
0.30%
#6
0.29%
#7
0.28%
#8
0.18%
#9
0.14%
#10
0.11%
What city has the Highest Percentage of Immigrants from Uganda in Illinois?
Bannockburn has the Highest Percentage of Immigrants from Uganda in Illinois with 0.56%.
What is the Percentage of Immigrants from Uganda in the State of Illinois?
Percentage of Immigrants from Uganda in Illinois is 0.0082%.
What is the Percentage of Immigrants from Uganda in the United States?
Percentage of Immigrants from Uganda in the United States is 0.011%.