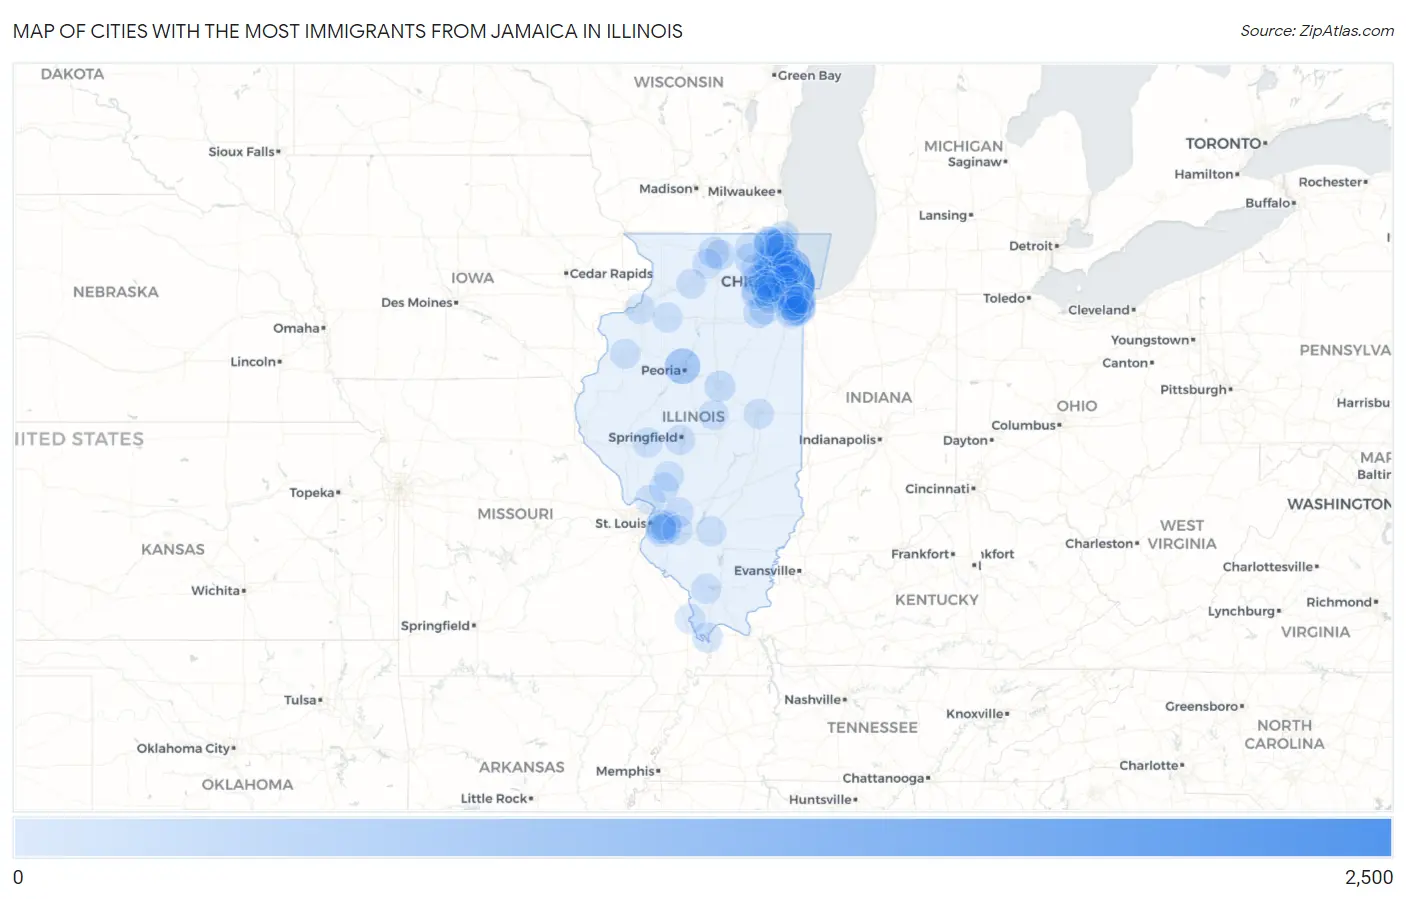
Cities with the Most Immigrants from Jamaica in Illinois
RELATED REPORTS & OPTIONS
Jamaica
Illinois
Compare Cities
Map of Cities with the Most Immigrants from Jamaica in Illinois
0
2,500
Cities with the Most Immigrants from Jamaica in Illinois
| City | Jamaica | vs State | vs National | |
| 1. | Chicago | 2,257 | 8,168(27.63%)#1 | 785,998(0.29%)#41 |
| 2. | Evanston | 673 | 8,168(8.24%)#2 | 785,998(0.09%)#129 |
| 3. | Peoria | 604 | 8,168(7.39%)#3 | 785,998(0.08%)#151 |
| 4. | Skokie | 425 | 8,168(5.20%)#4 | 785,998(0.05%)#216 |
| 5. | West Chicago | 205 | 8,168(2.51%)#5 | 785,998(0.03%)#384 |
| 6. | Carol Stream | 169 | 8,168(2.07%)#6 | 785,998(0.02%)#453 |
| 7. | Des Plaines | 151 | 8,168(1.85%)#7 | 785,998(0.02%)#511 |
| 8. | Lombard | 146 | 8,168(1.79%)#8 | 785,998(0.02%)#527 |
| 9. | Mount Prospect | 137 | 8,168(1.68%)#9 | 785,998(0.02%)#553 |
| 10. | Aurora | 135 | 8,168(1.65%)#10 | 785,998(0.02%)#559 |
| 11. | Waukegan | 131 | 8,168(1.60%)#11 | 785,998(0.02%)#570 |
| 12. | Bolingbrook | 128 | 8,168(1.57%)#12 | 785,998(0.02%)#582 |
| 13. | Joliet | 123 | 8,168(1.51%)#13 | 785,998(0.02%)#609 |
| 14. | Belleville | 114 | 8,168(1.40%)#14 | 785,998(0.01%)#649 |
| 15. | Minooka | 107 | 8,168(1.31%)#15 | 785,998(0.01%)#686 |
| 16. | Bloomington | 105 | 8,168(1.29%)#16 | 785,998(0.01%)#695 |
| 17. | Huntley | 105 | 8,168(1.29%)#17 | 785,998(0.01%)#698 |
| 18. | Schaumburg | 96 | 8,168(1.18%)#18 | 785,998(0.01%)#745 |
| 19. | Buffalo Grove | 85 | 8,168(1.04%)#19 | 785,998(0.01%)#811 |
| 20. | Rockford | 80 | 8,168(0.98%)#20 | 785,998(0.01%)#844 |
| 21. | Rolling Meadows | 74 | 8,168(0.91%)#21 | 785,998(0.01%)#885 |
| 22. | Cicero | 70 | 8,168(0.86%)#22 | 785,998(0.01%)#926 |
| 23. | Shiloh | 68 | 8,168(0.83%)#23 | 785,998(0.01%)#953 |
| 24. | Zion | 65 | 8,168(0.80%)#24 | 785,998(0.01%)#983 |
| 25. | Dolton | 57 | 8,168(0.70%)#25 | 785,998(0.01%)#1,074 |
| 26. | Palatine | 56 | 8,168(0.69%)#26 | 785,998(0.01%)#1,083 |
| 27. | Hoffman Estates | 56 | 8,168(0.69%)#27 | 785,998(0.01%)#1,085 |
| 28. | Country Club Hills | 55 | 8,168(0.67%)#28 | 785,998(0.01%)#1,098 |
| 29. | Chicago Heights | 44 | 8,168(0.54%)#29 | 785,998(0.01%)#1,247 |
| 30. | South Holland | 43 | 8,168(0.53%)#30 | 785,998(0.01%)#1,267 |
| 31. | Elgin | 42 | 8,168(0.51%)#31 | 785,998(0.01%)#1,275 |
| 32. | Round Lake | 39 | 8,168(0.48%)#32 | 785,998(0.00%)#1,332 |
| 33. | Prospect Heights | 39 | 8,168(0.48%)#33 | 785,998(0.00%)#1,335 |
| 34. | Geneva | 38 | 8,168(0.47%)#34 | 785,998(0.00%)#1,348 |
| 35. | Glenview | 36 | 8,168(0.44%)#35 | 785,998(0.00%)#1,391 |
| 36. | Barrington | 35 | 8,168(0.43%)#36 | 785,998(0.00%)#1,417 |
| 37. | O Fallon | 33 | 8,168(0.40%)#37 | 785,998(0.00%)#1,452 |
| 38. | Maywood | 33 | 8,168(0.40%)#38 | 785,998(0.00%)#1,454 |
| 39. | River Forest | 33 | 8,168(0.40%)#39 | 785,998(0.00%)#1,459 |
| 40. | Bensenville | 32 | 8,168(0.39%)#40 | 785,998(0.00%)#1,480 |
| 41. | Lansing | 30 | 8,168(0.37%)#41 | 785,998(0.00%)#1,523 |
| 42. | Grayslake | 30 | 8,168(0.37%)#42 | 785,998(0.00%)#1,527 |
| 43. | Cherry Valley | 29 | 8,168(0.36%)#43 | 785,998(0.00%)#1,567 |
| 44. | Highland | 28 | 8,168(0.34%)#44 | 785,998(0.00%)#1,587 |
| 45. | Boulder Hill | 28 | 8,168(0.34%)#45 | 785,998(0.00%)#1,589 |
| 46. | North Chicago | 27 | 8,168(0.33%)#46 | 785,998(0.00%)#1,616 |
| 47. | Midlothian | 27 | 8,168(0.33%)#47 | 785,998(0.00%)#1,621 |
| 48. | Northbrook | 26 | 8,168(0.32%)#48 | 785,998(0.00%)#1,646 |
| 49. | Sauk Village | 25 | 8,168(0.31%)#49 | 785,998(0.00%)#1,687 |
| 50. | Lynwood | 25 | 8,168(0.31%)#50 | 785,998(0.00%)#1,689 |
| 51. | Springfield | 23 | 8,168(0.28%)#51 | 785,998(0.00%)#1,726 |
| 52. | Forest Park | 23 | 8,168(0.28%)#52 | 785,998(0.00%)#1,738 |
| 53. | Cairo | 22 | 8,168(0.27%)#53 | 785,998(0.00%)#1,790 |
| 54. | Mundelein | 21 | 8,168(0.26%)#54 | 785,998(0.00%)#1,800 |
| 55. | Gurnee | 21 | 8,168(0.26%)#55 | 785,998(0.00%)#1,801 |
| 56. | Highland Park | 21 | 8,168(0.26%)#56 | 785,998(0.00%)#1,802 |
| 57. | Markham | 21 | 8,168(0.26%)#57 | 785,998(0.00%)#1,815 |
| 58. | Calumet City | 19 | 8,168(0.23%)#58 | 785,998(0.00%)#1,885 |
| 59. | Fairview Heights | 19 | 8,168(0.23%)#59 | 785,998(0.00%)#1,893 |
| 60. | Oak Park | 17 | 8,168(0.21%)#60 | 785,998(0.00%)#1,972 |
| 61. | Round Lake Beach | 17 | 8,168(0.21%)#61 | 785,998(0.00%)#1,977 |
| 62. | Park Forest | 17 | 8,168(0.21%)#62 | 785,998(0.00%)#1,980 |
| 63. | Riverdale | 16 | 8,168(0.20%)#63 | 785,998(0.00%)#2,036 |
| 64. | University Park | 16 | 8,168(0.20%)#64 | 785,998(0.00%)#2,041 |
| 65. | Wheaton | 15 | 8,168(0.18%)#65 | 785,998(0.00%)#2,065 |
| 66. | Woodridge | 15 | 8,168(0.18%)#66 | 785,998(0.00%)#2,071 |
| 67. | Champaign | 14 | 8,168(0.17%)#67 | 785,998(0.00%)#2,113 |
| 68. | Harvey | 14 | 8,168(0.17%)#68 | 785,998(0.00%)#2,121 |
| 69. | Naperville | 13 | 8,168(0.16%)#69 | 785,998(0.00%)#2,150 |
| 70. | Homewood | 13 | 8,168(0.16%)#70 | 785,998(0.00%)#2,161 |
| 71. | Bellwood | 13 | 8,168(0.16%)#71 | 785,998(0.00%)#2,163 |
| 72. | Centralia | 11 | 8,168(0.13%)#72 | 785,998(0.00%)#2,288 |
| 73. | Stillman Valley | 11 | 8,168(0.13%)#73 | 785,998(0.00%)#2,320 |
| 74. | Godfrey | 10 | 8,168(0.12%)#74 | 785,998(0.00%)#2,353 |
| 75. | Green Oaks | 10 | 8,168(0.12%)#75 | 785,998(0.00%)#2,375 |
| 76. | East Moline | 9 | 8,168(0.11%)#76 | 785,998(0.00%)#2,428 |
| 77. | Round Lake Heights | 9 | 8,168(0.11%)#77 | 785,998(0.00%)#2,463 |
| 78. | Carbondale | 8 | 8,168(0.10%)#78 | 785,998(0.00%)#2,486 |
| 79. | Lincolnwood | 8 | 8,168(0.10%)#79 | 785,998(0.00%)#2,498 |
| 80. | Carlinville | 8 | 8,168(0.10%)#80 | 785,998(0.00%)#2,517 |
| 81. | Jacksonville | 7 | 8,168(0.09%)#81 | 785,998(0.00%)#2,567 |
| 82. | Warrenville | 7 | 8,168(0.09%)#82 | 785,998(0.00%)#2,574 |
| 83. | Oak Lawn | 6 | 8,168(0.07%)#83 | 785,998(0.00%)#2,626 |
| 84. | Romeoville | 6 | 8,168(0.07%)#84 | 785,998(0.00%)#2,629 |
| 85. | Woodstock | 5 | 8,168(0.06%)#85 | 785,998(0.00%)#2,692 |
| 86. | Swansea | 5 | 8,168(0.06%)#86 | 785,998(0.00%)#2,697 |
| 87. | New Baden | 5 | 8,168(0.06%)#87 | 785,998(0.00%)#2,717 |
| 88. | Dixon | 4 | 8,168(0.05%)#88 | 785,998(0.00%)#2,763 |
| 89. | South Chicago Heights | 4 | 8,168(0.05%)#89 | 785,998(0.00%)#2,782 |
| 90. | Annawan | 4 | 8,168(0.05%)#90 | 785,998(0.00%)#2,809 |
| 91. | Flossmoor | 3 | 8,168(0.04%)#91 | 785,998(0.00%)#2,830 |
| 92. | Burnham | 3 | 8,168(0.04%)#92 | 785,998(0.00%)#2,845 |
| 93. | Golf | 3 | 8,168(0.04%)#93 | 785,998(0.00%)#2,868 |
| 94. | Kenney | 3 | 8,168(0.04%)#94 | 785,998(0.00%)#2,872 |
| 95. | Royal Lakes | 3 | 8,168(0.04%)#95 | 785,998(0.00%)#2,874 |
| 96. | Lisle | 2 | 8,168(0.02%)#96 | 785,998(0.00%)#2,883 |
| 97. | Monmouth | 1 | 8,168(0.01%)#97 | 785,998(0.00%)#2,970 |
| 98. | East Cape Girardeau | 1 | 8,168(0.01%)#98 | 785,998(0.00%)#3,007 |
Common Questions
What are the Top 10 Cities with the Most Immigrants from Jamaica in Illinois?
Top 10 Cities with the Most Immigrants from Jamaica in Illinois are:
#1
2,257
#2
673
#3
604
#4
425
#5
205
#6
169
#7
151
#8
146
#9
137
#10
135
What city has the Most Immigrants from Jamaica in Illinois?
Chicago has the Most Immigrants from Jamaica in Illinois with 2,257.
What is the Total Immigrants from Jamaica in the State of Illinois?
Total Immigrants from Jamaica in Illinois is 8,168.
What is the Total Immigrants from Jamaica in the United States?
Total Immigrants from Jamaica in the United States is 785,998.