Cities with the Most Immigrants from Malaysia in Illinois
RELATED REPORTS & OPTIONS
Malaysia
Illinois
Compare Cities
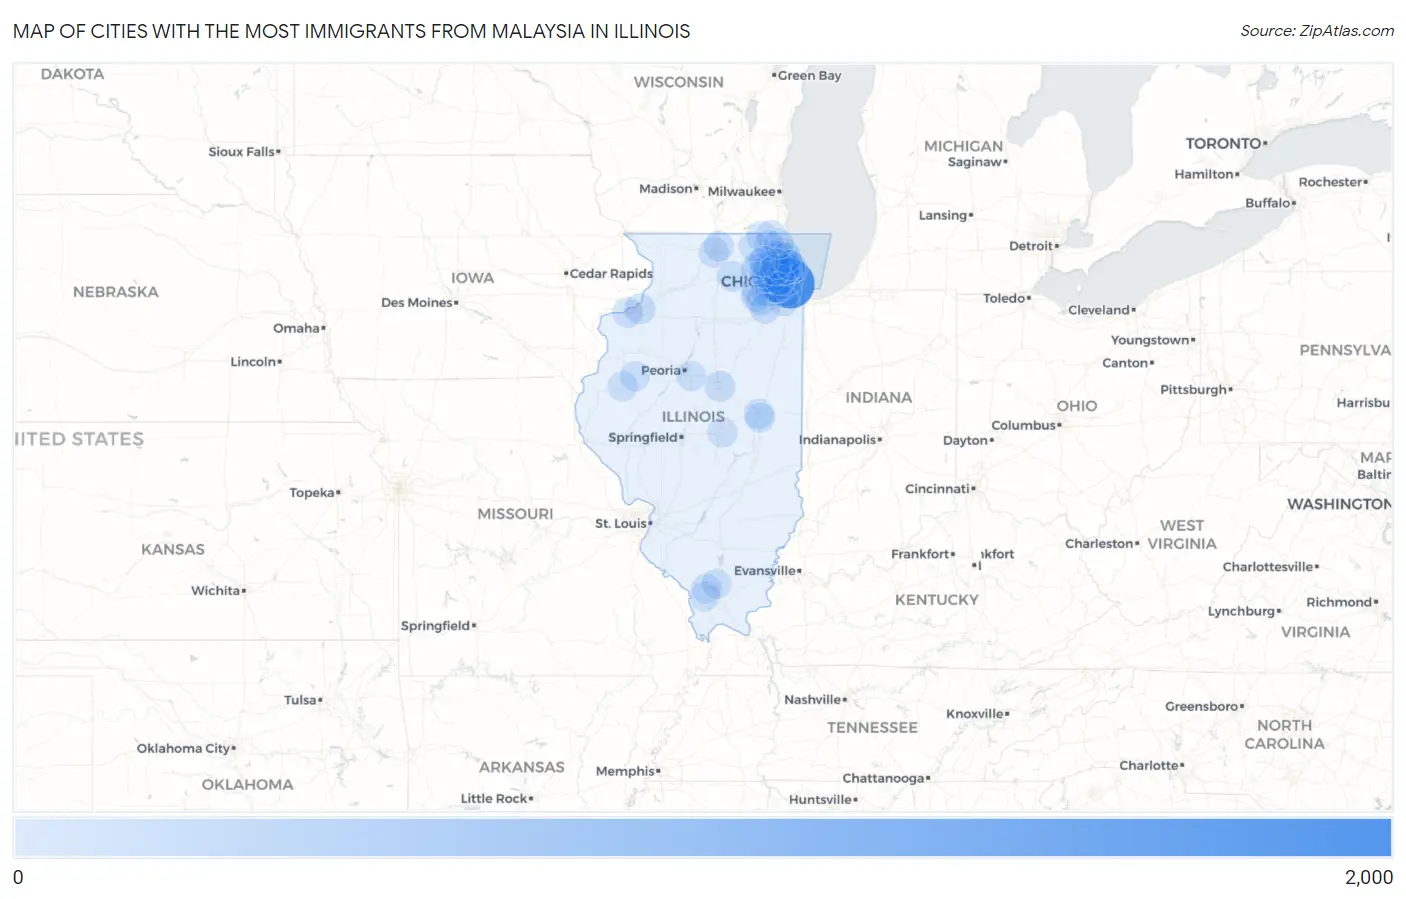
Map of Cities with the Most Immigrants from Malaysia in Illinois
0
2,000
Cities with the Most Immigrants from Malaysia in Illinois
| City | Malaysia | vs State | vs National | |
| 1. | Chicago | 1,674 | 3,256(51.41%)#1 | 82,574(2.03%)#2 |
| 2. | Rolling Meadows | 152 | 3,256(4.67%)#2 | 82,574(0.18%)#78 |
| 3. | Aurora | 128 | 3,256(3.93%)#3 | 82,574(0.16%)#102 |
| 4. | Wheaton | 77 | 3,256(2.36%)#4 | 82,574(0.09%)#180 |
| 5. | Plainfield | 73 | 3,256(2.24%)#5 | 82,574(0.09%)#190 |
| 6. | Bloomington | 63 | 3,256(1.93%)#6 | 82,574(0.08%)#228 |
| 7. | Oswego | 60 | 3,256(1.84%)#7 | 82,574(0.07%)#247 |
| 8. | La Grange Park | 59 | 3,256(1.81%)#8 | 82,574(0.07%)#252 |
| 9. | Dekalb | 57 | 3,256(1.75%)#9 | 82,574(0.07%)#261 |
| 10. | Lisle | 53 | 3,256(1.63%)#10 | 82,574(0.06%)#279 |
| 11. | Schaumburg | 52 | 3,256(1.60%)#11 | 82,574(0.06%)#282 |
| 12. | East Moline | 49 | 3,256(1.50%)#12 | 82,574(0.06%)#300 |
| 13. | Buffalo Grove | 39 | 3,256(1.20%)#13 | 82,574(0.05%)#364 |
| 14. | Naperville | 38 | 3,256(1.17%)#14 | 82,574(0.05%)#370 |
| 15. | Lincolnshire | 37 | 3,256(1.14%)#15 | 82,574(0.04%)#383 |
| 16. | Northfield | 32 | 3,256(0.98%)#16 | 82,574(0.04%)#445 |
| 17. | Elmhurst | 31 | 3,256(0.95%)#17 | 82,574(0.04%)#455 |
| 18. | Rock Island | 28 | 3,256(0.86%)#18 | 82,574(0.03%)#482 |
| 19. | Hinsdale | 28 | 3,256(0.86%)#19 | 82,574(0.03%)#488 |
| 20. | Glenview | 27 | 3,256(0.83%)#20 | 82,574(0.03%)#495 |
| 21. | Skokie | 25 | 3,256(0.77%)#21 | 82,574(0.03%)#513 |
| 22. | Oak Park | 25 | 3,256(0.77%)#22 | 82,574(0.03%)#515 |
| 23. | Bridgeview | 20 | 3,256(0.61%)#23 | 82,574(0.02%)#602 |
| 24. | Joliet | 19 | 3,256(0.58%)#24 | 82,574(0.02%)#612 |
| 25. | Rockford | 19 | 3,256(0.58%)#25 | 82,574(0.02%)#613 |
| 26. | Carol Stream | 17 | 3,256(0.52%)#26 | 82,574(0.02%)#664 |
| 27. | Hoffman Estates | 16 | 3,256(0.49%)#27 | 82,574(0.02%)#694 |
| 28. | Downers Grove | 16 | 3,256(0.49%)#28 | 82,574(0.02%)#695 |
| 29. | Loves Park | 16 | 3,256(0.49%)#29 | 82,574(0.02%)#699 |
| 30. | Elgin | 14 | 3,256(0.43%)#30 | 82,574(0.02%)#756 |
| 31. | Evanston | 14 | 3,256(0.43%)#31 | 82,574(0.02%)#760 |
| 32. | Orland Park | 14 | 3,256(0.43%)#32 | 82,574(0.02%)#764 |
| 33. | Macomb | 13 | 3,256(0.40%)#33 | 82,574(0.02%)#815 |
| 34. | Long Grove | 13 | 3,256(0.40%)#34 | 82,574(0.02%)#821 |
| 35. | Lake Forest | 12 | 3,256(0.37%)#35 | 82,574(0.01%)#857 |
| 36. | Spring Grove | 12 | 3,256(0.37%)#36 | 82,574(0.01%)#875 |
| 37. | East Dundee | 12 | 3,256(0.37%)#37 | 82,574(0.01%)#878 |
| 38. | Antioch | 11 | 3,256(0.34%)#38 | 82,574(0.01%)#908 |
| 39. | Decatur | 10 | 3,256(0.31%)#39 | 82,574(0.01%)#929 |
| 40. | Glendale Heights | 10 | 3,256(0.31%)#40 | 82,574(0.01%)#939 |
| 41. | Champaign | 9 | 3,256(0.28%)#41 | 82,574(0.01%)#969 |
| 42. | Bartlett | 9 | 3,256(0.28%)#42 | 82,574(0.01%)#979 |
| 43. | Morton Grove | 9 | 3,256(0.28%)#43 | 82,574(0.01%)#986 |
| 44. | Westmont | 9 | 3,256(0.28%)#44 | 82,574(0.01%)#987 |
| 45. | Round Lake | 9 | 3,256(0.28%)#45 | 82,574(0.01%)#994 |
| 46. | Berkeley | 9 | 3,256(0.28%)#46 | 82,574(0.01%)#1,005 |
| 47. | Park Ridge | 8 | 3,256(0.25%)#47 | 82,574(0.01%)#1,023 |
| 48. | Elk Grove Village | 8 | 3,256(0.25%)#48 | 82,574(0.01%)#1,025 |
| 49. | Highland Park | 8 | 3,256(0.25%)#49 | 82,574(0.01%)#1,029 |
| 50. | Arlington Heights | 7 | 3,256(0.21%)#50 | 82,574(0.01%)#1,062 |
| 51. | Bull Valley | 7 | 3,256(0.21%)#51 | 82,574(0.01%)#1,093 |
| 52. | Makanda | 7 | 3,256(0.21%)#52 | 82,574(0.01%)#1,095 |
| 53. | Wilmette | 6 | 3,256(0.18%)#53 | 82,574(0.01%)#1,110 |
| 54. | Gurnee | 5 | 3,256(0.15%)#54 | 82,574(0.01%)#1,160 |
| 55. | Barrington Hills | 5 | 3,256(0.15%)#55 | 82,574(0.01%)#1,179 |
| 56. | Carbondale | 4 | 3,256(0.12%)#56 | 82,574(0.00%)#1,198 |
| 57. | Herrin | 4 | 3,256(0.12%)#57 | 82,574(0.00%)#1,205 |
| 58. | Morton | 3 | 3,256(0.09%)#58 | 82,574(0.00%)#1,226 |
| 59. | Prairie City | 3 | 3,256(0.09%)#59 | 82,574(0.00%)#1,252 |
| 60. | Savoy | 2 | 3,256(0.06%)#60 | 82,574(0.00%)#1,268 |
Common Questions
What are the Top 10 Cities with the Most Immigrants from Malaysia in Illinois?
Top 10 Cities with the Most Immigrants from Malaysia in Illinois are:
#1
1,674
#2
152
#3
128
#4
77
#5
73
#6
63
#7
60
#8
59
#9
57
#10
53
What city has the Most Immigrants from Malaysia in Illinois?
Chicago has the Most Immigrants from Malaysia in Illinois with 1,674.
What is the Total Immigrants from Malaysia in the State of Illinois?
Total Immigrants from Malaysia in Illinois is 3,256.
What is the Total Immigrants from Malaysia in the United States?
Total Immigrants from Malaysia in the United States is 82,574.