Hoffman Estates, IL
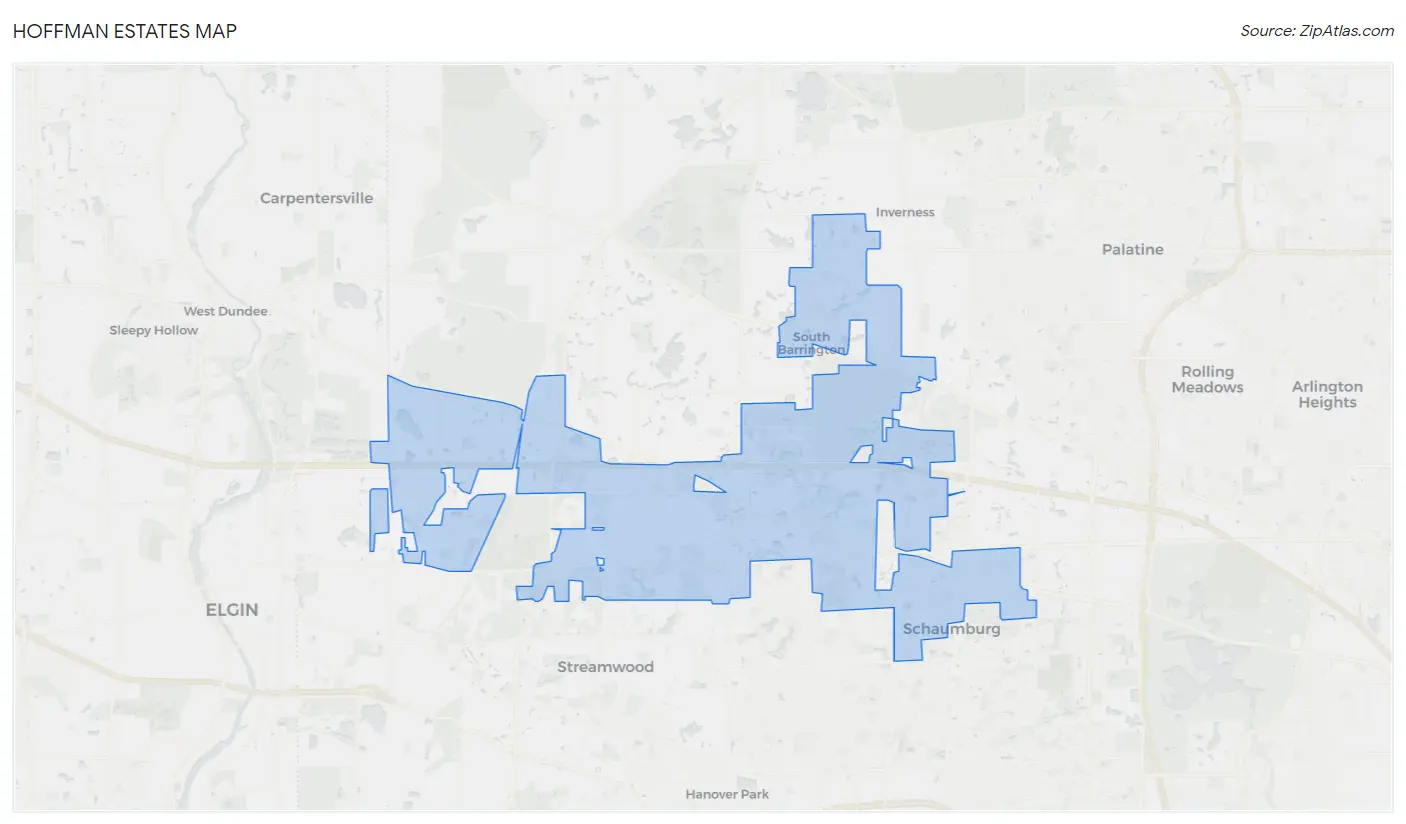
Hoffman Estates Map
Hoffman Estates Overview
51,744
TOTAL POPULATION
25,898
MALE POPULATION
25,846
FEMALE POPULATION
100.20
MALES / 100 FEMALES
99.80
FEMALES / 100 MALES
38.1
MEDIAN AGE
3.2
AVG FAMILY SIZE
2.8
AVG HOUSEHOLD SIZE
$45,302
PER CAPITA INCOME
$120,596
AVG FAMILY INCOME
$107,428
AVG HOUSEHOLD INCOME
31.2%
WAGE / INCOME GAP [ % ]
68.8¢/ $1
WAGE / INCOME GAP [ $ ]
0.38
INEQUALITY / GINI INDEX
29,515
LABOR FORCE [ PEOPLE ]
71.7%
PERCENT IN LABOR FORCE
3.7%
UNEMPLOYMENT RATE
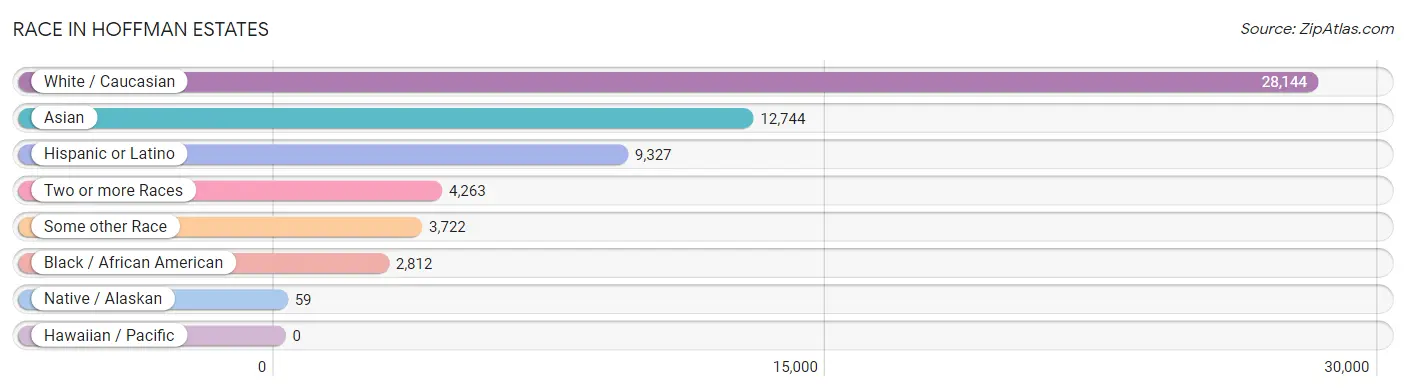
Race in Hoffman Estates
The most populous races in Hoffman Estates are White / Caucasian (28,144 | 54.4%), Asian (12,744 | 24.6%), and Hispanic or Latino (9,327 | 18.0%).
| Race | # Population | % Population |
| Asian | 12,744 | 24.6% |
| Black / African American | 2,812 | 5.4% |
| Hawaiian / Pacific | 0 | 0.0% |
| Hispanic or Latino | 9,327 | 18.0% |
| Native / Alaskan | 59 | 0.1% |
| White / Caucasian | 28,144 | 54.4% |
| Two or more Races | 4,263 | 8.2% |
| Some other Race | 3,722 | 7.2% |
| Total | 51,744 | 100.0% |
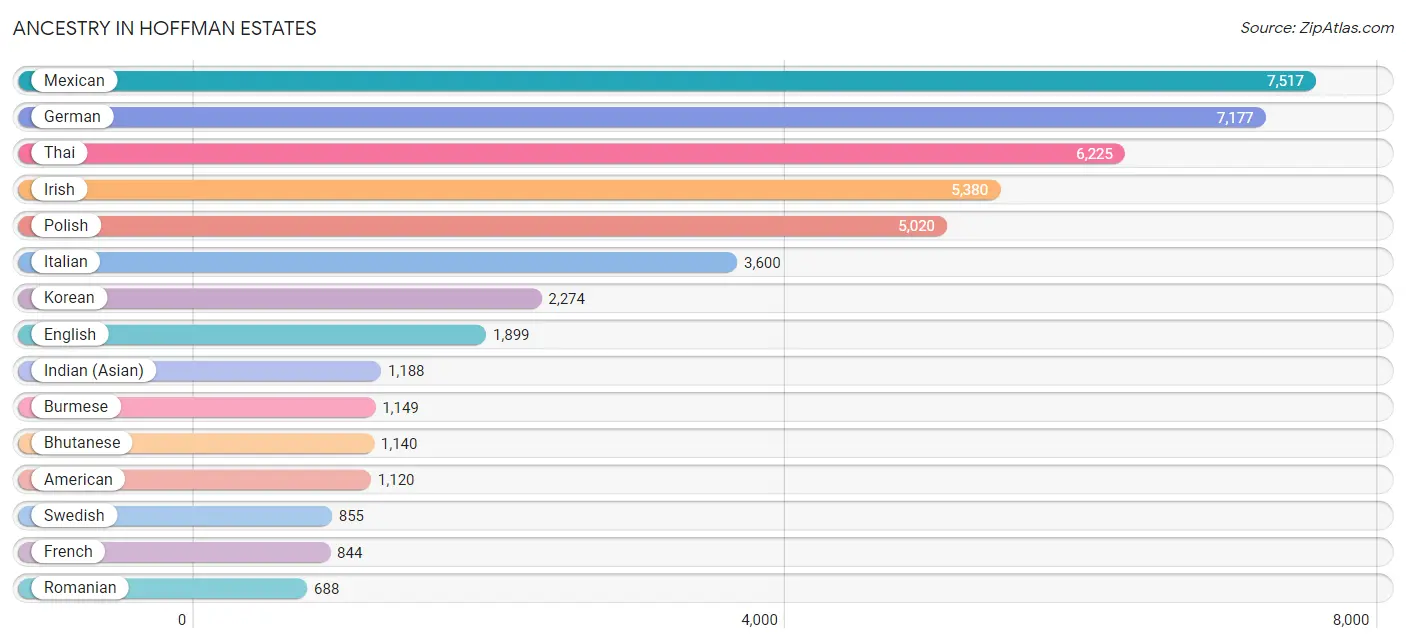
Ancestry in Hoffman Estates
The most populous ancestries reported in Hoffman Estates are Mexican (7,517 | 14.5%), German (7,177 | 13.9%), Thai (6,225 | 12.0%), Irish (5,380 | 10.4%), and Polish (5,020 | 9.7%), together accounting for 60.5% of all Hoffman Estates residents.
| Ancestry | # Population | % Population |
| African | 266 | 0.5% |
| Albanian | 131 | 0.3% |
| American | 1,120 | 2.2% |
| Arab | 518 | 1.0% |
| Argentinean | 24 | 0.1% |
| Armenian | 76 | 0.2% |
| Assyrian / Chaldean / Syriac | 450 | 0.9% |
| Austrian | 100 | 0.2% |
| Belgian | 29 | 0.1% |
| Bhutanese | 1,140 | 2.2% |
| Blackfeet | 24 | 0.1% |
| Bolivian | 14 | 0.0% |
| Brazilian | 38 | 0.1% |
| British | 131 | 0.3% |
| Bulgarian | 314 | 0.6% |
| Burmese | 1,149 | 2.2% |
| Cambodian | 145 | 0.3% |
| Canadian | 81 | 0.2% |
| Central American | 190 | 0.4% |
| Central American Indian | 29 | 0.1% |
| Cherokee | 14 | 0.0% |
| Chippewa | 18 | 0.0% |
| Choctaw | 36 | 0.1% |
| Colombian | 98 | 0.2% |
| Costa Rican | 10 | 0.0% |
| Creek | 34 | 0.1% |
| Croatian | 72 | 0.1% |
| Cuban | 53 | 0.1% |
| Czech | 210 | 0.4% |
| Czechoslovakian | 70 | 0.1% |
| Danish | 180 | 0.4% |
| Dominican | 4 | 0.0% |
| Dutch | 237 | 0.5% |
| Eastern European | 165 | 0.3% |
| Ecuadorian | 111 | 0.2% |
| Egyptian | 70 | 0.1% |
| English | 1,899 | 3.7% |
| Estonian | 33 | 0.1% |
| European | 446 | 0.9% |
| Filipino | 54 | 0.1% |
| Finnish | 28 | 0.1% |
| French | 844 | 1.6% |
| French Canadian | 82 | 0.2% |
| German | 7,177 | 13.9% |
| Greek | 630 | 1.2% |
| Guatemalan | 114 | 0.2% |
| Haitian | 70 | 0.1% |
| Hungarian | 141 | 0.3% |
| Indian (Asian) | 1,188 | 2.3% |
| Indonesian | 35 | 0.1% |
| Iranian | 62 | 0.1% |
| Iraqi | 24 | 0.1% |
| Irish | 5,380 | 10.4% |
| Iroquois | 12 | 0.0% |
| Italian | 3,600 | 7.0% |
| Jamaican | 188 | 0.4% |
| Jordanian | 14 | 0.0% |
| Korean | 2,274 | 4.4% |
| Lithuanian | 112 | 0.2% |
| Luxembourger | 18 | 0.0% |
| Macedonian | 10 | 0.0% |
| Maltese | 142 | 0.3% |
| Mexican | 7,517 | 14.5% |
| Mexican American Indian | 47 | 0.1% |
| Mongolian | 16 | 0.0% |
| Moroccan | 37 | 0.1% |
| Native Hawaiian | 24 | 0.1% |
| Nicaraguan | 22 | 0.0% |
| Nigerian | 288 | 0.6% |
| Norwegian | 622 | 1.2% |
| Osage | 37 | 0.1% |
| Pakistani | 96 | 0.2% |
| Palestinian | 87 | 0.2% |
| Panamanian | 44 | 0.1% |
| Pennsylvania German | 10 | 0.0% |
| Peruvian | 218 | 0.4% |
| Polish | 5,020 | 9.7% |
| Portuguese | 94 | 0.2% |
| Puerto Rican | 604 | 1.2% |
| Romanian | 688 | 1.3% |
| Russian | 392 | 0.8% |
| Scandinavian | 84 | 0.2% |
| Scotch-Irish | 287 | 0.5% |
| Scottish | 500 | 1.0% |
| Serbian | 462 | 0.9% |
| Slavic | 20 | 0.0% |
| Slovak | 94 | 0.2% |
| Slovene | 9 | 0.0% |
| South American | 590 | 1.1% |
| Spaniard | 122 | 0.2% |
| Spanish | 169 | 0.3% |
| Sri Lankan | 324 | 0.6% |
| Subsaharan African | 587 | 1.1% |
| Swedish | 855 | 1.7% |
| Swiss | 18 | 0.0% |
| Syrian | 125 | 0.2% |
| Thai | 6,225 | 12.0% |
| Turkish | 93 | 0.2% |
| Ukrainian | 210 | 0.4% |
| Venezuelan | 125 | 0.2% |
| Welsh | 120 | 0.2% |
| West Indian | 115 | 0.2% |
| Yugoslavian | 12 | 0.0% | View All 103 Rows |
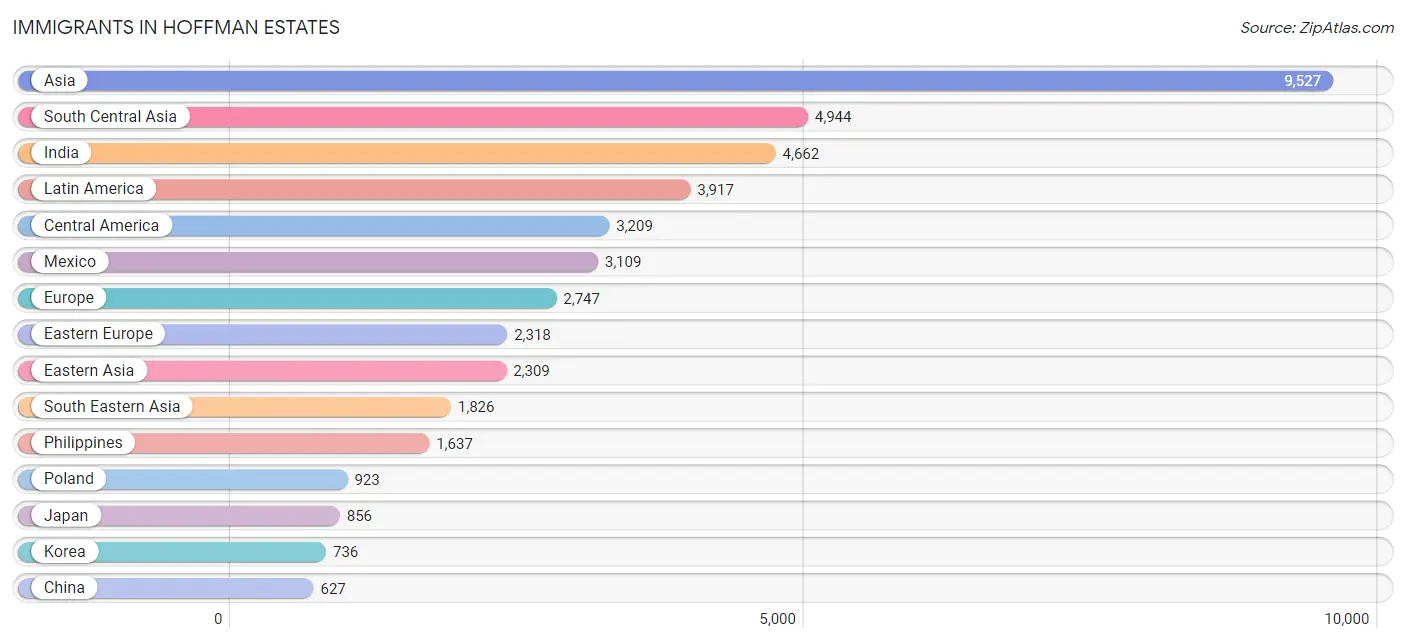
Immigrants in Hoffman Estates
The most numerous immigrant groups reported in Hoffman Estates came from Asia (9,527 | 18.4%), South Central Asia (4,944 | 9.6%), India (4,662 | 9.0%), Latin America (3,917 | 7.6%), and Central America (3,209 | 6.2%), together accounting for 50.7% of all Hoffman Estates residents.
| Immigration Origin | # Population | % Population |
| Africa | 608 | 1.2% |
| Albania | 81 | 0.2% |
| Argentina | 21 | 0.0% |
| Asia | 9,527 | 18.4% |
| Austria | 20 | 0.0% |
| Belarus | 10 | 0.0% |
| Brazil | 69 | 0.1% |
| Bulgaria | 185 | 0.4% |
| Canada | 261 | 0.5% |
| Caribbean | 87 | 0.2% |
| Central America | 3,209 | 6.2% |
| China | 627 | 1.2% |
| Colombia | 120 | 0.2% |
| Costa Rica | 10 | 0.0% |
| Croatia | 59 | 0.1% |
| Dominican Republic | 4 | 0.0% |
| Eastern Africa | 103 | 0.2% |
| Eastern Asia | 2,309 | 4.5% |
| Eastern Europe | 2,318 | 4.5% |
| Ecuador | 150 | 0.3% |
| Egypt | 82 | 0.2% |
| England | 8 | 0.0% |
| Ethiopia | 23 | 0.0% |
| Europe | 2,747 | 5.3% |
| Fiji | 7 | 0.0% |
| France | 36 | 0.1% |
| Germany | 57 | 0.1% |
| Greece | 101 | 0.2% |
| Guatemala | 46 | 0.1% |
| Haiti | 27 | 0.1% |
| Hong Kong | 32 | 0.1% |
| India | 4,662 | 9.0% |
| Iraq | 72 | 0.1% |
| Ireland | 57 | 0.1% |
| Italy | 125 | 0.2% |
| Jamaica | 56 | 0.1% |
| Japan | 856 | 1.7% |
| Kazakhstan | 26 | 0.1% |
| Kenya | 4 | 0.0% |
| Korea | 736 | 1.4% |
| Kuwait | 46 | 0.1% |
| Laos | 63 | 0.1% |
| Latin America | 3,917 | 7.6% |
| Malaysia | 16 | 0.0% |
| Mexico | 3,109 | 6.0% |
| Moldova | 140 | 0.3% |
| Morocco | 37 | 0.1% |
| Nepal | 19 | 0.0% |
| Nigeria | 282 | 0.5% |
| Northern Africa | 183 | 0.4% |
| Northern Europe | 90 | 0.2% |
| Oceania | 7 | 0.0% |
| Pakistan | 97 | 0.2% |
| Panama | 44 | 0.1% |
| Peru | 136 | 0.3% |
| Philippines | 1,637 | 3.2% |
| Poland | 923 | 1.8% |
| Romania | 184 | 0.4% |
| Russia | 166 | 0.3% |
| Saudi Arabia | 23 | 0.0% |
| Serbia | 319 | 0.6% |
| South Africa | 31 | 0.1% |
| South America | 621 | 1.2% |
| South Central Asia | 4,944 | 9.6% |
| South Eastern Asia | 1,826 | 3.5% |
| Southern Europe | 226 | 0.4% |
| Sri Lanka | 8 | 0.0% |
| Syria | 209 | 0.4% |
| Taiwan | 18 | 0.0% |
| Thailand | 45 | 0.1% |
| Turkey | 40 | 0.1% |
| Uganda | 40 | 0.1% |
| Ukraine | 233 | 0.4% |
| Uzbekistan | 27 | 0.1% |
| Venezuela | 125 | 0.2% |
| Vietnam | 42 | 0.1% |
| Western Africa | 282 | 0.5% |
| Western Asia | 390 | 0.7% |
| Western Europe | 113 | 0.2% | View All 79 Rows |
Sex and Age in Hoffman Estates
Sex and Age in Hoffman Estates
The most populous age groups in Hoffman Estates are 25 to 29 Years (2,042 | 7.9%) for men and 45 to 49 Years (2,297 | 8.9%) for women.
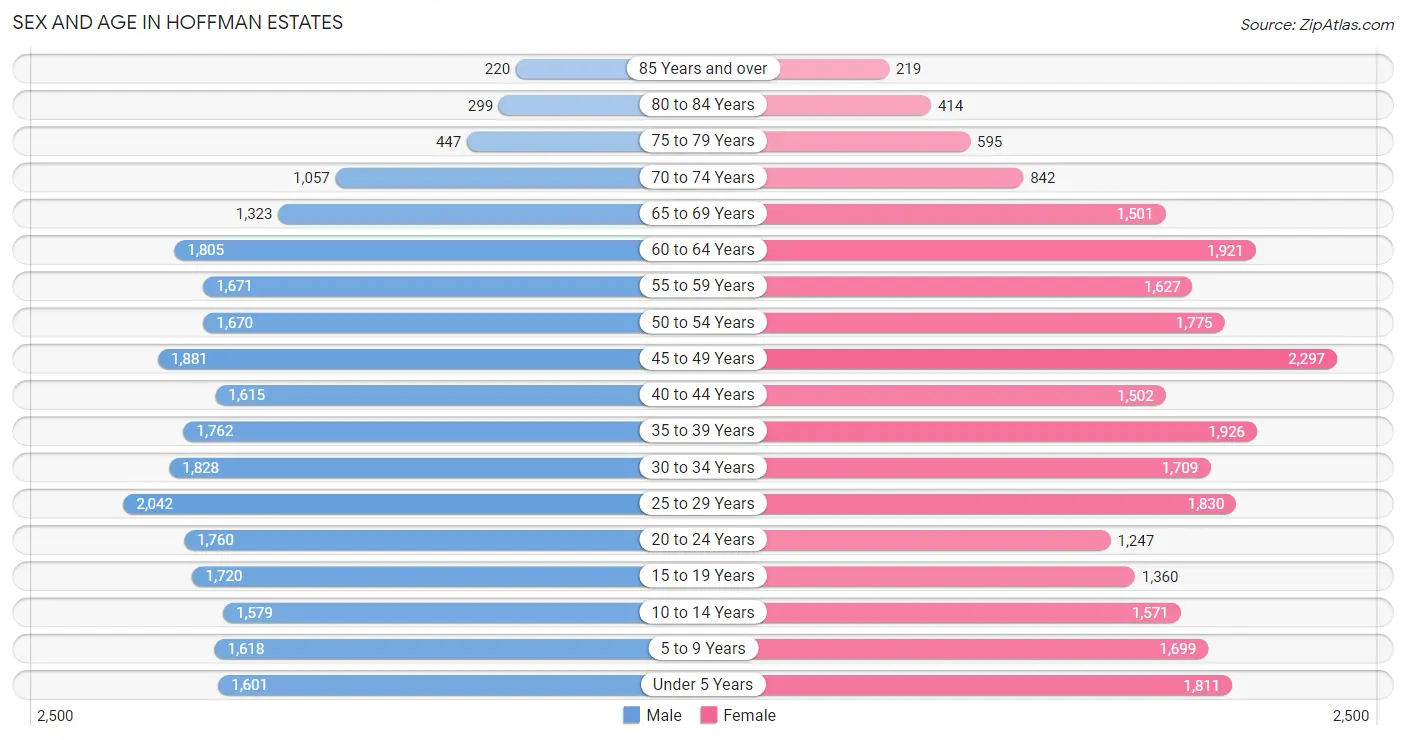
| Age Bracket | Male | Female |
| Under 5 Years | 1,601 (6.2%) | 1,811 (7.0%) |
| 5 to 9 Years | 1,618 (6.2%) | 1,699 (6.6%) |
| 10 to 14 Years | 1,579 (6.1%) | 1,571 (6.1%) |
| 15 to 19 Years | 1,720 (6.6%) | 1,360 (5.3%) |
| 20 to 24 Years | 1,760 (6.8%) | 1,247 (4.8%) |
| 25 to 29 Years | 2,042 (7.9%) | 1,830 (7.1%) |
| 30 to 34 Years | 1,828 (7.1%) | 1,709 (6.6%) |
| 35 to 39 Years | 1,762 (6.8%) | 1,926 (7.4%) |
| 40 to 44 Years | 1,615 (6.2%) | 1,502 (5.8%) |
| 45 to 49 Years | 1,881 (7.3%) | 2,297 (8.9%) |
| 50 to 54 Years | 1,670 (6.5%) | 1,775 (6.9%) |
| 55 to 59 Years | 1,671 (6.5%) | 1,627 (6.3%) |
| 60 to 64 Years | 1,805 (7.0%) | 1,921 (7.4%) |
| 65 to 69 Years | 1,323 (5.1%) | 1,501 (5.8%) |
| 70 to 74 Years | 1,057 (4.1%) | 842 (3.3%) |
| 75 to 79 Years | 447 (1.7%) | 595 (2.3%) |
| 80 to 84 Years | 299 (1.1%) | 414 (1.6%) |
| 85 Years and over | 220 (0.9%) | 219 (0.9%) |
| Total | 25,898 (100.0%) | 25,846 (100.0%) |
Families and Households in Hoffman Estates
Median Family Size in Hoffman Estates
The median family size in Hoffman Estates is 3.19 persons per family, with married-couple families (11,406 | 79.6%) accounting for the largest median family size of 3.31 persons per family. On the other hand, single female/mother families (2,269 | 15.8%) represent the smallest median family size with 2.69 persons per family.
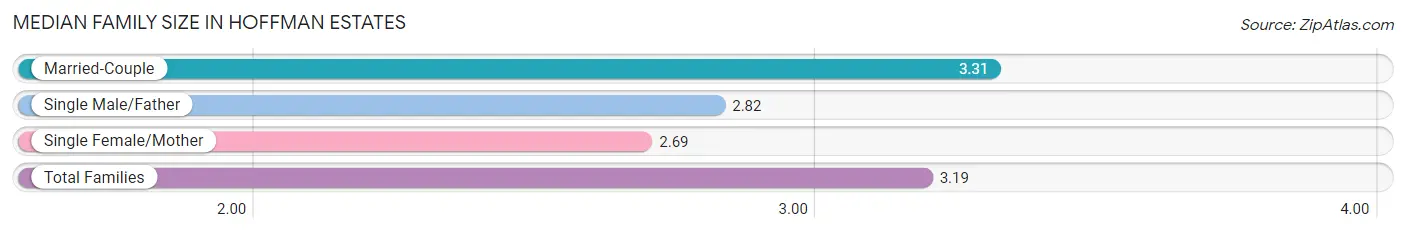
| Family Type | # Families | Family Size |
| Married-Couple | 11,406 (79.6%) | 3.31 |
| Single Male/Father | 662 (4.6%) | 2.82 |
| Single Female/Mother | 2,269 (15.8%) | 2.69 |
| Total Families | 14,337 (100.0%) | 3.19 |
Median Household Size in Hoffman Estates
The median household size in Hoffman Estates is 2.80 persons per household, with married-couple households (11,406 | 62.1%) accounting for the largest median household size of 3.32 persons per household. non-family households (4,035 | 22.0%) represent the smallest median household size with 1.26 persons per household.
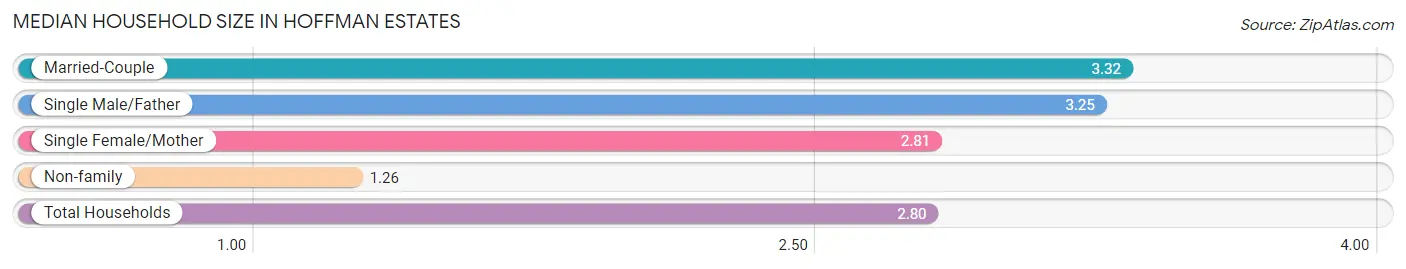
| Household Type | # Households | Household Size |
| Married-Couple | 11,406 (62.1%) | 3.32 |
| Single Male/Father | 662 (3.6%) | 3.25 |
| Single Female/Mother | 2,269 (12.3%) | 2.81 |
| Non-family | 4,035 (22.0%) | 1.26 |
| Total Households | 18,372 (100.0%) | 2.80 |
Household Size by Marriage Status in Hoffman Estates
Out of a total of 18,372 households in Hoffman Estates, 14,337 (78.0%) are family households, while 4,035 (22.0%) are nonfamily households. The most numerous type of family households are 2-person households, comprising 5,537, and the most common type of nonfamily households are 1-person households, comprising 3,113.
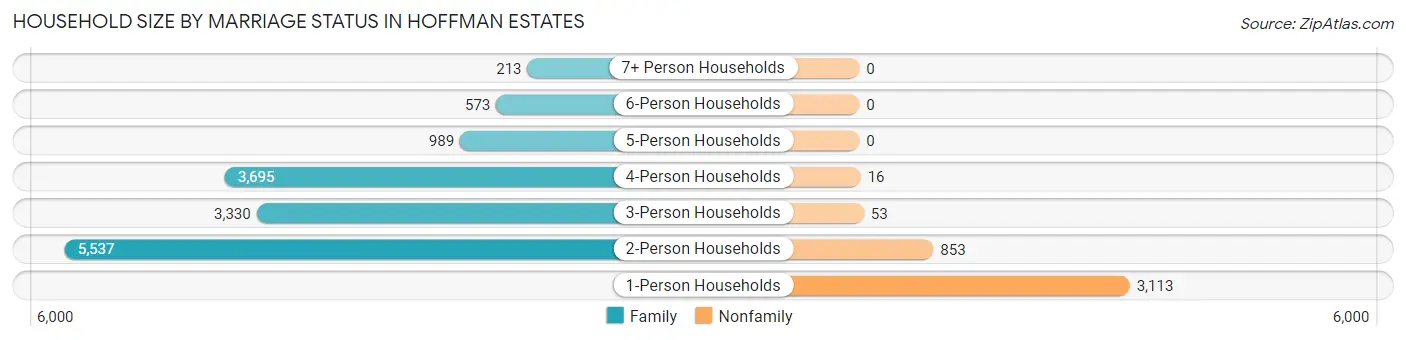
| Household Size | Family Households | Nonfamily Households |
| 1-Person Households | - | 3,113 (16.9%) |
| 2-Person Households | 5,537 (30.1%) | 853 (4.6%) |
| 3-Person Households | 3,330 (18.1%) | 53 (0.3%) |
| 4-Person Households | 3,695 (20.1%) | 16 (0.1%) |
| 5-Person Households | 989 (5.4%) | 0 (0.0%) |
| 6-Person Households | 573 (3.1%) | 0 (0.0%) |
| 7+ Person Households | 213 (1.2%) | 0 (0.0%) |
| Total | 14,337 (78.0%) | 4,035 (22.0%) |
Female Fertility in Hoffman Estates
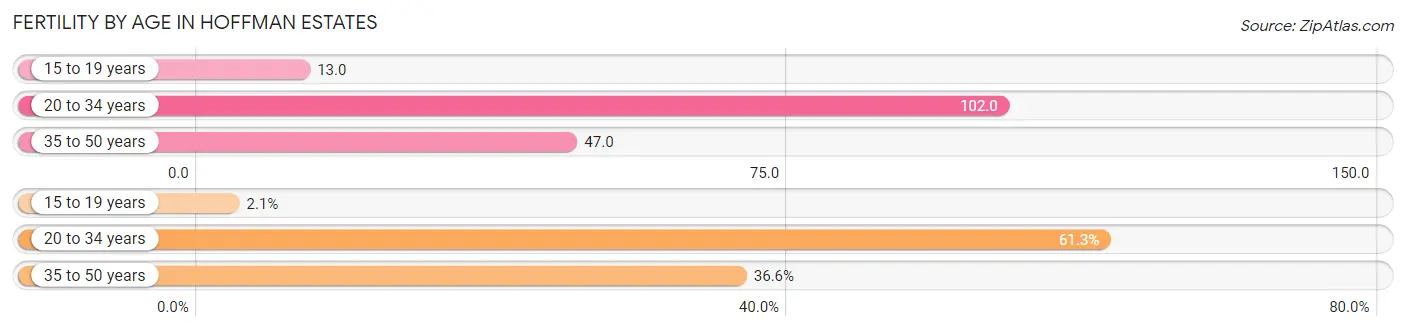
Fertility by Age in Hoffman Estates
Average fertility rate in Hoffman Estates is 64.0 births per 1,000 women. Women in the age bracket of 20 to 34 years have the highest fertility rate with 102.0 births per 1,000 women. Women in the age bracket of 20 to 34 years acount for 61.3% of all women with births.
| Age Bracket | Women with Births | Births / 1,000 Women |
| 15 to 19 years | 17 (2.1%) | 13.0 |
| 20 to 34 years | 486 (61.3%) | 102.0 |
| 35 to 50 years | 290 (36.6%) | 47.0 |
| Total | 793 (100.0%) | 64.0 |
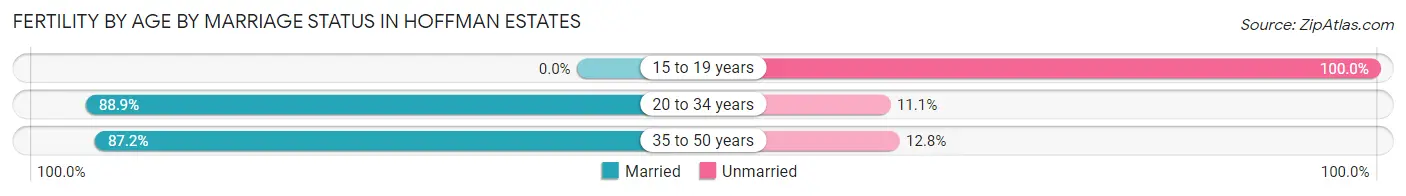
Fertility by Age by Marriage Status in Hoffman Estates
86.4% of women with births (793) in Hoffman Estates are married. The highest percentage of unmarried women with births falls into 15 to 19 years age bracket with 100.0% of them unmarried at the time of birth, while the lowest percentage of unmarried women with births belong to 20 to 34 years age bracket with 11.1% of them unmarried.
| Age Bracket | Married | Unmarried |
| 15 to 19 years | 0 (0.0%) | 17 (100.0%) |
| 20 to 34 years | 432 (88.9%) | 54 (11.1%) |
| 35 to 50 years | 253 (87.2%) | 37 (12.8%) |
| Total | 685 (86.4%) | 108 (13.6%) |
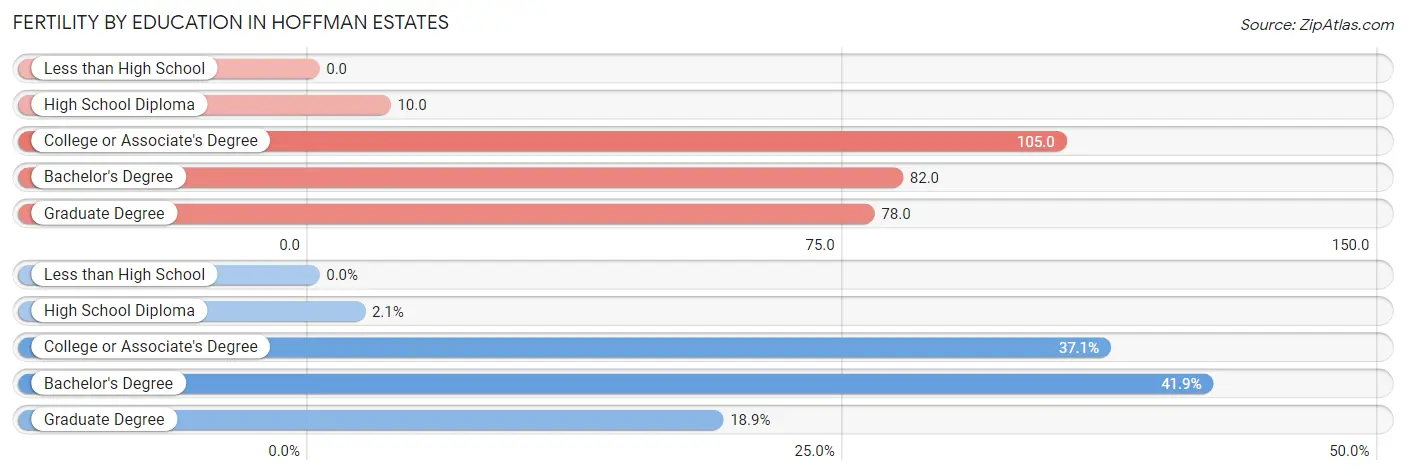
Fertility by Education in Hoffman Estates
| Educational Attainment | Women with Births | Births / 1,000 Women |
| Less than High School | 0 (0.0%) | 0.0 |
| High School Diploma | 17 (2.1%) | 10.0 |
| College or Associate's Degree | 294 (37.1%) | 105.0 |
| Bachelor's Degree | 332 (41.9%) | 82.0 |
| Graduate Degree | 150 (18.9%) | 78.0 |
| Total | 793 (100.0%) | 64.0 |
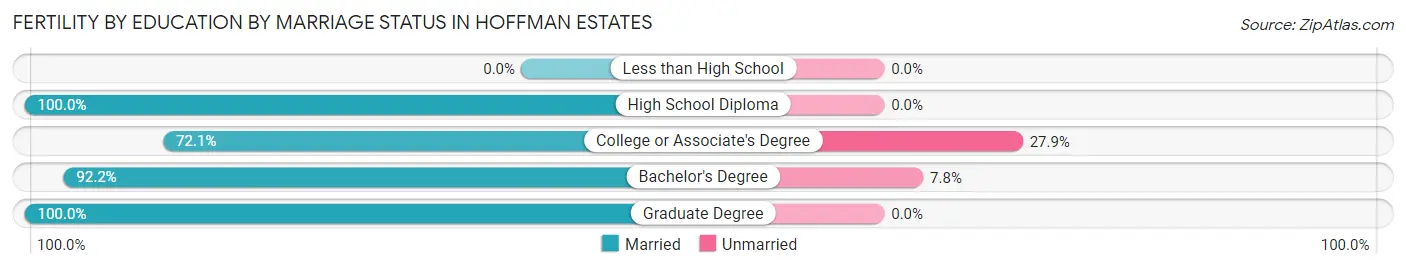
Fertility by Education by Marriage Status in Hoffman Estates
13.6% of women with births in Hoffman Estates are unmarried. Women with the educational attainment of high school diploma are most likely to be married with 100.0% of them married at childbirth, while women with the educational attainment of college or associate's degree are least likely to be married with 27.9% of them unmarried at childbirth.
| Educational Attainment | Married | Unmarried |
| Less than High School | 0 (0.0%) | 0 (0.0%) |
| High School Diploma | 17 (100.0%) | 0 (0.0%) |
| College or Associate's Degree | 212 (72.1%) | 82 (27.9%) |
| Bachelor's Degree | 306 (92.2%) | 26 (7.8%) |
| Graduate Degree | 150 (100.0%) | 0 (0.0%) |
| Total | 685 (86.4%) | 108 (13.6%) |
Income in Hoffman Estates
Income Overview in Hoffman Estates
Per Capita Income in Hoffman Estates is $45,302, while median incomes of families and households are $120,596 and $107,428 respectively.
| Characteristic | Number | Measure |
| Per Capita Income | 51,744 | $45,302 |
| Median Family Income | 14,337 | $120,596 |
| Mean Family Income | 14,337 | $138,014 |
| Median Household Income | 18,372 | $107,428 |
| Mean Household Income | 18,372 | $126,580 |
| Income Deficit | 14,337 | $0 |
| Wage / Income Gap (%) | 51,744 | 31.23% |
| Wage / Income Gap ($) | 51,744 | 68.77¢ per $1 |
| Gini / Inequality Index | 51,744 | 0.38 |
Earnings by Sex in Hoffman Estates
Average Earnings in Hoffman Estates are $51,691, $61,579 for men and $42,347 for women, a difference of 31.2%.
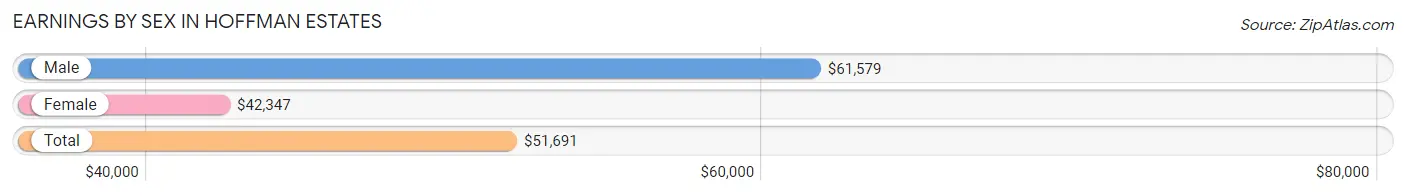
| Sex | Number | Average Earnings |
| Male | 16,279 (53.5%) | $61,579 |
| Female | 14,137 (46.5%) | $42,347 |
| Total | 30,416 (100.0%) | $51,691 |
Earnings by Sex by Income Bracket in Hoffman Estates
The most common earnings brackets in Hoffman Estates are $100,000+ for men (4,636 | 28.5%) and $75,000 to $99,999 for women (1,963 | 13.9%).
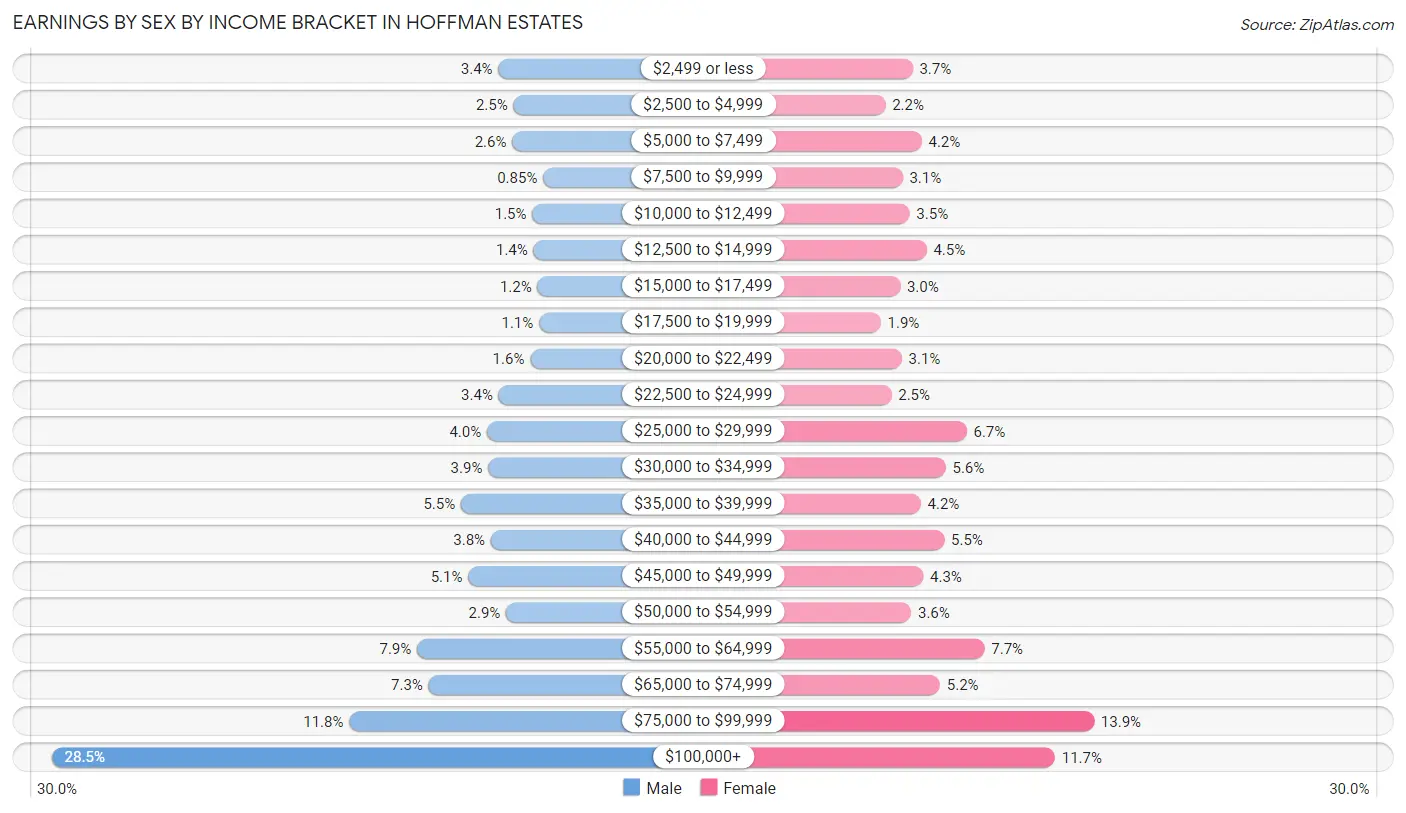
| Income | Male | Female |
| $2,499 or less | 549 (3.4%) | 521 (3.7%) |
| $2,500 to $4,999 | 410 (2.5%) | 306 (2.2%) |
| $5,000 to $7,499 | 421 (2.6%) | 594 (4.2%) |
| $7,500 to $9,999 | 138 (0.9%) | 443 (3.1%) |
| $10,000 to $12,499 | 237 (1.5%) | 498 (3.5%) |
| $12,500 to $14,999 | 226 (1.4%) | 634 (4.5%) |
| $15,000 to $17,499 | 191 (1.2%) | 422 (3.0%) |
| $17,500 to $19,999 | 176 (1.1%) | 269 (1.9%) |
| $20,000 to $22,499 | 257 (1.6%) | 435 (3.1%) |
| $22,500 to $24,999 | 545 (3.4%) | 354 (2.5%) |
| $25,000 to $29,999 | 652 (4.0%) | 952 (6.7%) |
| $30,000 to $34,999 | 642 (3.9%) | 785 (5.6%) |
| $35,000 to $39,999 | 890 (5.5%) | 587 (4.2%) |
| $40,000 to $44,999 | 617 (3.8%) | 773 (5.5%) |
| $45,000 to $49,999 | 824 (5.1%) | 607 (4.3%) |
| $50,000 to $54,999 | 477 (2.9%) | 510 (3.6%) |
| $55,000 to $64,999 | 1,293 (7.9%) | 1,093 (7.7%) |
| $65,000 to $74,999 | 1,186 (7.3%) | 739 (5.2%) |
| $75,000 to $99,999 | 1,912 (11.7%) | 1,963 (13.9%) |
| $100,000+ | 4,636 (28.5%) | 1,652 (11.7%) |
| Total | 16,279 (100.0%) | 14,137 (100.0%) |
Earnings by Sex by Educational Attainment in Hoffman Estates
Average earnings in Hoffman Estates are $68,469 for men and $45,518 for women, a difference of 33.5%. Men with an educational attainment of graduate degree enjoy the highest average annual earnings of $118,710, while those with less than high school education earn the least with $36,283. Women with an educational attainment of graduate degree earn the most with the average annual earnings of $75,682, while those with less than high school education have the smallest earnings of $25,542.
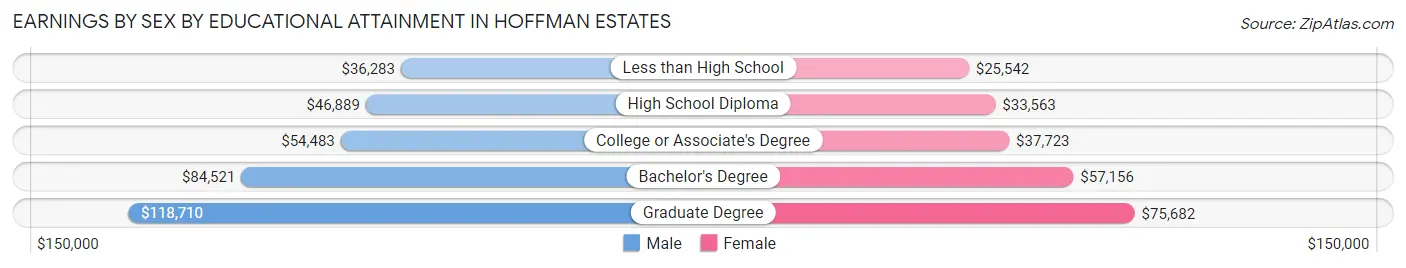
| Educational Attainment | Male Income | Female Income |
| Less than High School | $36,283 | $25,542 |
| High School Diploma | $46,889 | $33,563 |
| College or Associate's Degree | $54,483 | $37,723 |
| Bachelor's Degree | $84,521 | $57,156 |
| Graduate Degree | $118,710 | $75,682 |
| Total | $68,469 | $45,518 |
Family Income in Hoffman Estates
Family Income Brackets in Hoffman Estates
According to the Hoffman Estates family income data, there are 3,326 families falling into the $100,000 to $149,999 income range, which is the most common income bracket and makes up 23.2% of all families. Conversely, the $10,000 to $14,999 income bracket is the least frequent group with only 43 families (0.3%) belonging to this category.
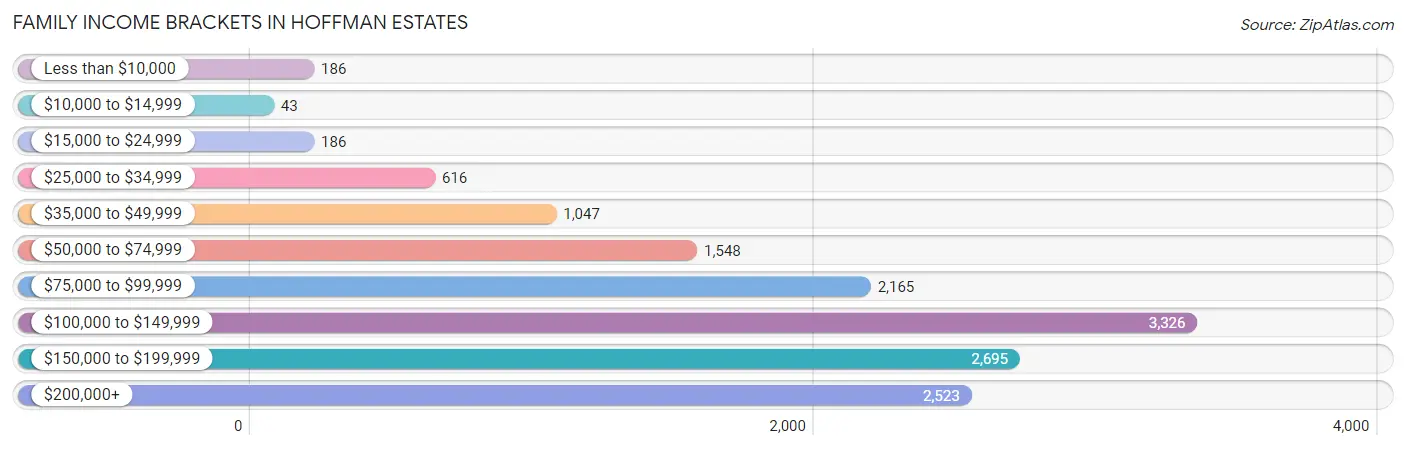
| Income Bracket | # Families | % Families |
| Less than $10,000 | 186 | 1.3% |
| $10,000 to $14,999 | 43 | 0.3% |
| $15,000 to $24,999 | 186 | 1.3% |
| $25,000 to $34,999 | 616 | 4.3% |
| $35,000 to $49,999 | 1,047 | 7.3% |
| $50,000 to $74,999 | 1,548 | 10.8% |
| $75,000 to $99,999 | 2,165 | 15.1% |
| $100,000 to $149,999 | 3,326 | 23.2% |
| $150,000 to $199,999 | 2,695 | 18.8% |
| $200,000+ | 2,523 | 17.6% |
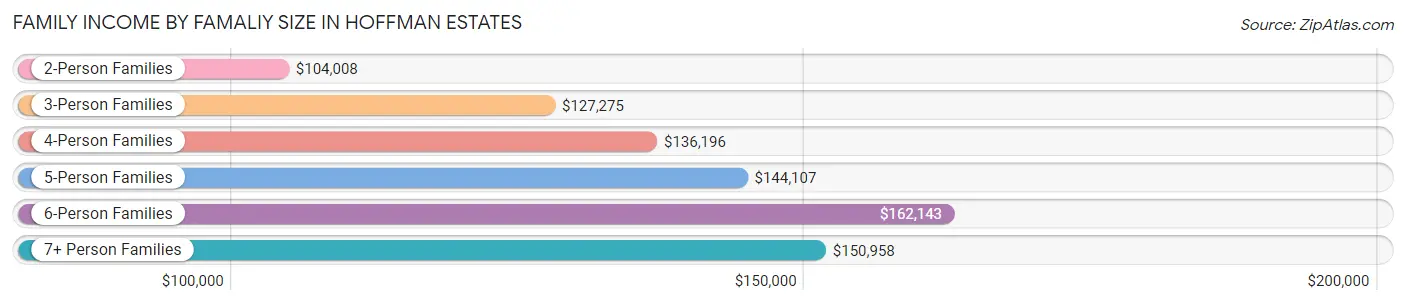
Family Income by Famaliy Size in Hoffman Estates
6-person families (552 | 3.8%) account for the highest median family income in Hoffman Estates with $162,143 per family, while 2-person families (5,889 | 41.1%) have the highest median income of $52,004 per family member.
| Income Bracket | # Families | Median Income |
| 2-Person Families | 5,889 (41.1%) | $104,008 |
| 3-Person Families | 3,221 (22.5%) | $127,275 |
| 4-Person Families | 3,522 (24.6%) | $136,196 |
| 5-Person Families | 990 (6.9%) | $144,107 |
| 6-Person Families | 552 (3.8%) | $162,143 |
| 7+ Person Families | 163 (1.1%) | $150,958 |
| Total | 14,337 (100.0%) | $120,596 |
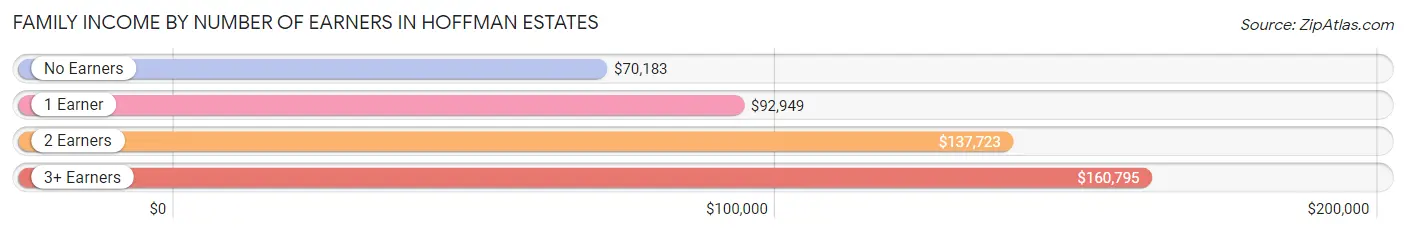
Family Income by Number of Earners in Hoffman Estates
The median family income in Hoffman Estates is $120,596, with families comprising 3+ earners (2,353) having the highest median family income of $160,795, while families with no earners (900) have the lowest median family income of $70,183, accounting for 16.4% and 6.3% of families, respectively.
| Number of Earners | # Families | Median Income |
| No Earners | 900 (6.3%) | $70,183 |
| 1 Earner | 4,193 (29.2%) | $92,949 |
| 2 Earners | 6,891 (48.1%) | $137,723 |
| 3+ Earners | 2,353 (16.4%) | $160,795 |
| Total | 14,337 (100.0%) | $120,596 |
Household Income in Hoffman Estates
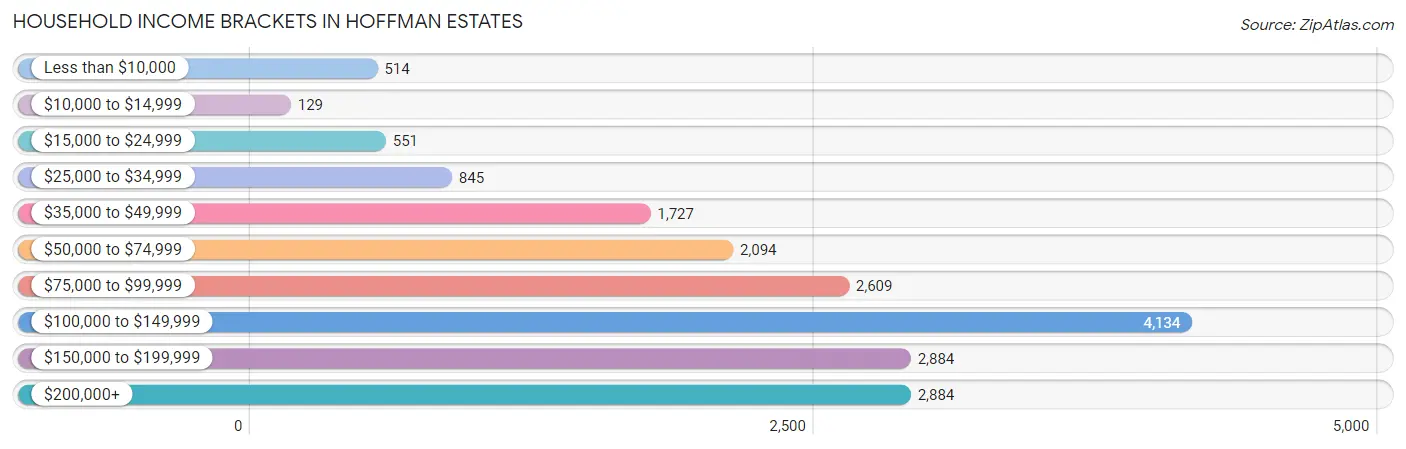
Household Income Brackets in Hoffman Estates
With 4,134 households falling in the category, the $100,000 to $149,999 income range is the most frequent in Hoffman Estates, accounting for 22.5% of all households. In contrast, only 129 households (0.7%) fall into the $10,000 to $14,999 income bracket, making it the least populous group.
| Income Bracket | # Households | % Households |
| Less than $10,000 | 514 | 2.8% |
| $10,000 to $14,999 | 129 | 0.7% |
| $15,000 to $24,999 | 551 | 3.0% |
| $25,000 to $34,999 | 845 | 4.6% |
| $35,000 to $49,999 | 1,727 | 9.4% |
| $50,000 to $74,999 | 2,094 | 11.4% |
| $75,000 to $99,999 | 2,609 | 14.2% |
| $100,000 to $149,999 | 4,134 | 22.5% |
| $150,000 to $199,999 | 2,884 | 15.7% |
| $200,000+ | 2,884 | 15.7% |
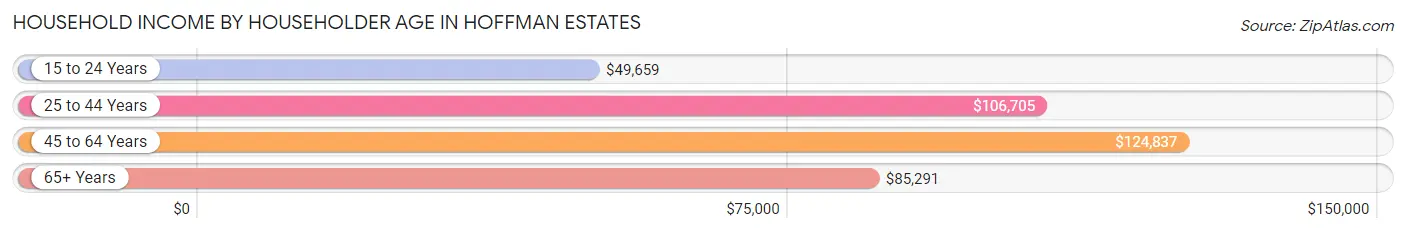
Household Income by Householder Age in Hoffman Estates
The median household income in Hoffman Estates is $107,428, with the highest median household income of $124,837 found in the 45 to 64 years age bracket for the primary householder. A total of 8,191 households (44.6%) fall into this category. Meanwhile, the 15 to 24 years age bracket for the primary householder has the lowest median household income of $49,659, with 280 households (1.5%) in this group.
| Income Bracket | # Households | Median Income |
| 15 to 24 Years | 280 (1.5%) | $49,659 |
| 25 to 44 Years | 6,194 (33.7%) | $106,705 |
| 45 to 64 Years | 8,191 (44.6%) | $124,837 |
| 65+ Years | 3,707 (20.2%) | $85,291 |
| Total | 18,372 (100.0%) | $107,428 |
Poverty in Hoffman Estates
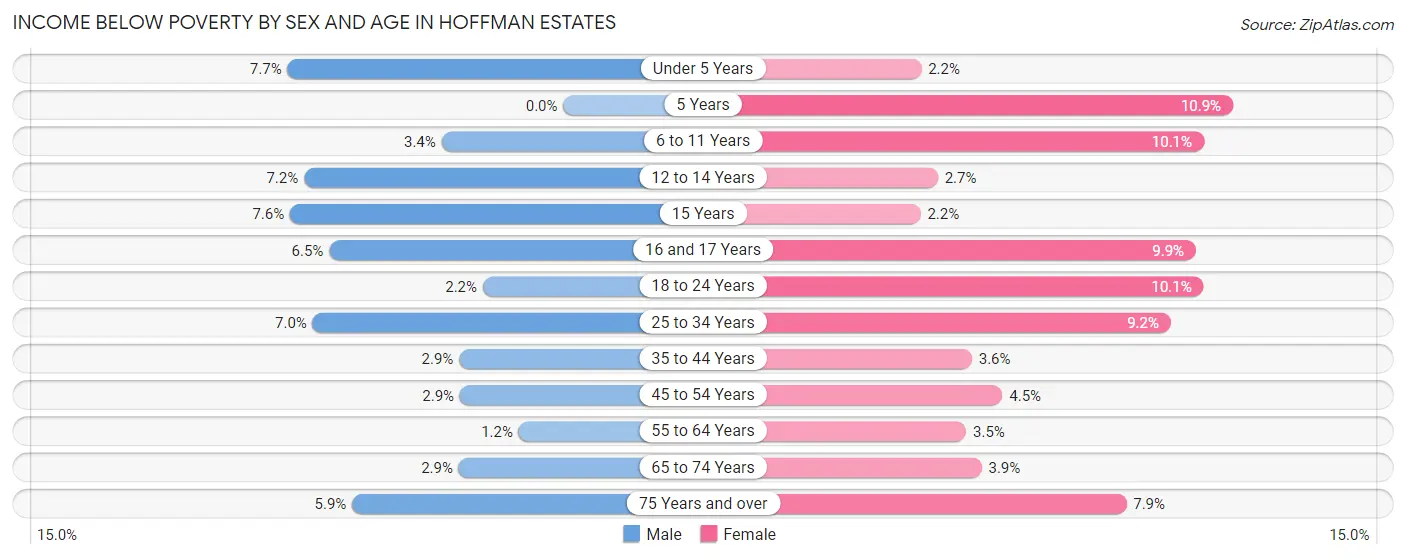
Income Below Poverty by Sex and Age in Hoffman Estates
With 4.0% poverty level for males and 5.7% for females among the residents of Hoffman Estates, under 5 year old males and 5 year old females are the most vulnerable to poverty, with 123 males (7.7%) and 28 females (10.9%) in their respective age groups living below the poverty level.
| Age Bracket | Male | Female |
| Under 5 Years | 123 (7.7%) | 40 (2.2%) |
| 5 Years | 0 (0.0%) | 28 (10.9%) |
| 6 to 11 Years | 63 (3.4%) | 200 (10.1%) |
| 12 to 14 Years | 64 (7.2%) | 26 (2.7%) |
| 15 Years | 29 (7.6%) | 7 (2.2%) |
| 16 and 17 Years | 48 (6.5%) | 64 (9.9%) |
| 18 to 24 Years | 53 (2.2%) | 165 (10.1%) |
| 25 to 34 Years | 270 (7.0%) | 324 (9.2%) |
| 35 to 44 Years | 98 (2.9%) | 124 (3.6%) |
| 45 to 54 Years | 102 (2.9%) | 182 (4.5%) |
| 55 to 64 Years | 43 (1.2%) | 122 (3.5%) |
| 65 to 74 Years | 69 (2.9%) | 90 (3.9%) |
| 75 Years and over | 55 (5.9%) | 91 (7.9%) |
| Total | 1,017 (4.0%) | 1,463 (5.7%) |
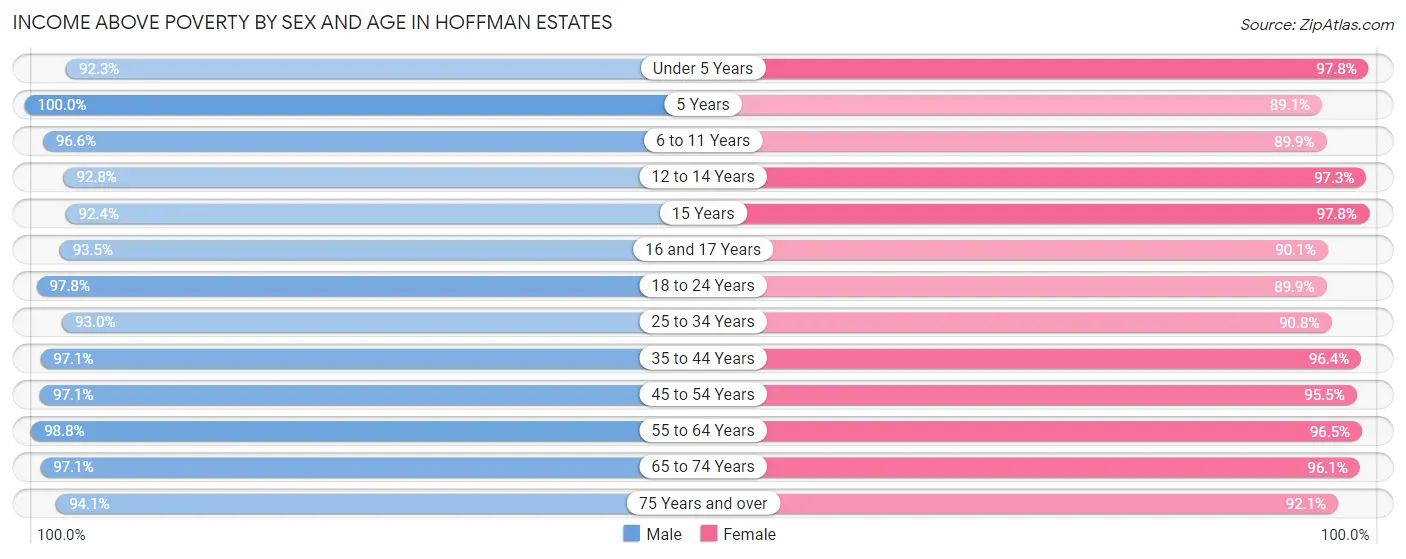
Income Above Poverty by Sex and Age in Hoffman Estates
According to the poverty statistics in Hoffman Estates, males aged 5 years and females aged 15 years are the age groups that are most secure financially, with 100.0% of males and 97.8% of females in these age groups living above the poverty line.
| Age Bracket | Male | Female |
| Under 5 Years | 1,478 (92.3%) | 1,771 (97.8%) |
| 5 Years | 386 (100.0%) | 229 (89.1%) |
| 6 to 11 Years | 1,794 (96.6%) | 1,784 (89.9%) |
| 12 to 14 Years | 822 (92.8%) | 949 (97.3%) |
| 15 Years | 352 (92.4%) | 313 (97.8%) |
| 16 and 17 Years | 688 (93.5%) | 585 (90.1%) |
| 18 to 24 Years | 2,310 (97.8%) | 1,473 (89.9%) |
| 25 to 34 Years | 3,600 (93.0%) | 3,215 (90.8%) |
| 35 to 44 Years | 3,279 (97.1%) | 3,304 (96.4%) |
| 45 to 54 Years | 3,439 (97.1%) | 3,890 (95.5%) |
| 55 to 64 Years | 3,414 (98.8%) | 3,408 (96.5%) |
| 65 to 74 Years | 2,302 (97.1%) | 2,222 (96.1%) |
| 75 Years and over | 880 (94.1%) | 1,058 (92.1%) |
| Total | 24,744 (96.1%) | 24,201 (94.3%) |
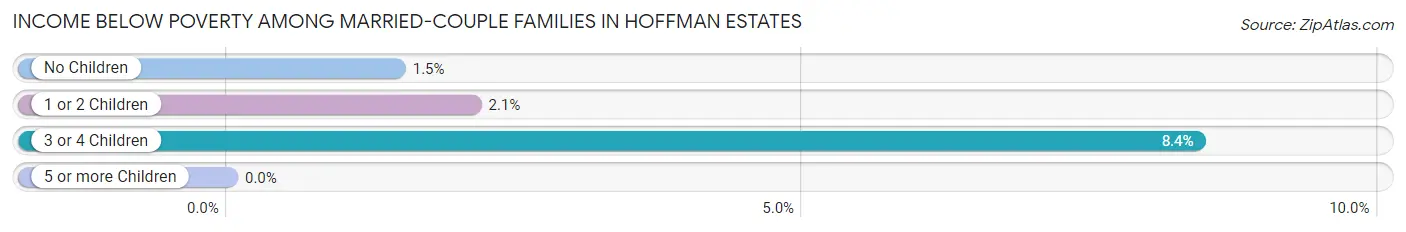
Income Below Poverty Among Married-Couple Families in Hoffman Estates
The poverty statistics for married-couple families in Hoffman Estates show that 2.1% or 238 of the total 11,406 families live below the poverty line. Families with 3 or 4 children have the highest poverty rate of 8.4%, comprising of 49 families. On the other hand, families with no children have the lowest poverty rate of 1.5%, which includes 89 families.
| Children | Above Poverty | Below Poverty |
| No Children | 6,021 (98.5%) | 89 (1.5%) |
| 1 or 2 Children | 4,614 (97.9%) | 100 (2.1%) |
| 3 or 4 Children | 533 (91.6%) | 49 (8.4%) |
| 5 or more Children | 0 (0.0%) | 0 (0.0%) |
| Total | 11,168 (97.9%) | 238 (2.1%) |
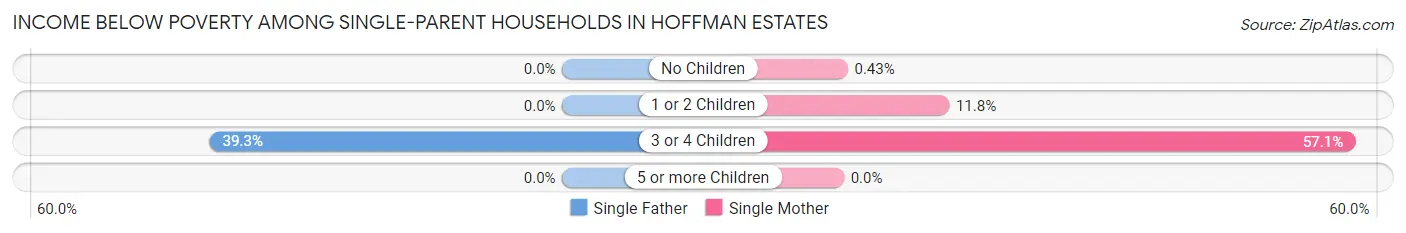
Income Below Poverty Among Single-Parent Households in Hoffman Estates
According to the poverty data in Hoffman Estates, 5.3% or 35 single-father households and 7.8% or 178 single-mother households are living below the poverty line. Among single-father households, those with 3 or 4 children have the highest poverty rate, with 35 households (39.3%) experiencing poverty. Likewise, among single-mother households, those with 3 or 4 children have the highest poverty rate, with 52 households (57.1%) falling below the poverty line.
| Children | Single Father | Single Mother |
| No Children | 0 (0.0%) | 5 (0.4%) |
| 1 or 2 Children | 0 (0.0%) | 121 (11.8%) |
| 3 or 4 Children | 35 (39.3%) | 52 (57.1%) |
| 5 or more Children | 0 (0.0%) | 0 (0.0%) |
| Total | 35 (5.3%) | 178 (7.8%) |
Income Below Poverty Among Married-Couple vs Single-Parent Households in Hoffman Estates
The poverty data for Hoffman Estates shows that 238 of the married-couple family households (2.1%) and 213 of the single-parent households (7.3%) are living below the poverty level. Within the married-couple family households, those with 3 or 4 children have the highest poverty rate, with 49 households (8.4%) falling below the poverty line. Among the single-parent households, those with 3 or 4 children have the highest poverty rate, with 87 household (48.3%) living below poverty.
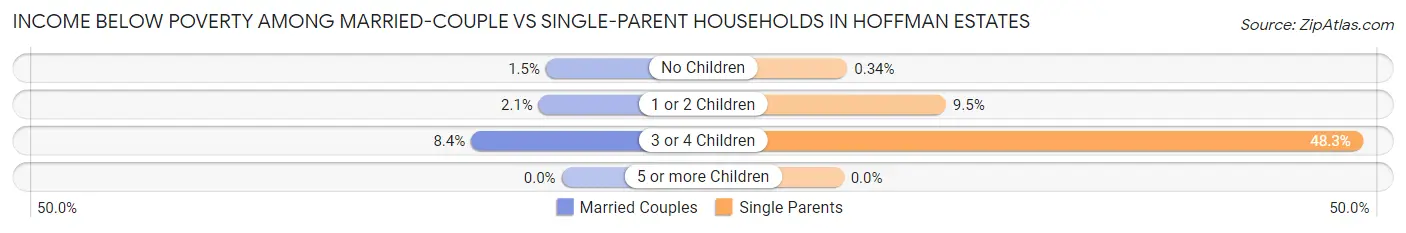
| Children | Married-Couple Families | Single-Parent Households |
| No Children | 89 (1.5%) | 5 (0.3%) |
| 1 or 2 Children | 100 (2.1%) | 121 (9.5%) |
| 3 or 4 Children | 49 (8.4%) | 87 (48.3%) |
| 5 or more Children | 0 (0.0%) | 0 (0.0%) |
| Total | 238 (2.1%) | 213 (7.3%) |
Employment Characteristics in Hoffman Estates
Employment by Class of Employer in Hoffman Estates
Among the 27,764 employed individuals in Hoffman Estates, private company employees (21,526 | 77.5%), not-for-profit organizations (1,597 | 5.8%), and local government employees (1,388 | 5.0%) make up the most common classes of employment.
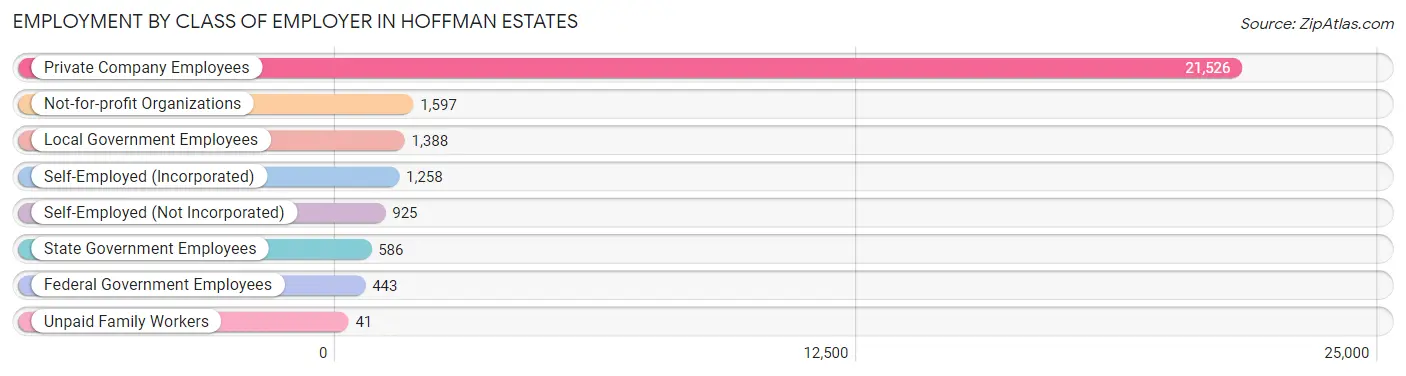
| Employer Class | # Employees | % Employees |
| Private Company Employees | 21,526 | 77.5% |
| Self-Employed (Incorporated) | 1,258 | 4.5% |
| Self-Employed (Not Incorporated) | 925 | 3.3% |
| Not-for-profit Organizations | 1,597 | 5.8% |
| Local Government Employees | 1,388 | 5.0% |
| State Government Employees | 586 | 2.1% |
| Federal Government Employees | 443 | 1.6% |
| Unpaid Family Workers | 41 | 0.2% |
| Total | 27,764 | 100.0% |
Employment Status by Age in Hoffman Estates
According to the labor force statistics for Hoffman Estates, out of the total population over 16 years of age (41,164), 71.7% or 29,515 individuals are in the labor force, with 3.7% or 1,092 of them unemployed. The age group with the highest labor force participation rate is 35 to 44 years, with 89.8% or 6,111 individuals in the labor force. Within the labor force, the 16 to 19 years age range has the highest percentage of unemployed individuals, with 21.5% or 139 of them being unemployed.
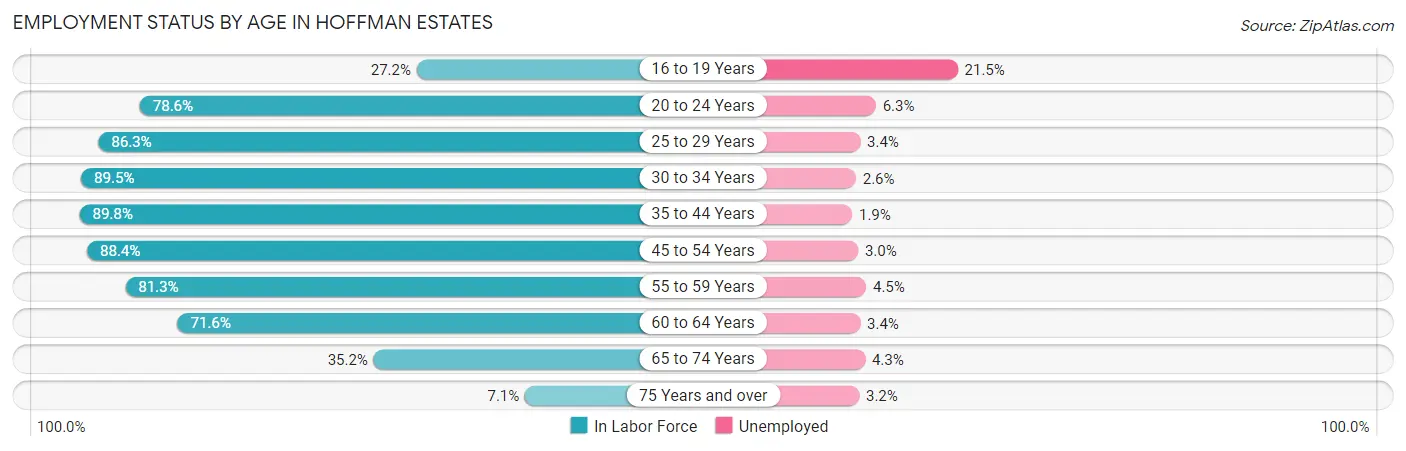
| Age Bracket | In Labor Force | Unemployed |
| 16 to 19 Years | 647 (27.2%) | 139 (21.5%) |
| 20 to 24 Years | 2,364 (78.6%) | 149 (6.3%) |
| 25 to 29 Years | 3,342 (86.3%) | 114 (3.4%) |
| 30 to 34 Years | 3,166 (89.5%) | 82 (2.6%) |
| 35 to 44 Years | 6,111 (89.8%) | 116 (1.9%) |
| 45 to 54 Years | 6,739 (88.4%) | 202 (3.0%) |
| 55 to 59 Years | 2,681 (81.3%) | 121 (4.5%) |
| 60 to 64 Years | 2,668 (71.6%) | 91 (3.4%) |
| 65 to 74 Years | 1,662 (35.2%) | 71 (4.3%) |
| 75 Years and over | 156 (7.1%) | 5 (3.2%) |
| Total | 29,515 (71.7%) | 1,092 (3.7%) |
Employment Status by Educational Attainment in Hoffman Estates
According to labor force statistics for Hoffman Estates, 85.6% of individuals (24,705) out of the total population between 25 and 64 years of age (28,861) are in the labor force, with 2.9% or 716 of them being unemployed. The group with the highest labor force participation rate are those with the educational attainment of bachelor's degree or higher, with 90.7% or 13,278 individuals in the labor force. Within the labor force, individuals with high school diploma education have the highest percentage of unemployment, with 5.3% or 175 of them being unemployed.
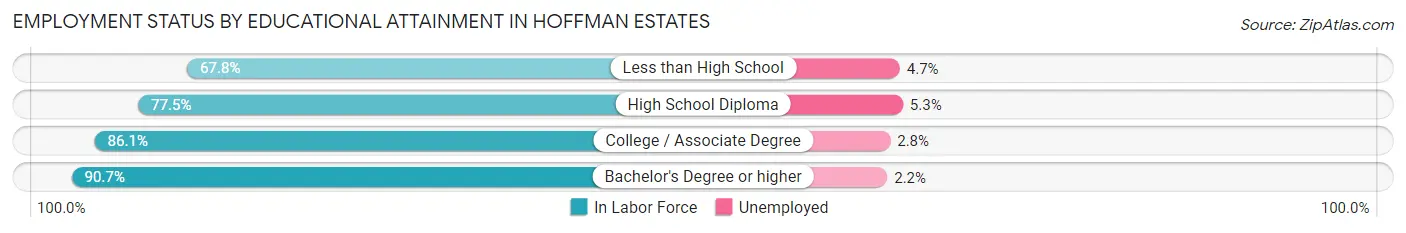
| Educational Attainment | In Labor Force | Unemployed |
| Less than High School | 1,677 (67.8%) | 116 (4.7%) |
| High School Diploma | 3,298 (77.5%) | 226 (5.3%) |
| College / Associate Degree | 6,450 (86.1%) | 210 (2.8%) |
| Bachelor's Degree or higher | 13,278 (90.7%) | 322 (2.2%) |
| Total | 24,705 (85.6%) | 837 (2.9%) |
Employment Occupations by Sex in Hoffman Estates
Management, Business, Science and Arts Occupations
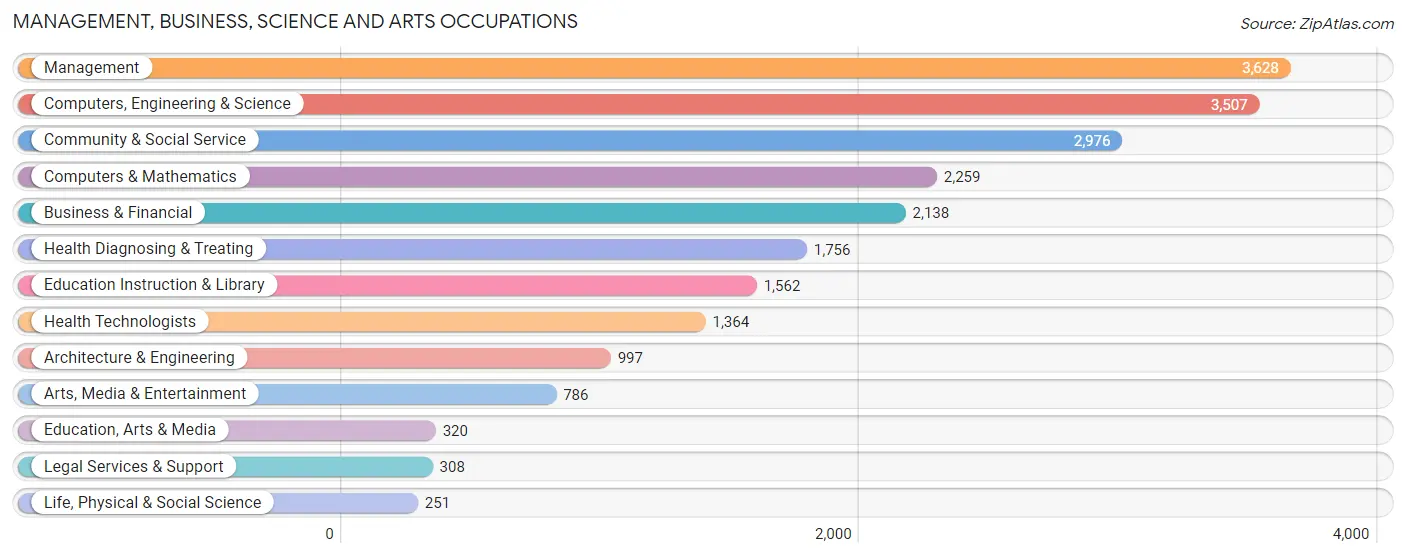
The most common Management, Business, Science and Arts occupations in Hoffman Estates are Management (3,628 | 12.8%), Computers, Engineering & Science (3,507 | 12.3%), Community & Social Service (2,976 | 10.5%), Computers & Mathematics (2,259 | 7.9%), and Business & Financial (2,138 | 7.5%).
Management, Business, Science and Arts Occupations by Sex
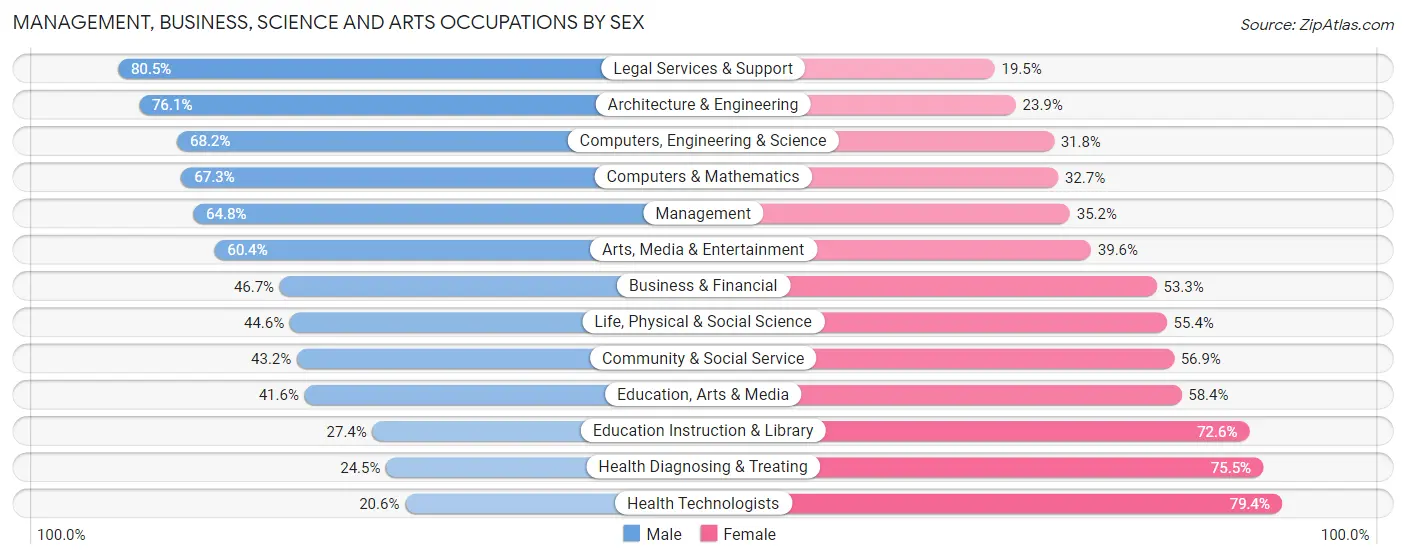
Within the Management, Business, Science and Arts occupations in Hoffman Estates, the most male-oriented occupations are Legal Services & Support (80.5%), Architecture & Engineering (76.1%), and Computers, Engineering & Science (68.2%), while the most female-oriented occupations are Health Technologists (79.4%), Health Diagnosing & Treating (75.5%), and Education Instruction & Library (72.6%).
| Occupation | Male | Female |
| Management | 2,352 (64.8%) | 1,276 (35.2%) |
| Business & Financial | 999 (46.7%) | 1,139 (53.3%) |
| Computers, Engineering & Science | 2,391 (68.2%) | 1,116 (31.8%) |
| Computers & Mathematics | 1,520 (67.3%) | 739 (32.7%) |
| Architecture & Engineering | 759 (76.1%) | 238 (23.9%) |
| Life, Physical & Social Science | 112 (44.6%) | 139 (55.4%) |
| Community & Social Service | 1,284 (43.1%) | 1,692 (56.9%) |
| Education, Arts & Media | 133 (41.6%) | 187 (58.4%) |
| Legal Services & Support | 248 (80.5%) | 60 (19.5%) |
| Education Instruction & Library | 428 (27.4%) | 1,134 (72.6%) |
| Arts, Media & Entertainment | 475 (60.4%) | 311 (39.6%) |
| Health Diagnosing & Treating | 431 (24.5%) | 1,325 (75.5%) |
| Health Technologists | 281 (20.6%) | 1,083 (79.4%) |
| Total (Category) | 7,457 (53.2%) | 6,548 (46.8%) |
| Total (Overall) | 15,433 (54.3%) | 13,002 (45.7%) |
Services Occupations
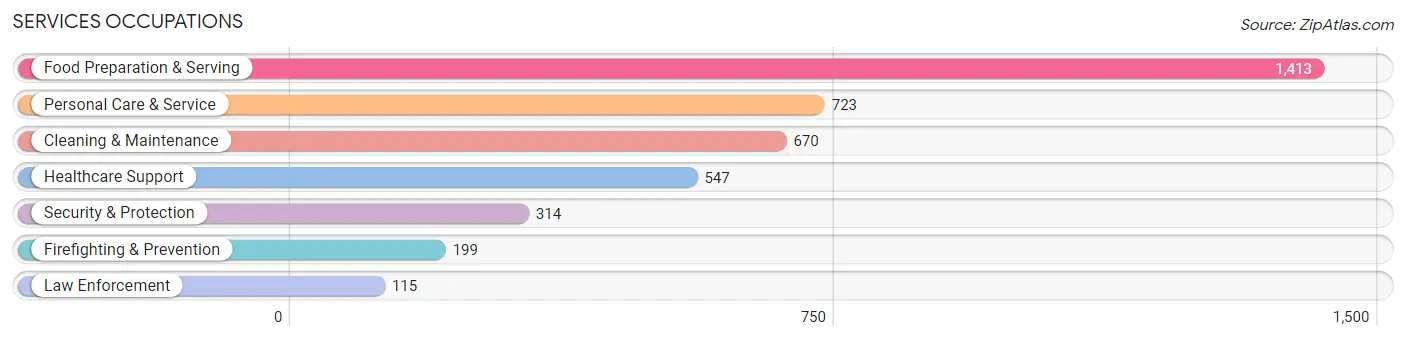
The most common Services occupations in Hoffman Estates are Food Preparation & Serving (1,413 | 5.0%), Personal Care & Service (723 | 2.5%), Cleaning & Maintenance (670 | 2.4%), Healthcare Support (547 | 1.9%), and Security & Protection (314 | 1.1%).
Services Occupations by Sex
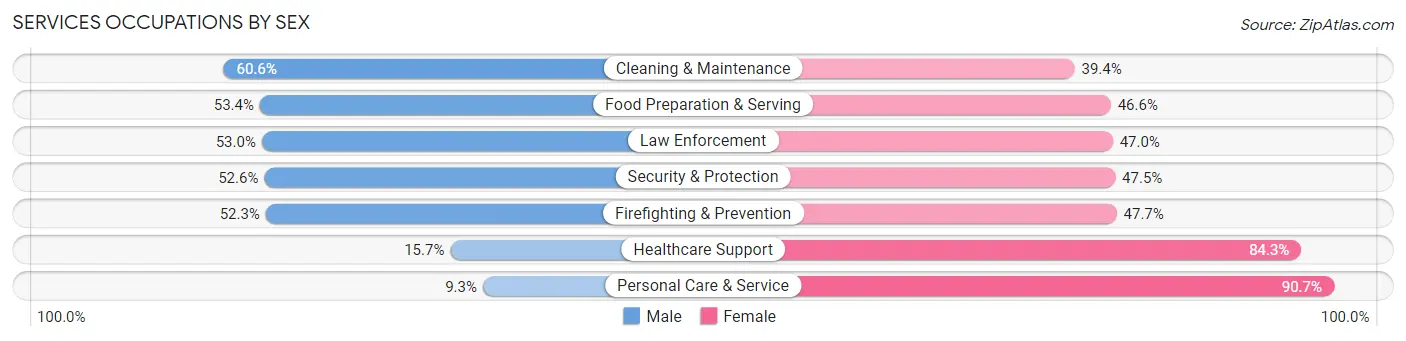
Within the Services occupations in Hoffman Estates, the most male-oriented occupations are Cleaning & Maintenance (60.6%), Food Preparation & Serving (53.4%), and Law Enforcement (53.0%), while the most female-oriented occupations are Personal Care & Service (90.7%), Healthcare Support (84.3%), and Firefighting & Prevention (47.7%).
| Occupation | Male | Female |
| Healthcare Support | 86 (15.7%) | 461 (84.3%) |
| Security & Protection | 165 (52.5%) | 149 (47.4%) |
| Firefighting & Prevention | 104 (52.3%) | 95 (47.7%) |
| Law Enforcement | 61 (53.0%) | 54 (47.0%) |
| Food Preparation & Serving | 755 (53.4%) | 658 (46.6%) |
| Cleaning & Maintenance | 406 (60.6%) | 264 (39.4%) |
| Personal Care & Service | 67 (9.3%) | 656 (90.7%) |
| Total (Category) | 1,479 (40.3%) | 2,188 (59.7%) |
| Total (Overall) | 15,433 (54.3%) | 13,002 (45.7%) |
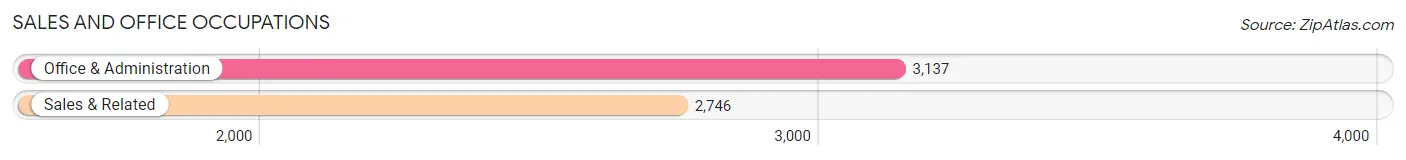
Sales and Office Occupations
The most common Sales and Office occupations in Hoffman Estates are Office & Administration (3,137 | 11.0%), and Sales & Related (2,746 | 9.7%).
Sales and Office Occupations by Sex
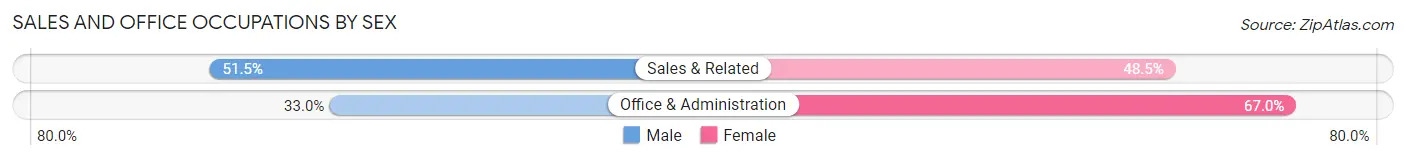
| Occupation | Male | Female |
| Sales & Related | 1,415 (51.5%) | 1,331 (48.5%) |
| Office & Administration | 1,035 (33.0%) | 2,102 (67.0%) |
| Total (Category) | 2,450 (41.6%) | 3,433 (58.4%) |
| Total (Overall) | 15,433 (54.3%) | 13,002 (45.7%) |
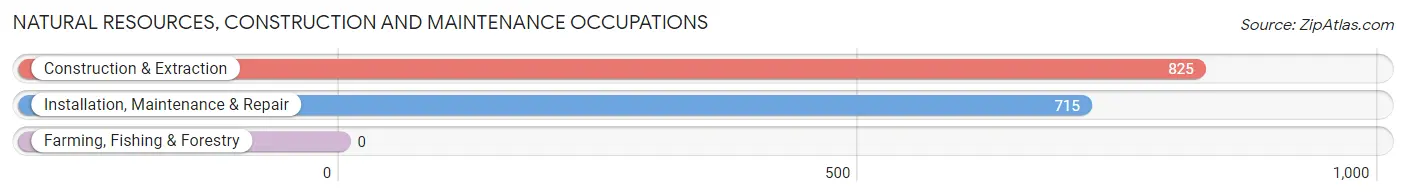
Natural Resources, Construction and Maintenance Occupations
The most common Natural Resources, Construction and Maintenance occupations in Hoffman Estates are Construction & Extraction (825 | 2.9%), and Installation, Maintenance & Repair (715 | 2.5%).
Natural Resources, Construction and Maintenance Occupations by Sex
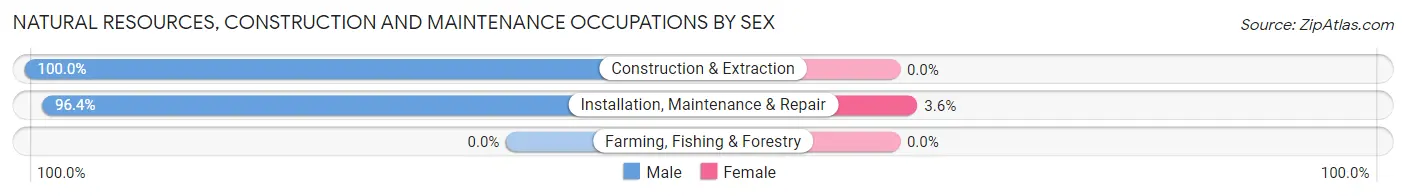
| Occupation | Male | Female |
| Farming, Fishing & Forestry | 0 (0.0%) | 0 (0.0%) |
| Construction & Extraction | 825 (100.0%) | 0 (0.0%) |
| Installation, Maintenance & Repair | 689 (96.4%) | 26 (3.6%) |
| Total (Category) | 1,514 (98.3%) | 26 (1.7%) |
| Total (Overall) | 15,433 (54.3%) | 13,002 (45.7%) |
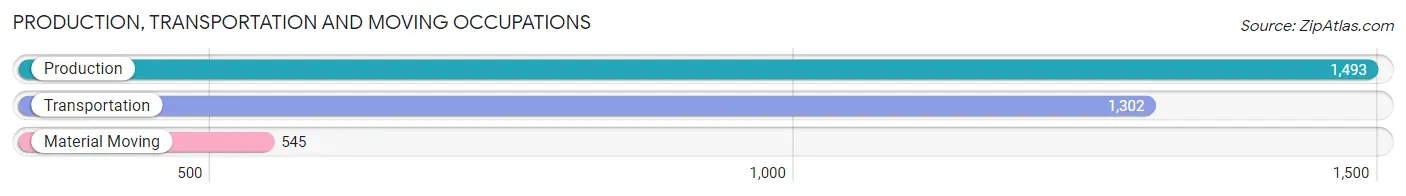
Production, Transportation and Moving Occupations
The most common Production, Transportation and Moving occupations in Hoffman Estates are Production (1,493 | 5.2%), Transportation (1,302 | 4.6%), and Material Moving (545 | 1.9%).
Production, Transportation and Moving Occupations by Sex
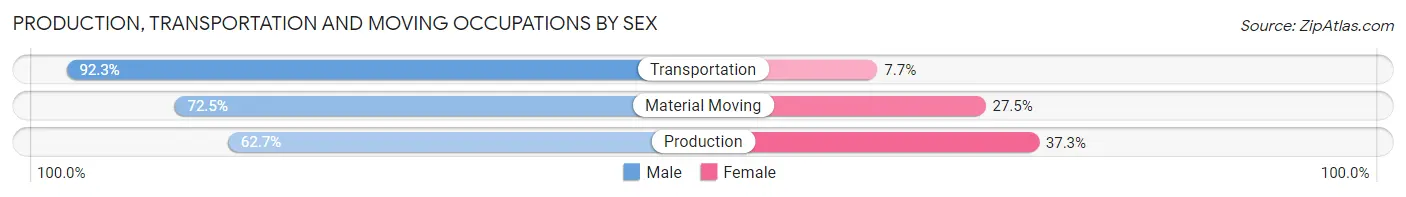
| Occupation | Male | Female |
| Production | 936 (62.7%) | 557 (37.3%) |
| Transportation | 1,202 (92.3%) | 100 (7.7%) |
| Material Moving | 395 (72.5%) | 150 (27.5%) |
| Total (Category) | 2,533 (75.8%) | 807 (24.2%) |
| Total (Overall) | 15,433 (54.3%) | 13,002 (45.7%) |
Employment Industries by Sex in Hoffman Estates
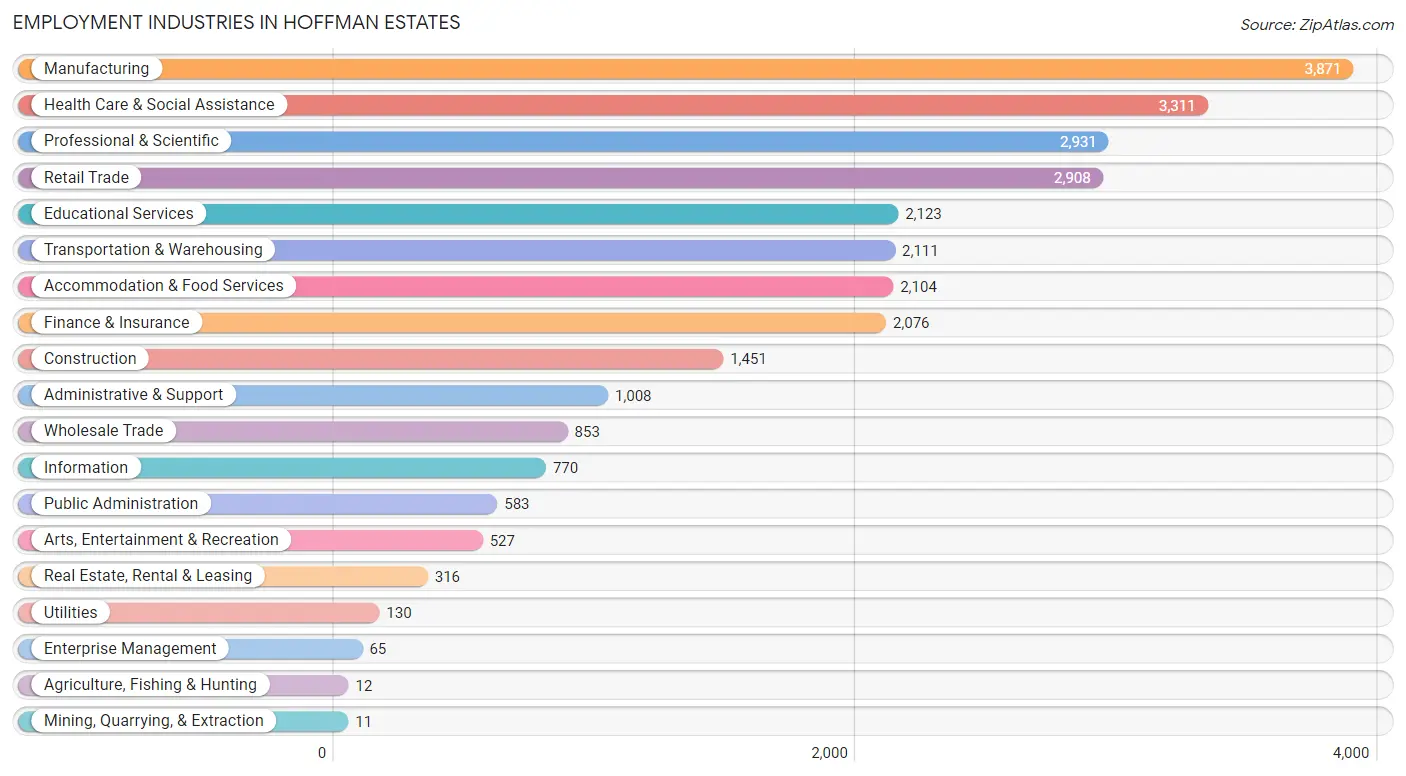
Employment Industries in Hoffman Estates
The major employment industries in Hoffman Estates include Manufacturing (3,871 | 13.6%), Health Care & Social Assistance (3,311 | 11.6%), Professional & Scientific (2,931 | 10.3%), Retail Trade (2,908 | 10.2%), and Educational Services (2,123 | 7.5%).
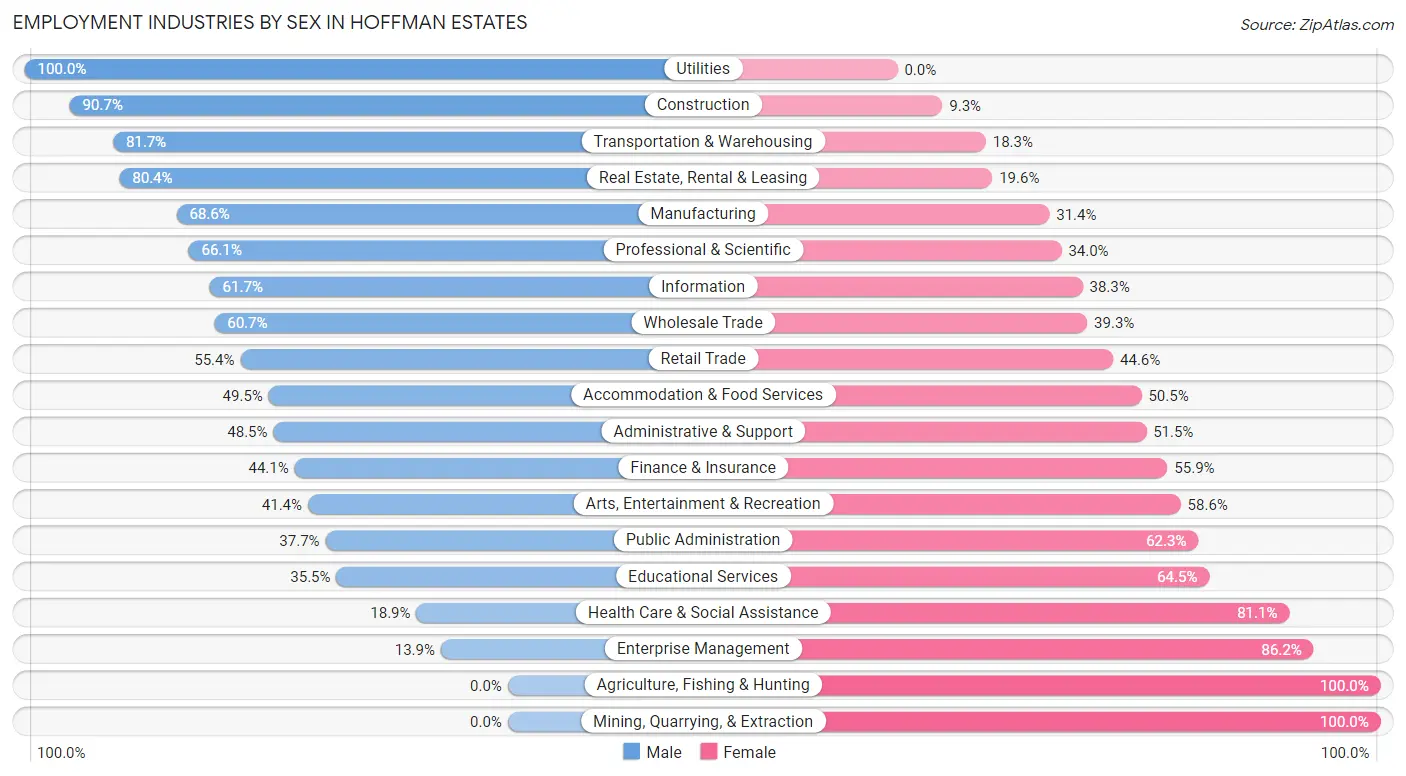
Employment Industries by Sex in Hoffman Estates
The Hoffman Estates industries that see more men than women are Utilities (100.0%), Construction (90.7%), and Transportation & Warehousing (81.7%), whereas the industries that tend to have a higher number of women are Agriculture, Fishing & Hunting (100.0%), Mining, Quarrying, & Extraction (100.0%), and Enterprise Management (86.2%).
| Industry | Male | Female |
| Agriculture, Fishing & Hunting | 0 (0.0%) | 12 (100.0%) |
| Mining, Quarrying, & Extraction | 0 (0.0%) | 11 (100.0%) |
| Construction | 1,316 (90.7%) | 135 (9.3%) |
| Manufacturing | 2,654 (68.6%) | 1,217 (31.4%) |
| Wholesale Trade | 518 (60.7%) | 335 (39.3%) |
| Retail Trade | 1,610 (55.4%) | 1,298 (44.6%) |
| Transportation & Warehousing | 1,725 (81.7%) | 386 (18.3%) |
| Utilities | 130 (100.0%) | 0 (0.0%) |
| Information | 475 (61.7%) | 295 (38.3%) |
| Finance & Insurance | 916 (44.1%) | 1,160 (55.9%) |
| Real Estate, Rental & Leasing | 254 (80.4%) | 62 (19.6%) |
| Professional & Scientific | 1,936 (66.0%) | 995 (34.0%) |
| Enterprise Management | 9 (13.9%) | 56 (86.2%) |
| Administrative & Support | 489 (48.5%) | 519 (51.5%) |
| Educational Services | 753 (35.5%) | 1,370 (64.5%) |
| Health Care & Social Assistance | 626 (18.9%) | 2,685 (81.1%) |
| Arts, Entertainment & Recreation | 218 (41.4%) | 309 (58.6%) |
| Accommodation & Food Services | 1,041 (49.5%) | 1,063 (50.5%) |
| Public Administration | 220 (37.7%) | 363 (62.3%) |
| Total | 15,433 (54.3%) | 13,002 (45.7%) |
Education in Hoffman Estates
School Enrollment in Hoffman Estates
The most common levels of schooling among the 12,073 students in Hoffman Estates are high school (3,105 | 25.7%), middle school (2,607 | 21.6%), and elementary school (2,592 | 21.5%).
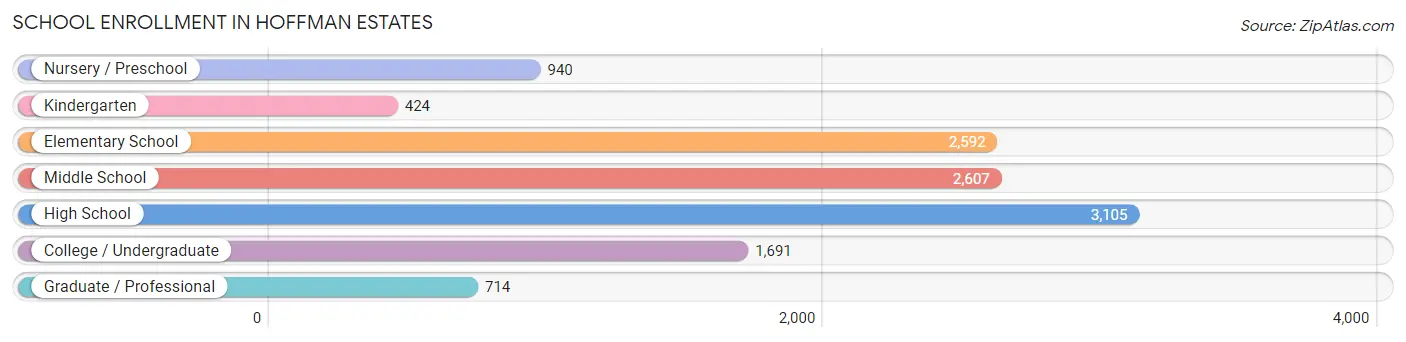
| School Level | # Students | % Students |
| Nursery / Preschool | 940 | 7.8% |
| Kindergarten | 424 | 3.5% |
| Elementary School | 2,592 | 21.5% |
| Middle School | 2,607 | 21.6% |
| High School | 3,105 | 25.7% |
| College / Undergraduate | 1,691 | 14.0% |
| Graduate / Professional | 714 | 5.9% |
| Total | 12,073 | 100.0% |
School Enrollment by Age by Funding Source in Hoffman Estates
Out of a total of 12,073 students who are enrolled in schools in Hoffman Estates, 1,606 (13.3%) attend a private institution, while the remaining 10,467 (86.7%) are enrolled in public schools. The age group of 3 to 4 year olds has the highest likelihood of being enrolled in private schools, with 281 (41.3% in the age bracket) enrolled. Conversely, the age group of 15 to 17 year olds has the lowest likelihood of being enrolled in a private school, with 2,019 (96.8% in the age bracket) attending a public institution.
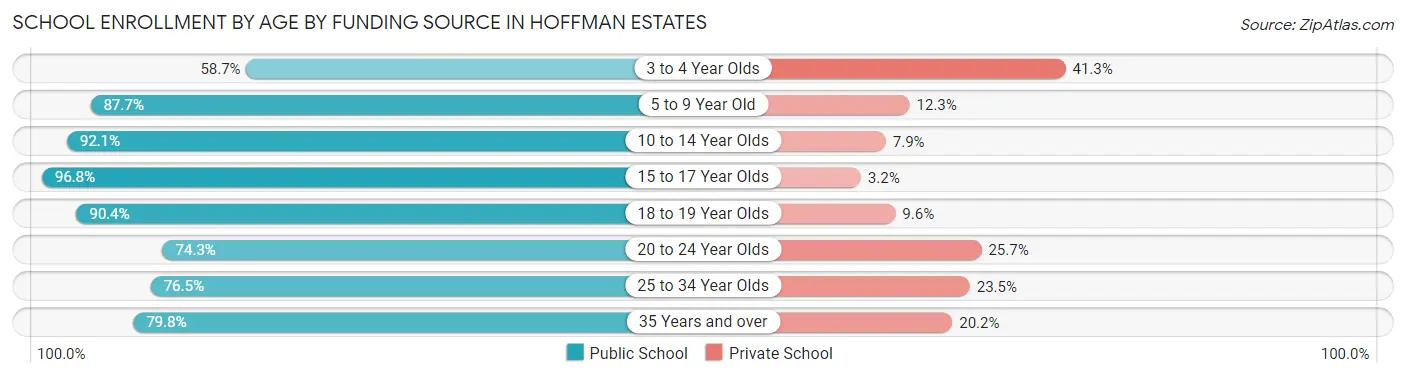
| Age Bracket | Public School | Private School |
| 3 to 4 Year Olds | 399 (58.7%) | 281 (41.3%) |
| 5 to 9 Year Old | 2,735 (87.7%) | 383 (12.3%) |
| 10 to 14 Year Olds | 2,837 (92.1%) | 242 (7.9%) |
| 15 to 17 Year Olds | 2,019 (96.8%) | 67 (3.2%) |
| 18 to 19 Year Olds | 750 (90.4%) | 80 (9.6%) |
| 20 to 24 Year Olds | 857 (74.3%) | 296 (25.7%) |
| 25 to 34 Year Olds | 537 (76.5%) | 165 (23.5%) |
| 35 Years and over | 339 (79.8%) | 86 (20.2%) |
| Total | 10,467 (86.7%) | 1,606 (13.3%) |
Educational Attainment by Field of Study in Hoffman Estates
Business (4,584 | 24.5%), engineering (2,879 | 15.4%), education (1,647 | 8.8%), science & technology (1,514 | 8.1%), and computers & mathematics (1,362 | 7.3%) are the most common fields of study among 18,675 individuals in Hoffman Estates who have obtained a bachelor's degree or higher.
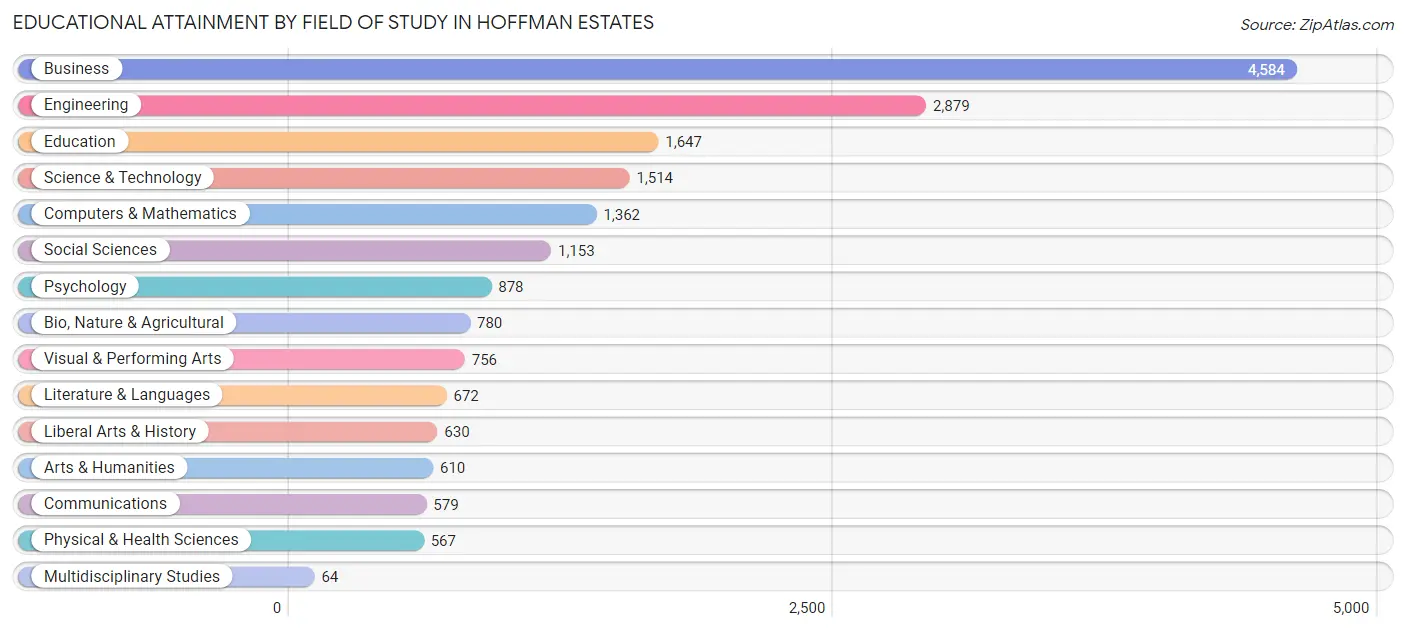
| Field of Study | # Graduates | % Graduates |
| Computers & Mathematics | 1,362 | 7.3% |
| Bio, Nature & Agricultural | 780 | 4.2% |
| Physical & Health Sciences | 567 | 3.0% |
| Psychology | 878 | 4.7% |
| Social Sciences | 1,153 | 6.2% |
| Engineering | 2,879 | 15.4% |
| Multidisciplinary Studies | 64 | 0.3% |
| Science & Technology | 1,514 | 8.1% |
| Business | 4,584 | 24.5% |
| Education | 1,647 | 8.8% |
| Literature & Languages | 672 | 3.6% |
| Liberal Arts & History | 630 | 3.4% |
| Visual & Performing Arts | 756 | 4.1% |
| Communications | 579 | 3.1% |
| Arts & Humanities | 610 | 3.3% |
| Total | 18,675 | 100.0% |
Transportation & Commute in Hoffman Estates
Vehicle Availability by Sex in Hoffman Estates
The most prevalent vehicle ownership categories in Hoffman Estates are males with 2 vehicles (7,779, accounting for 51.4%) and females with 2 vehicles (6,356, making up 61.5%).
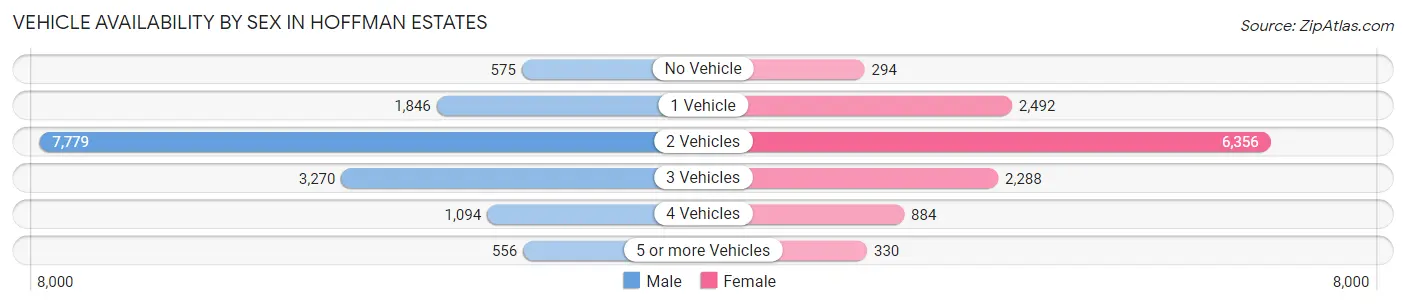
| Vehicles Available | Male | Female |
| No Vehicle | 575 (3.8%) | 294 (2.3%) |
| 1 Vehicle | 1,846 (12.2%) | 2,492 (19.7%) |
| 2 Vehicles | 7,779 (51.4%) | 6,356 (50.3%) |
| 3 Vehicles | 3,270 (21.6%) | 2,288 (18.1%) |
| 4 Vehicles | 1,094 (7.2%) | 884 (7.0%) |
| 5 or more Vehicles | 556 (3.7%) | 330 (2.6%) |
| Total | 15,120 (100.0%) | 12,644 (100.0%) |
Commute Time in Hoffman Estates
The most frequently occuring commute durations in Hoffman Estates are 15 to 19 minutes (3,950 commuters, 16.6%), 30 to 34 minutes (3,467 commuters, 14.5%), and 20 to 24 minutes (3,226 commuters, 13.5%).
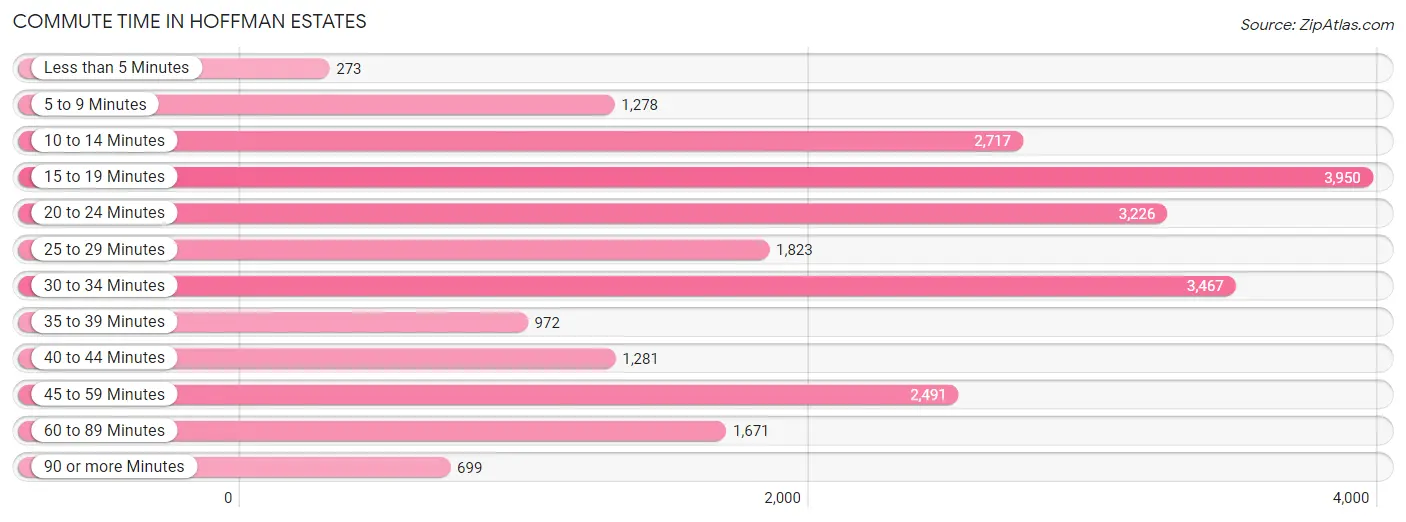
| Commute Time | # Commuters | % Commuters |
| Less than 5 Minutes | 273 | 1.1% |
| 5 to 9 Minutes | 1,278 | 5.4% |
| 10 to 14 Minutes | 2,717 | 11.4% |
| 15 to 19 Minutes | 3,950 | 16.6% |
| 20 to 24 Minutes | 3,226 | 13.5% |
| 25 to 29 Minutes | 1,823 | 7.6% |
| 30 to 34 Minutes | 3,467 | 14.5% |
| 35 to 39 Minutes | 972 | 4.1% |
| 40 to 44 Minutes | 1,281 | 5.4% |
| 45 to 59 Minutes | 2,491 | 10.4% |
| 60 to 89 Minutes | 1,671 | 7.0% |
| 90 or more Minutes | 699 | 2.9% |
Commute Time by Sex in Hoffman Estates
The most common commute times in Hoffman Estates are 30 to 34 minutes (2,132 commuters, 16.1%) for males and 15 to 19 minutes (2,250 commuters, 21.3%) for females.
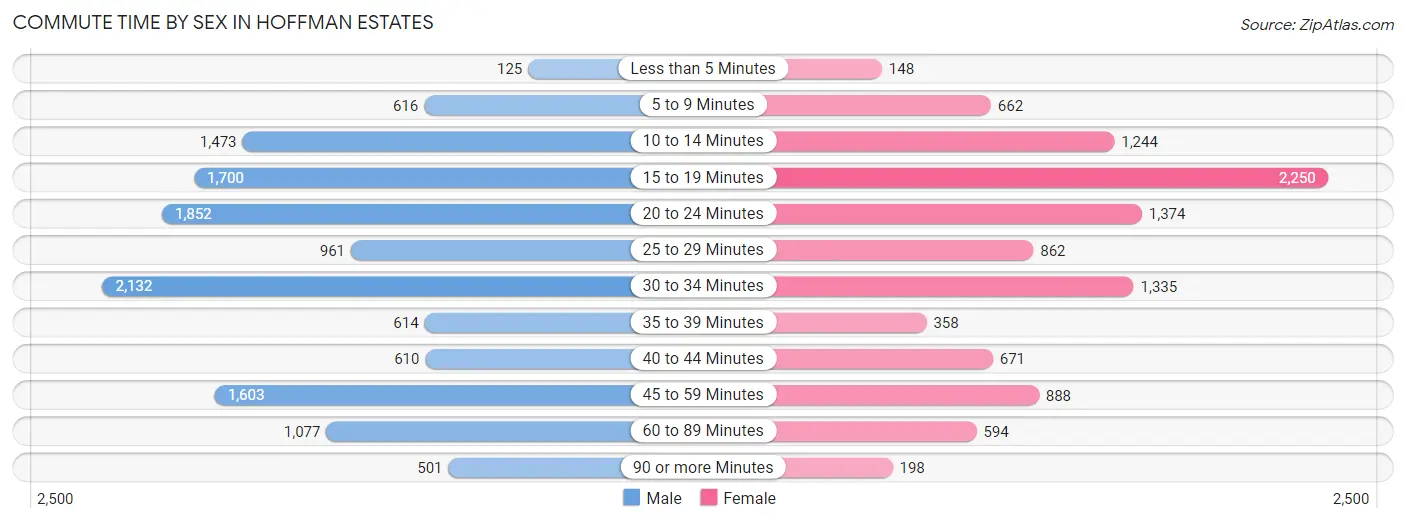
| Commute Time | Male | Female |
| Less than 5 Minutes | 125 (0.9%) | 148 (1.4%) |
| 5 to 9 Minutes | 616 (4.6%) | 662 (6.2%) |
| 10 to 14 Minutes | 1,473 (11.1%) | 1,244 (11.7%) |
| 15 to 19 Minutes | 1,700 (12.8%) | 2,250 (21.3%) |
| 20 to 24 Minutes | 1,852 (14.0%) | 1,374 (13.0%) |
| 25 to 29 Minutes | 961 (7.2%) | 862 (8.1%) |
| 30 to 34 Minutes | 2,132 (16.1%) | 1,335 (12.6%) |
| 35 to 39 Minutes | 614 (4.6%) | 358 (3.4%) |
| 40 to 44 Minutes | 610 (4.6%) | 671 (6.3%) |
| 45 to 59 Minutes | 1,603 (12.1%) | 888 (8.4%) |
| 60 to 89 Minutes | 1,077 (8.1%) | 594 (5.6%) |
| 90 or more Minutes | 501 (3.8%) | 198 (1.9%) |
Time of Departure to Work by Sex in Hoffman Estates
The most frequent times of departure to work in Hoffman Estates are 7:00 AM to 7:29 AM (2,058, 15.5%) for males and 7:00 AM to 7:29 AM (1,490, 14.1%) for females.
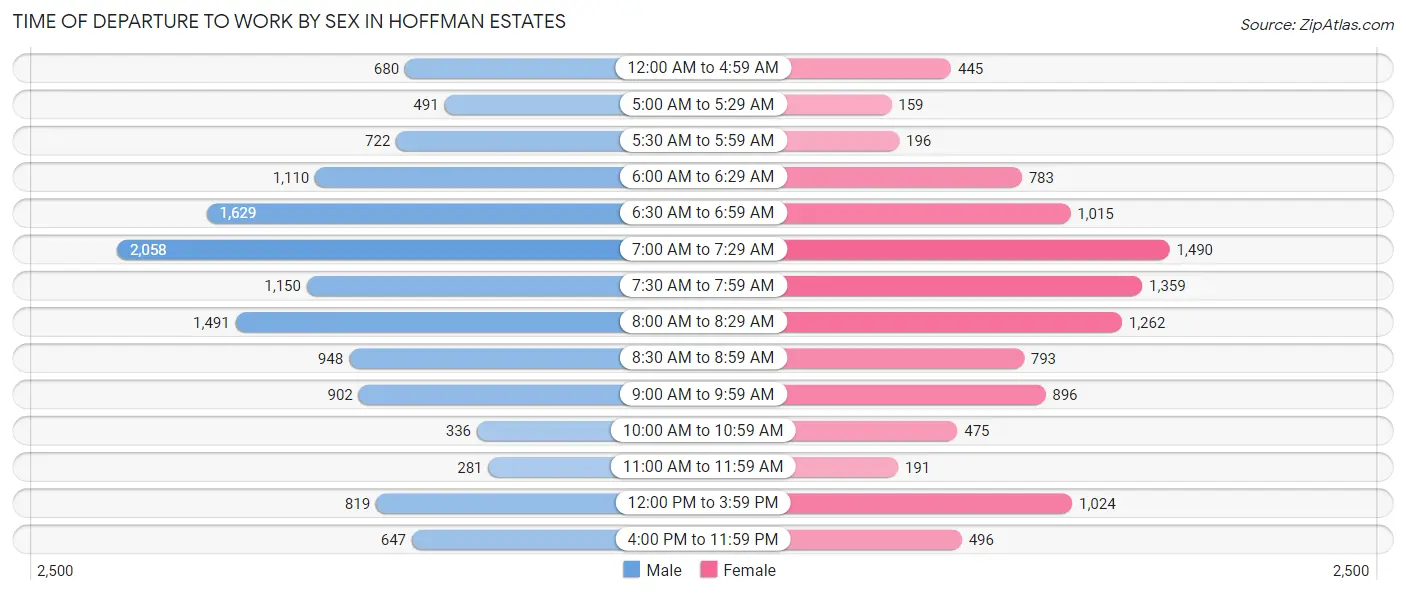
| Time of Departure | Male | Female |
| 12:00 AM to 4:59 AM | 680 (5.1%) | 445 (4.2%) |
| 5:00 AM to 5:29 AM | 491 (3.7%) | 159 (1.5%) |
| 5:30 AM to 5:59 AM | 722 (5.4%) | 196 (1.8%) |
| 6:00 AM to 6:29 AM | 1,110 (8.4%) | 783 (7.4%) |
| 6:30 AM to 6:59 AM | 1,629 (12.3%) | 1,015 (9.6%) |
| 7:00 AM to 7:29 AM | 2,058 (15.5%) | 1,490 (14.1%) |
| 7:30 AM to 7:59 AM | 1,150 (8.7%) | 1,359 (12.8%) |
| 8:00 AM to 8:29 AM | 1,491 (11.2%) | 1,262 (11.9%) |
| 8:30 AM to 8:59 AM | 948 (7.1%) | 793 (7.5%) |
| 9:00 AM to 9:59 AM | 902 (6.8%) | 896 (8.5%) |
| 10:00 AM to 10:59 AM | 336 (2.5%) | 475 (4.5%) |
| 11:00 AM to 11:59 AM | 281 (2.1%) | 191 (1.8%) |
| 12:00 PM to 3:59 PM | 819 (6.2%) | 1,024 (9.7%) |
| 4:00 PM to 11:59 PM | 647 (4.9%) | 496 (4.7%) |
| Total | 13,264 (100.0%) | 10,584 (100.0%) |
Housing Occupancy in Hoffman Estates
Occupancy by Ownership in Hoffman Estates
Of the total 18,372 dwellings in Hoffman Estates, owner-occupied units account for 13,604 (74.1%), while renter-occupied units make up 4,768 (26.0%).
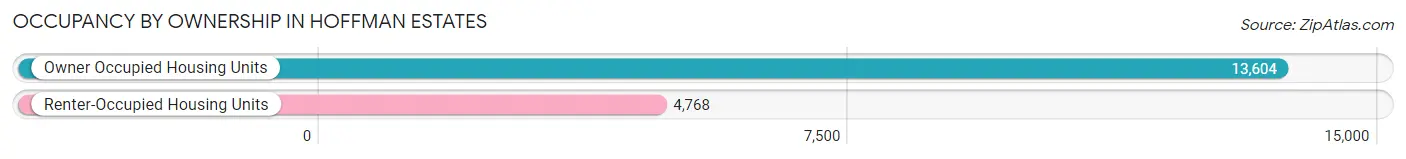
| Occupancy | # Housing Units | % Housing Units |
| Owner Occupied Housing Units | 13,604 | 74.1% |
| Renter-Occupied Housing Units | 4,768 | 26.0% |
| Total Occupied Housing Units | 18,372 | 100.0% |
Occupancy by Household Size in Hoffman Estates
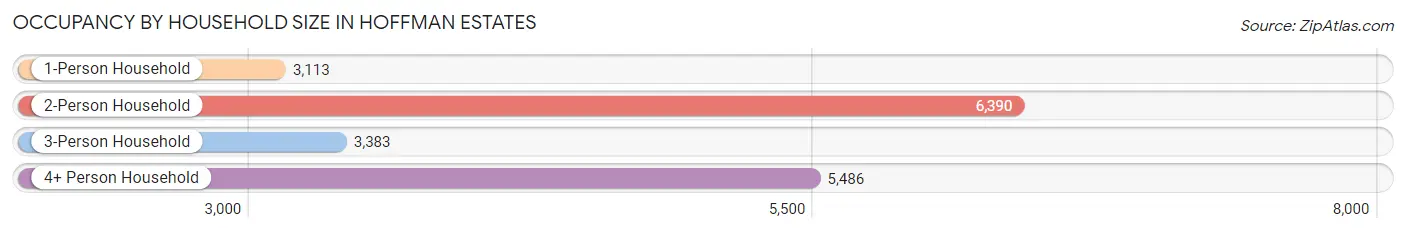
| Household Size | # Housing Units | % Housing Units |
| 1-Person Household | 3,113 | 16.9% |
| 2-Person Household | 6,390 | 34.8% |
| 3-Person Household | 3,383 | 18.4% |
| 4+ Person Household | 5,486 | 29.9% |
| Total Housing Units | 18,372 | 100.0% |
Occupancy by Ownership by Household Size in Hoffman Estates
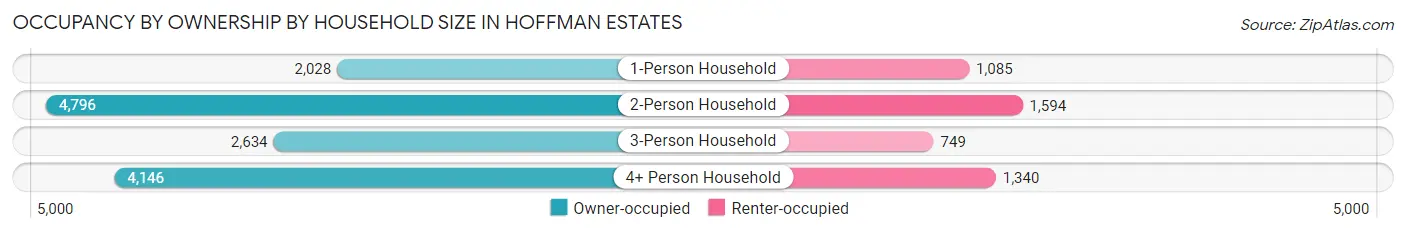
| Household Size | Owner-occupied | Renter-occupied |
| 1-Person Household | 2,028 (65.1%) | 1,085 (34.8%) |
| 2-Person Household | 4,796 (75.0%) | 1,594 (24.9%) |
| 3-Person Household | 2,634 (77.9%) | 749 (22.1%) |
| 4+ Person Household | 4,146 (75.6%) | 1,340 (24.4%) |
| Total Housing Units | 13,604 (74.1%) | 4,768 (26.0%) |
Occupancy by Educational Attainment in Hoffman Estates
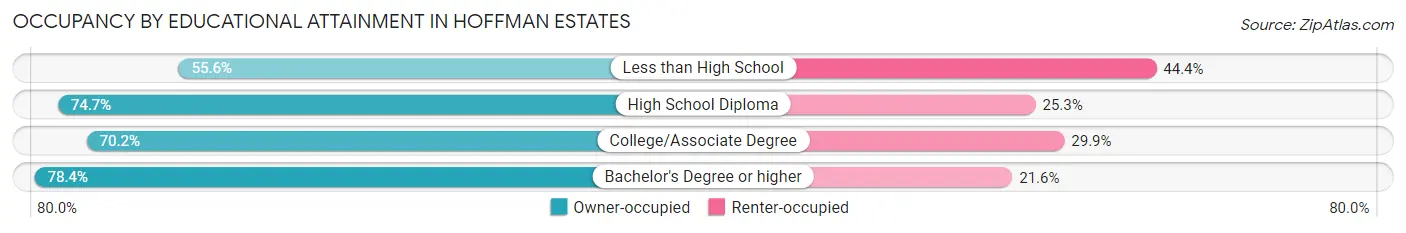
| Household Size | Owner-occupied | Renter-occupied |
| Less than High School | 750 (55.6%) | 600 (44.4%) |
| High School Diploma | 1,694 (74.7%) | 573 (25.3%) |
| College/Associate Degree | 3,473 (70.2%) | 1,478 (29.8%) |
| Bachelor's Degree or higher | 7,687 (78.4%) | 2,117 (21.6%) |
Occupancy by Age of Householder in Hoffman Estates
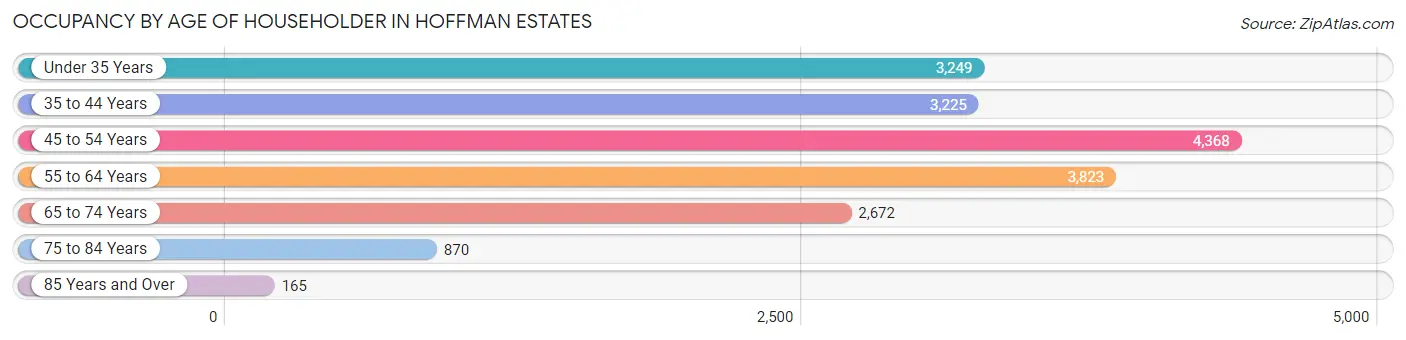
| Age Bracket | # Households | % Households |
| Under 35 Years | 3,249 | 17.7% |
| 35 to 44 Years | 3,225 | 17.5% |
| 45 to 54 Years | 4,368 | 23.8% |
| 55 to 64 Years | 3,823 | 20.8% |
| 65 to 74 Years | 2,672 | 14.5% |
| 75 to 84 Years | 870 | 4.7% |
| 85 Years and Over | 165 | 0.9% |
| Total | 18,372 | 100.0% |
Housing Finances in Hoffman Estates
Median Income by Occupancy in Hoffman Estates
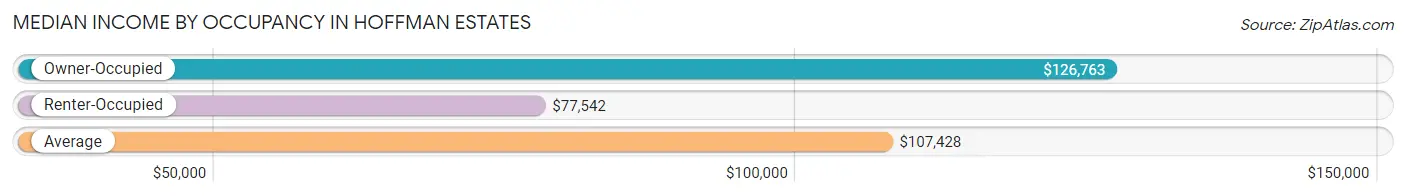
| Occupancy Type | # Households | Median Income |
| Owner-Occupied | 13,604 (74.1%) | $126,763 |
| Renter-Occupied | 4,768 (26.0%) | $77,542 |
| Average | 18,372 (100.0%) | $107,428 |
Occupancy by Householder Income Bracket in Hoffman Estates
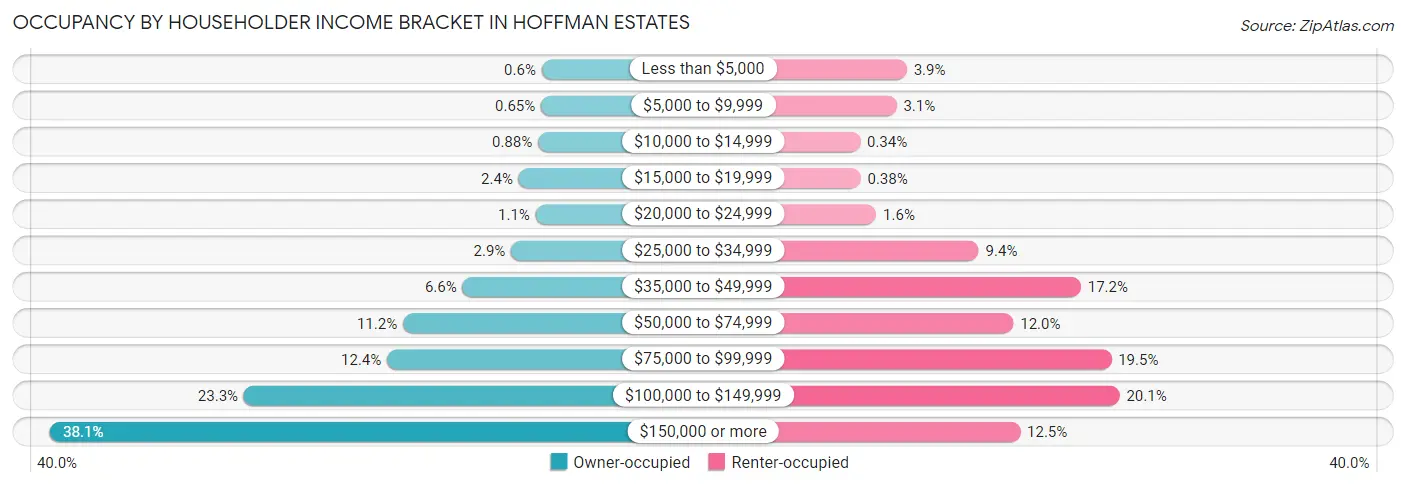
| Income Bracket | Owner-occupied | Renter-occupied |
| Less than $5,000 | 82 (0.6%) | 186 (3.9%) |
| $5,000 to $9,999 | 89 (0.6%) | 149 (3.1%) |
| $10,000 to $14,999 | 120 (0.9%) | 16 (0.3%) |
| $15,000 to $19,999 | 320 (2.4%) | 18 (0.4%) |
| $20,000 to $24,999 | 144 (1.1%) | 75 (1.6%) |
| $25,000 to $34,999 | 398 (2.9%) | 447 (9.4%) |
| $35,000 to $49,999 | 902 (6.6%) | 818 (17.2%) |
| $50,000 to $74,999 | 1,519 (11.2%) | 573 (12.0%) |
| $75,000 to $99,999 | 1,684 (12.4%) | 929 (19.5%) |
| $100,000 to $149,999 | 3,168 (23.3%) | 959 (20.1%) |
| $150,000 or more | 5,178 (38.1%) | 598 (12.5%) |
| Total | 13,604 (100.0%) | 4,768 (100.0%) |
Monthly Housing Cost Tiers in Hoffman Estates
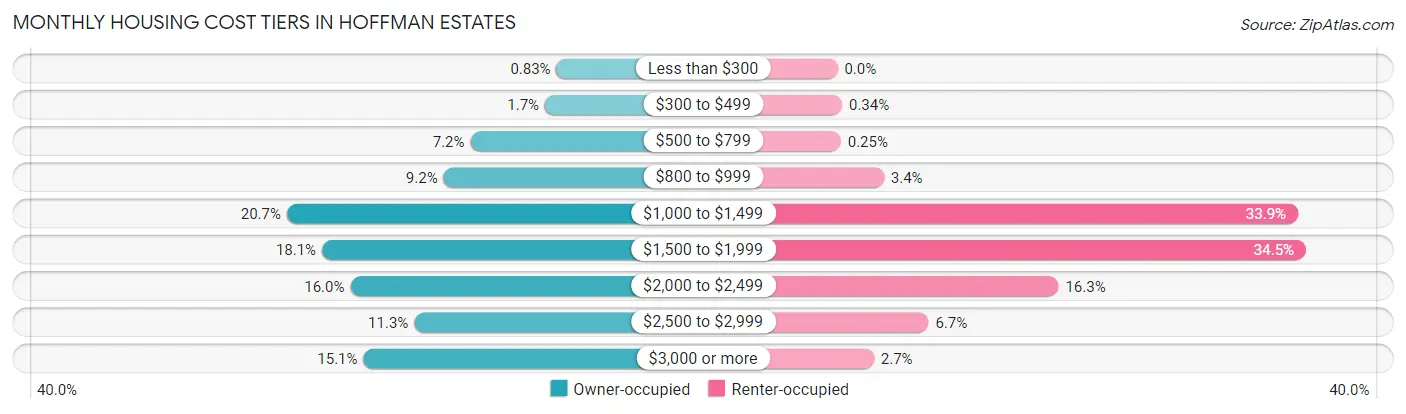
| Monthly Cost | Owner-occupied | Renter-occupied |
| Less than $300 | 113 (0.8%) | 0 (0.0%) |
| $300 to $499 | 229 (1.7%) | 16 (0.3%) |
| $500 to $799 | 975 (7.2%) | 12 (0.3%) |
| $800 to $999 | 1,245 (9.1%) | 163 (3.4%) |
| $1,000 to $1,499 | 2,814 (20.7%) | 1,617 (33.9%) |
| $1,500 to $1,999 | 2,463 (18.1%) | 1,645 (34.5%) |
| $2,000 to $2,499 | 2,178 (16.0%) | 776 (16.3%) |
| $2,500 to $2,999 | 1,539 (11.3%) | 320 (6.7%) |
| $3,000 or more | 2,048 (15.0%) | 128 (2.7%) |
| Total | 13,604 (100.0%) | 4,768 (100.0%) |
Physical Housing Characteristics in Hoffman Estates
Housing Structures in Hoffman Estates
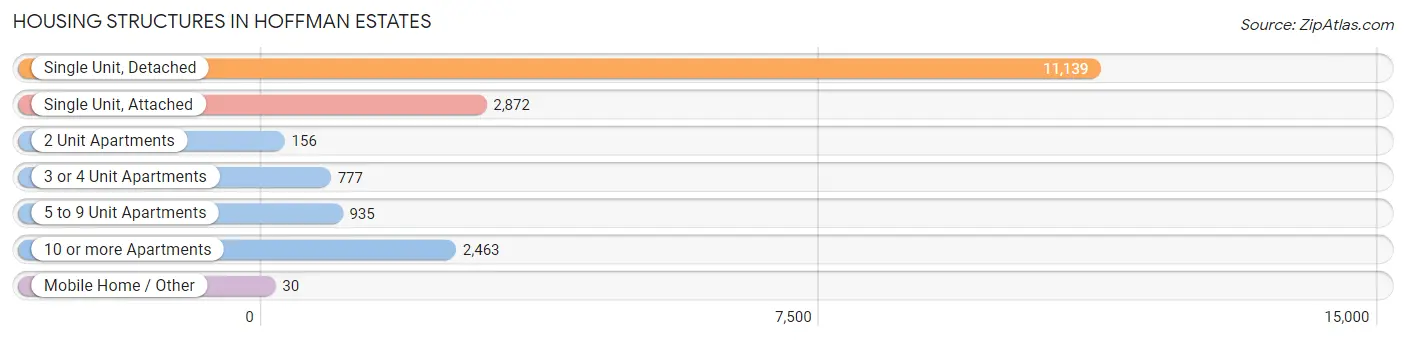
| Structure Type | # Housing Units | % Housing Units |
| Single Unit, Detached | 11,139 | 60.6% |
| Single Unit, Attached | 2,872 | 15.6% |
| 2 Unit Apartments | 156 | 0.9% |
| 3 or 4 Unit Apartments | 777 | 4.2% |
| 5 to 9 Unit Apartments | 935 | 5.1% |
| 10 or more Apartments | 2,463 | 13.4% |
| Mobile Home / Other | 30 | 0.2% |
| Total | 18,372 | 100.0% |
Housing Structures by Occupancy in Hoffman Estates
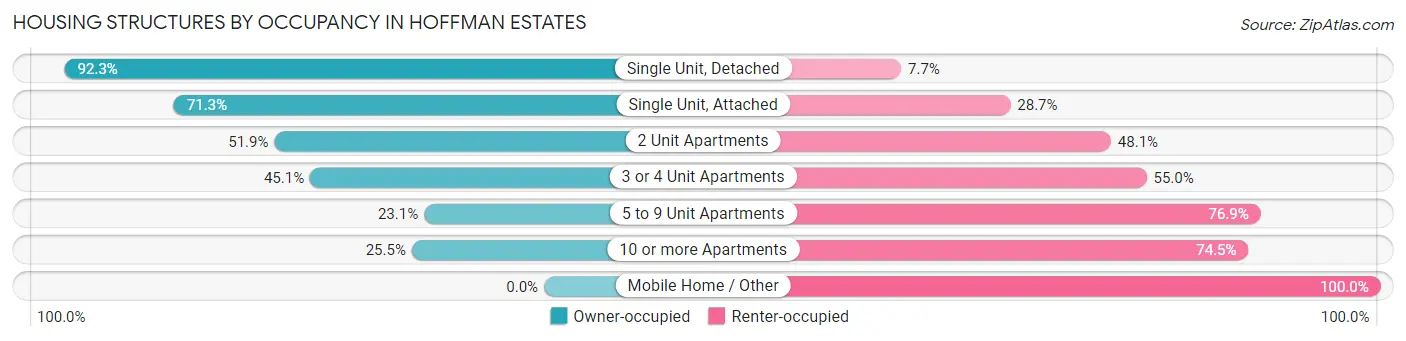
| Structure Type | Owner-occupied | Renter-occupied |
| Single Unit, Detached | 10,283 (92.3%) | 856 (7.7%) |
| Single Unit, Attached | 2,047 (71.3%) | 825 (28.7%) |
| 2 Unit Apartments | 81 (51.9%) | 75 (48.1%) |
| 3 or 4 Unit Apartments | 350 (45.1%) | 427 (54.9%) |
| 5 to 9 Unit Apartments | 216 (23.1%) | 719 (76.9%) |
| 10 or more Apartments | 627 (25.5%) | 1,836 (74.5%) |
| Mobile Home / Other | 0 (0.0%) | 30 (100.0%) |
| Total | 13,604 (74.1%) | 4,768 (26.0%) |
Housing Structures by Number of Rooms in Hoffman Estates
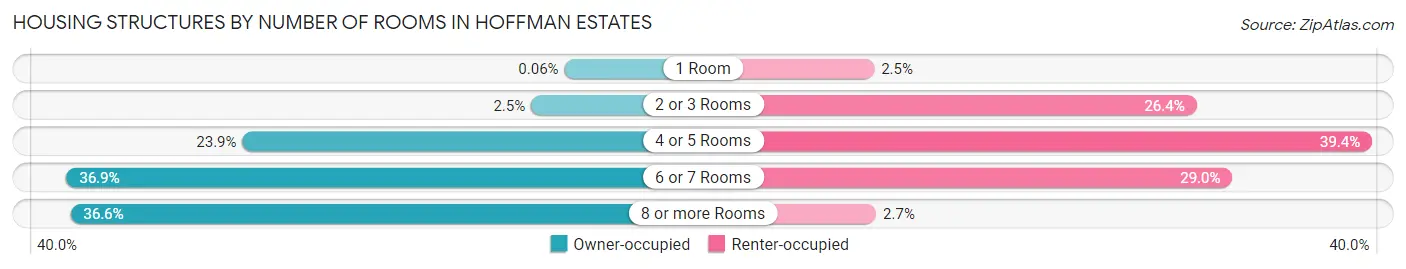
| Number of Rooms | Owner-occupied | Renter-occupied |
| 1 Room | 8 (0.1%) | 121 (2.5%) |
| 2 or 3 Rooms | 344 (2.5%) | 1,258 (26.4%) |
| 4 or 5 Rooms | 3,250 (23.9%) | 1,877 (39.4%) |
| 6 or 7 Rooms | 5,021 (36.9%) | 1,384 (29.0%) |
| 8 or more Rooms | 4,981 (36.6%) | 128 (2.7%) |
| Total | 13,604 (100.0%) | 4,768 (100.0%) |
Housing Structure by Heating Type in Hoffman Estates
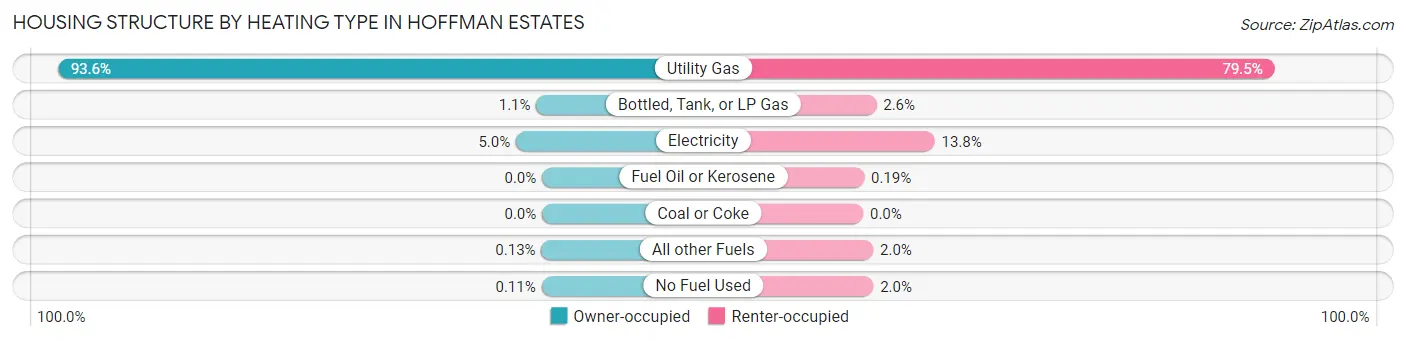
| Heating Type | Owner-occupied | Renter-occupied |
| Utility Gas | 12,734 (93.6%) | 3,791 (79.5%) |
| Bottled, Tank, or LP Gas | 151 (1.1%) | 122 (2.6%) |
| Electricity | 686 (5.0%) | 659 (13.8%) |
| Fuel Oil or Kerosene | 0 (0.0%) | 9 (0.2%) |
| Coal or Coke | 0 (0.0%) | 0 (0.0%) |
| All other Fuels | 18 (0.1%) | 93 (1.9%) |
| No Fuel Used | 15 (0.1%) | 94 (2.0%) |
| Total | 13,604 (100.0%) | 4,768 (100.0%) |
Household Vehicle Usage in Hoffman Estates
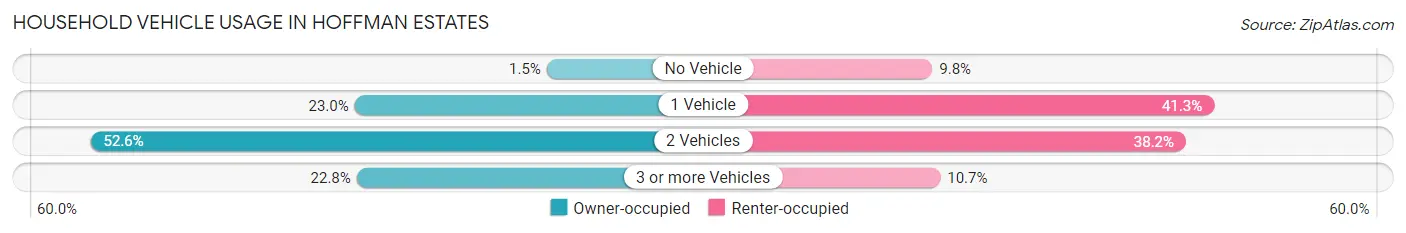
| Vehicles per Household | Owner-occupied | Renter-occupied |
| No Vehicle | 207 (1.5%) | 467 (9.8%) |
| 1 Vehicle | 3,134 (23.0%) | 1,971 (41.3%) |
| 2 Vehicles | 7,160 (52.6%) | 1,821 (38.2%) |
| 3 or more Vehicles | 3,103 (22.8%) | 509 (10.7%) |
| Total | 13,604 (100.0%) | 4,768 (100.0%) |
Real Estate & Mortgages in Hoffman Estates
Real Estate and Mortgage Overview in Hoffman Estates
| Characteristic | Without Mortgage | With Mortgage |
| Housing Units | 4,393 | 9,211 |
| Median Property Value | $321,700 | $334,000 |
| Median Household Income | $110,174 | $3,797 |
| Monthly Housing Costs | $977 | $2,048 |
| Real Estate Taxes | $7,671 | $47 |
Property Value by Mortgage Status in Hoffman Estates
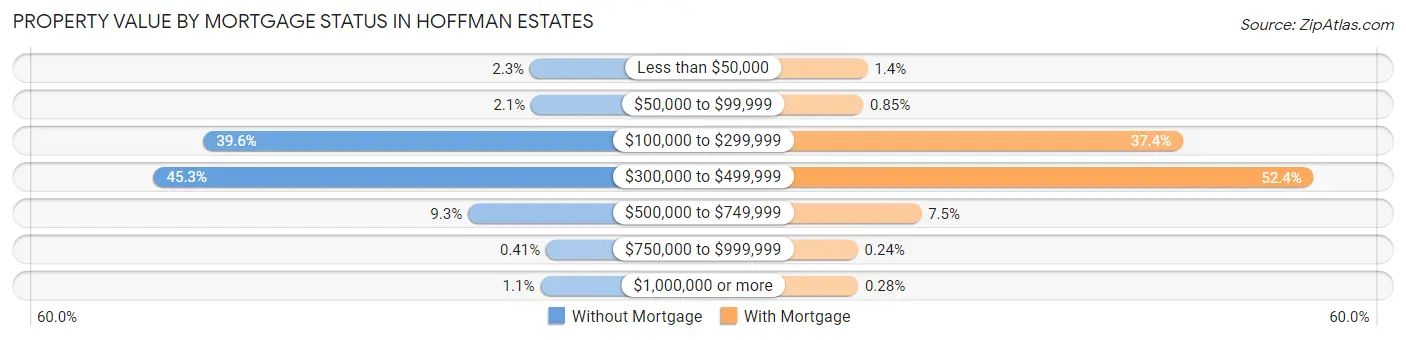
| Property Value | Without Mortgage | With Mortgage |
| Less than $50,000 | 99 (2.2%) | 125 (1.4%) |
| $50,000 to $99,999 | 93 (2.1%) | 78 (0.9%) |
| $100,000 to $299,999 | 1,738 (39.6%) | 3,447 (37.4%) |
| $300,000 to $499,999 | 1,988 (45.3%) | 4,822 (52.3%) |
| $500,000 to $749,999 | 410 (9.3%) | 691 (7.5%) |
| $750,000 to $999,999 | 18 (0.4%) | 22 (0.2%) |
| $1,000,000 or more | 47 (1.1%) | 26 (0.3%) |
| Total | 4,393 (100.0%) | 9,211 (100.0%) |
Household Income by Mortgage Status in Hoffman Estates
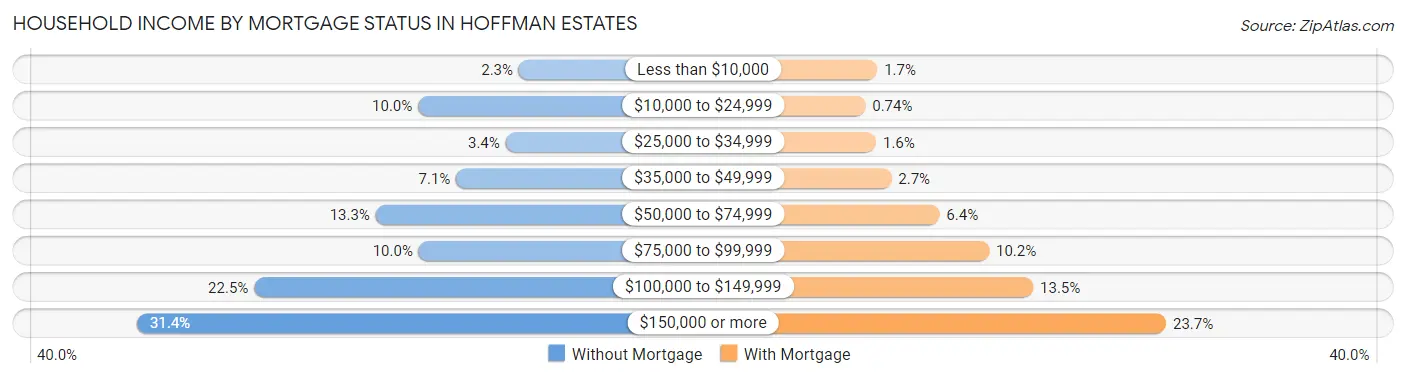
| Household Income | Without Mortgage | With Mortgage |
| Less than $10,000 | 103 (2.3%) | 152 (1.7%) |
| $10,000 to $24,999 | 440 (10.0%) | 68 (0.7%) |
| $25,000 to $34,999 | 147 (3.4%) | 144 (1.6%) |
| $35,000 to $49,999 | 313 (7.1%) | 251 (2.7%) |
| $50,000 to $74,999 | 582 (13.3%) | 589 (6.4%) |
| $75,000 to $99,999 | 438 (10.0%) | 937 (10.2%) |
| $100,000 to $149,999 | 989 (22.5%) | 1,246 (13.5%) |
| $150,000 or more | 1,381 (31.4%) | 2,179 (23.7%) |
| Total | 4,393 (100.0%) | 9,211 (100.0%) |
Property Value to Household Income Ratio in Hoffman Estates
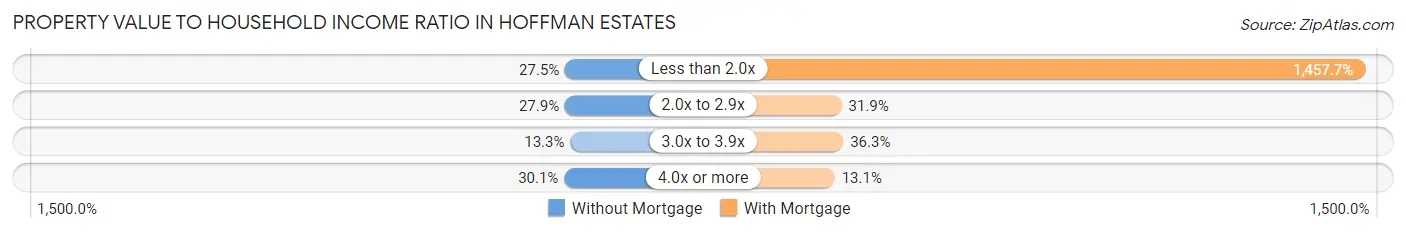
| Value-to-Income Ratio | Without Mortgage | With Mortgage |
| Less than 2.0x | 1,207 (27.5%) | 134,265 (1,457.7%) |
| 2.0x to 2.9x | 1,225 (27.9%) | 2,936 (31.9%) |
| 3.0x to 3.9x | 585 (13.3%) | 3,340 (36.3%) |
| 4.0x or more | 1,322 (30.1%) | 1,204 (13.1%) |
| Total | 4,393 (100.0%) | 9,211 (100.0%) |
Real Estate Taxes by Mortgage Status in Hoffman Estates
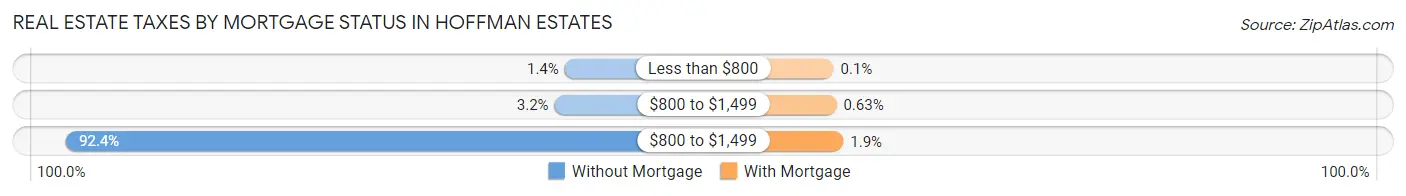
| Property Taxes | Without Mortgage | With Mortgage |
| Less than $800 | 60 (1.4%) | 9 (0.1%) |
| $800 to $1,499 | 142 (3.2%) | 58 (0.6%) |
| $800 to $1,499 | 4,061 (92.4%) | 173 (1.9%) |
| Total | 4,393 (100.0%) | 9,211 (100.0%) |
Health & Disability in Hoffman Estates
Health Insurance Coverage by Age in Hoffman Estates
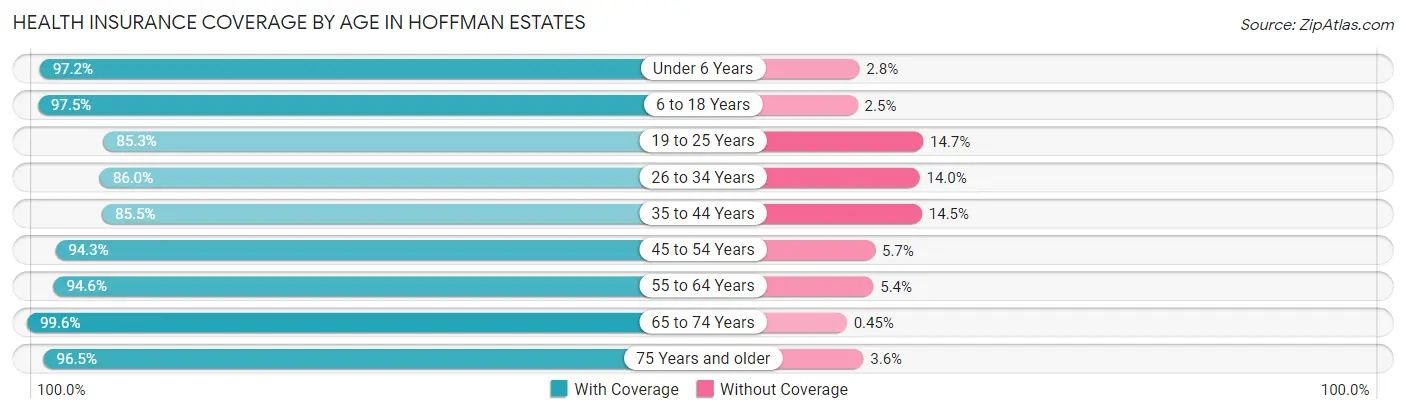
| Age Bracket | With Coverage | Without Coverage |
| Under 6 Years | 3,962 (97.2%) | 115 (2.8%) |
| 6 to 18 Years | 8,428 (97.5%) | 215 (2.5%) |
| 19 to 25 Years | 3,273 (85.3%) | 564 (14.7%) |
| 26 to 34 Years | 5,861 (86.0%) | 957 (14.0%) |
| 35 to 44 Years | 5,814 (85.5%) | 984 (14.5%) |
| 45 to 54 Years | 7,177 (94.3%) | 436 (5.7%) |
| 55 to 64 Years | 6,609 (94.6%) | 378 (5.4%) |
| 65 to 74 Years | 4,662 (99.6%) | 21 (0.4%) |
| 75 Years and older | 2,010 (96.5%) | 74 (3.5%) |
| Total | 47,796 (92.7%) | 3,744 (7.3%) |
Health Insurance Coverage by Citizenship Status in Hoffman Estates
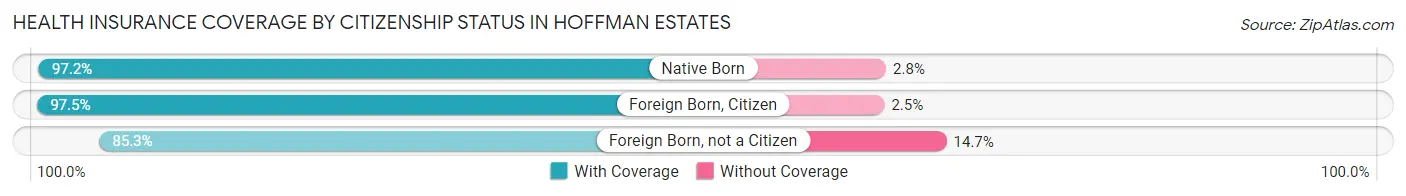
| Citizenship Status | With Coverage | Without Coverage |
| Native Born | 3,962 (97.2%) | 115 (2.8%) |
| Foreign Born, Citizen | 8,428 (97.5%) | 215 (2.5%) |
| Foreign Born, not a Citizen | 3,273 (85.3%) | 564 (14.7%) |
Health Insurance Coverage by Household Income in Hoffman Estates
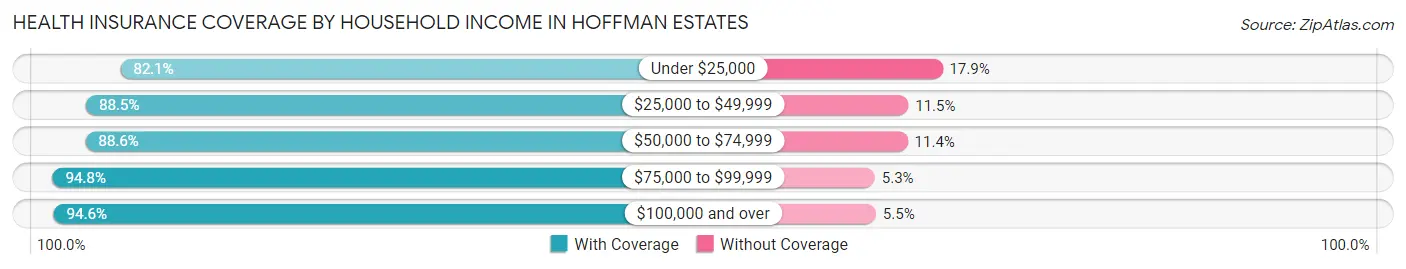
| Household Income | With Coverage | Without Coverage |
| Under $25,000 | 1,661 (82.1%) | 363 (17.9%) |
| $25,000 to $49,999 | 5,636 (88.5%) | 734 (11.5%) |
| $50,000 to $74,999 | 4,525 (88.6%) | 582 (11.4%) |
| $75,000 to $99,999 | 6,881 (94.8%) | 381 (5.2%) |
| $100,000 and over | 29,068 (94.6%) | 1,677 (5.4%) |
Public vs Private Health Insurance Coverage by Age in Hoffman Estates
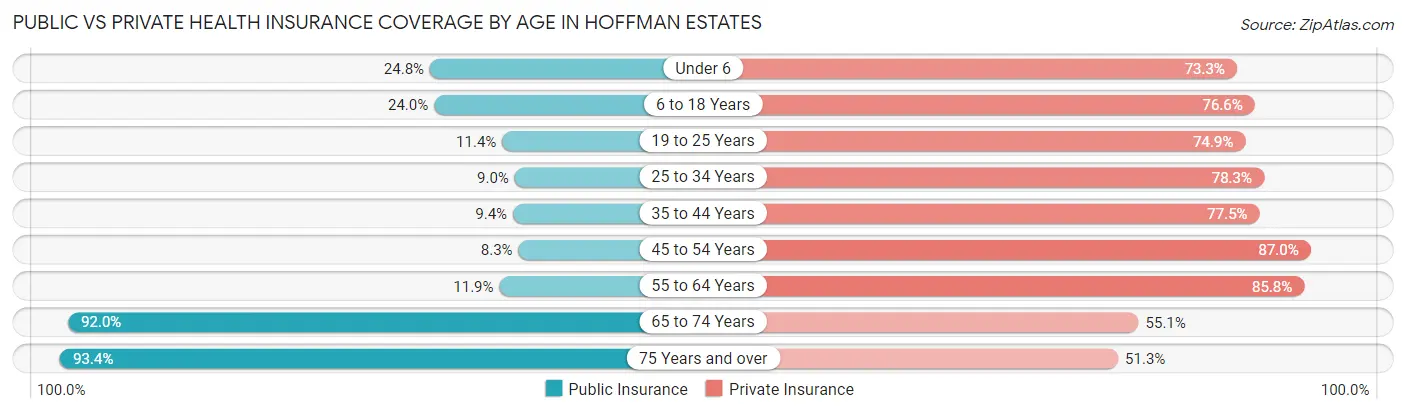
| Age Bracket | Public Insurance | Private Insurance |
| Under 6 | 1,010 (24.8%) | 2,988 (73.3%) |
| 6 to 18 Years | 2,074 (24.0%) | 6,622 (76.6%) |
| 19 to 25 Years | 436 (11.4%) | 2,873 (74.9%) |
| 25 to 34 Years | 616 (9.0%) | 5,340 (78.3%) |
| 35 to 44 Years | 636 (9.4%) | 5,269 (77.5%) |
| 45 to 54 Years | 635 (8.3%) | 6,623 (87.0%) |
| 55 to 64 Years | 830 (11.9%) | 5,994 (85.8%) |
| 65 to 74 Years | 4,306 (91.9%) | 2,580 (55.1%) |
| 75 Years and over | 1,947 (93.4%) | 1,069 (51.3%) |
| Total | 12,490 (24.2%) | 39,358 (76.4%) |
Disability Status by Sex by Age in Hoffman Estates
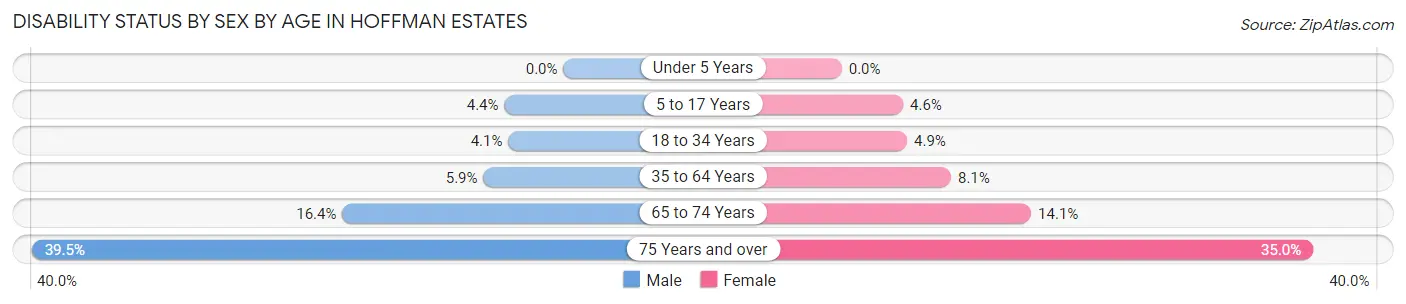
| Age Bracket | Male | Female |
| Under 5 Years | 0 (0.0%) | 0 (0.0%) |
| 5 to 17 Years | 189 (4.4%) | 193 (4.5%) |
| 18 to 34 Years | 255 (4.1%) | 251 (4.9%) |
| 35 to 64 Years | 616 (5.9%) | 894 (8.1%) |
| 65 to 74 Years | 389 (16.4%) | 325 (14.1%) |
| 75 Years and over | 369 (39.5%) | 402 (35.0%) |
Disability Class by Sex by Age in Hoffman Estates
Disability Class: Hearing Difficulty
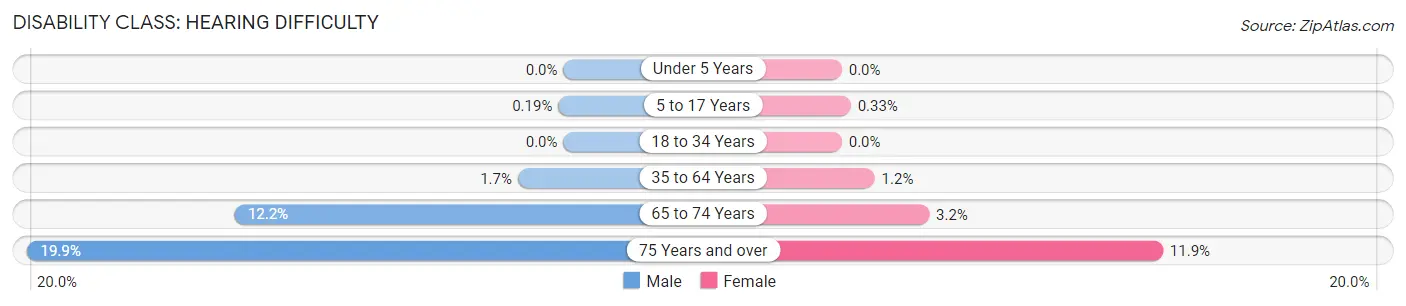
| Age Bracket | Male | Female |
| Under 5 Years | 0 (0.0%) | 0 (0.0%) |
| 5 to 17 Years | 8 (0.2%) | 14 (0.3%) |
| 18 to 34 Years | 0 (0.0%) | 0 (0.0%) |
| 35 to 64 Years | 175 (1.7%) | 135 (1.2%) |
| 65 to 74 Years | 289 (12.2%) | 75 (3.2%) |
| 75 Years and over | 186 (19.9%) | 137 (11.9%) |
Disability Class: Vision Difficulty
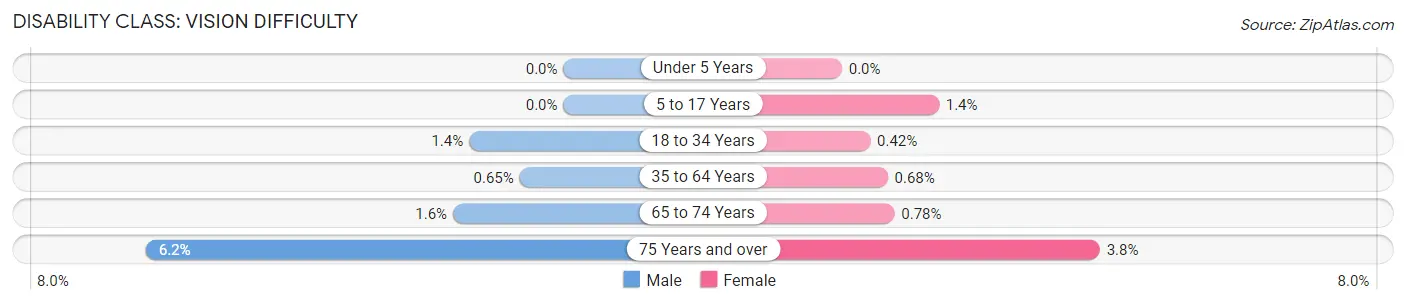
| Age Bracket | Male | Female |
| Under 5 Years | 0 (0.0%) | 0 (0.0%) |
| 5 to 17 Years | 0 (0.0%) | 61 (1.4%) |
| 18 to 34 Years | 87 (1.4%) | 22 (0.4%) |
| 35 to 64 Years | 67 (0.6%) | 75 (0.7%) |
| 65 to 74 Years | 39 (1.6%) | 18 (0.8%) |
| 75 Years and over | 58 (6.2%) | 44 (3.8%) |
Disability Class: Cognitive Difficulty
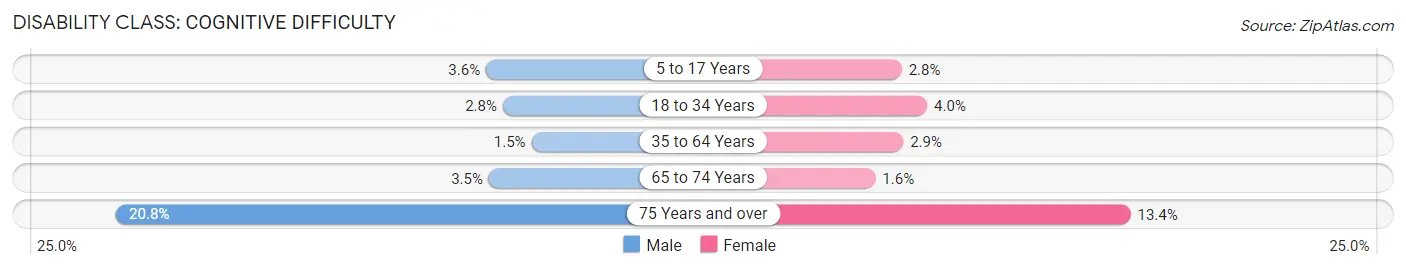
| Age Bracket | Male | Female |
| 5 to 17 Years | 155 (3.6%) | 118 (2.8%) |
| 18 to 34 Years | 175 (2.8%) | 205 (4.0%) |
| 35 to 64 Years | 153 (1.5%) | 314 (2.9%) |
| 65 to 74 Years | 82 (3.5%) | 36 (1.6%) |
| 75 Years and over | 194 (20.7%) | 154 (13.4%) |
Disability Class: Ambulatory Difficulty
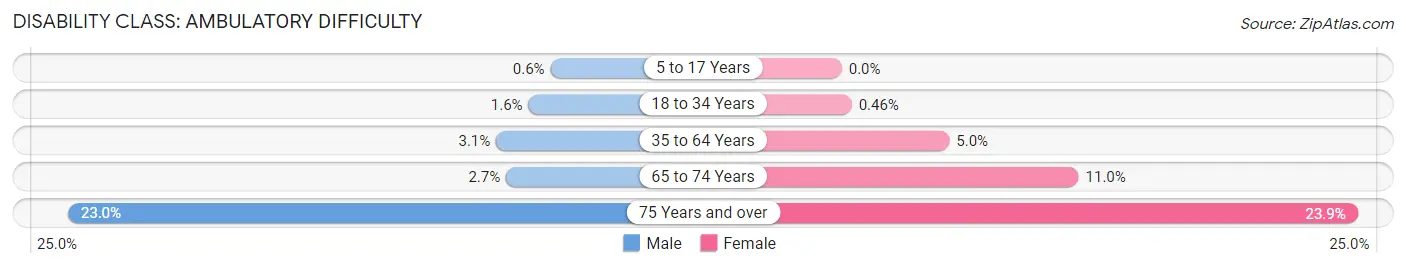
| Age Bracket | Male | Female |
| 5 to 17 Years | 26 (0.6%) | 0 (0.0%) |
| 18 to 34 Years | 101 (1.6%) | 24 (0.5%) |
| 35 to 64 Years | 323 (3.1%) | 550 (5.0%) |
| 65 to 74 Years | 63 (2.7%) | 254 (11.0%) |
| 75 Years and over | 215 (23.0%) | 275 (23.9%) |
Disability Class: Self-Care Difficulty
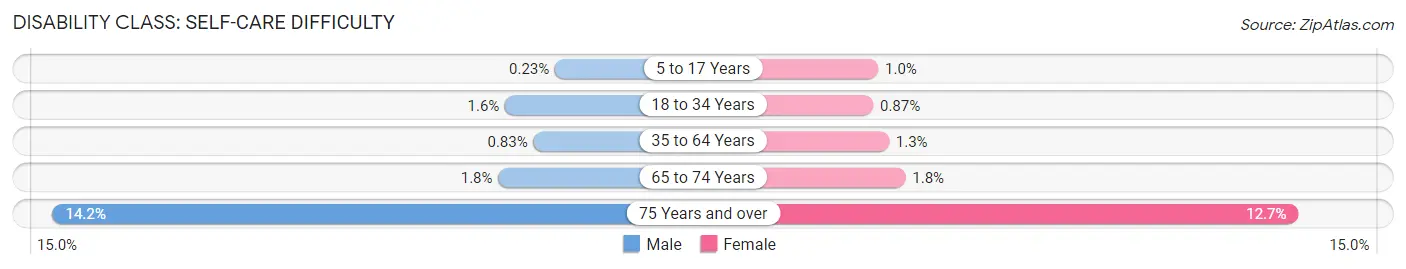
| Age Bracket | Male | Female |
| 5 to 17 Years | 10 (0.2%) | 43 (1.0%) |
| 18 to 34 Years | 101 (1.6%) | 45 (0.9%) |
| 35 to 64 Years | 86 (0.8%) | 144 (1.3%) |
| 65 to 74 Years | 43 (1.8%) | 41 (1.8%) |
| 75 Years and over | 133 (14.2%) | 146 (12.7%) |
Technology Access in Hoffman Estates
Computing Device Access in Hoffman Estates
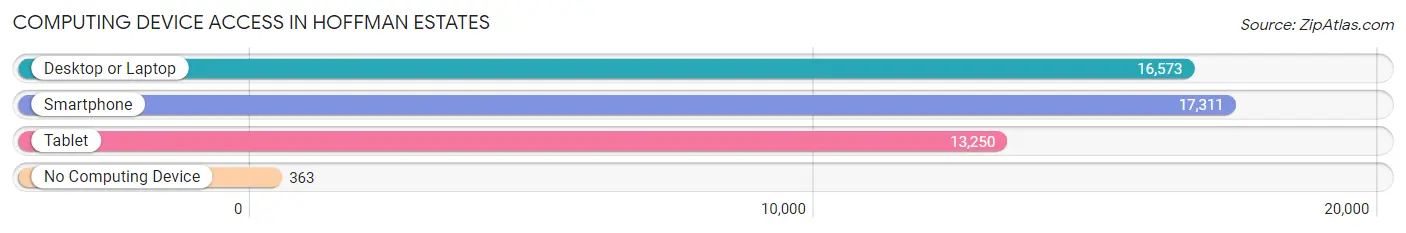
| Device Type | # Households | % Households |
| Desktop or Laptop | 16,573 | 90.2% |
| Smartphone | 17,311 | 94.2% |
| Tablet | 13,250 | 72.1% |
| No Computing Device | 363 | 2.0% |
| Total | 18,372 | 100.0% |
Internet Access in Hoffman Estates
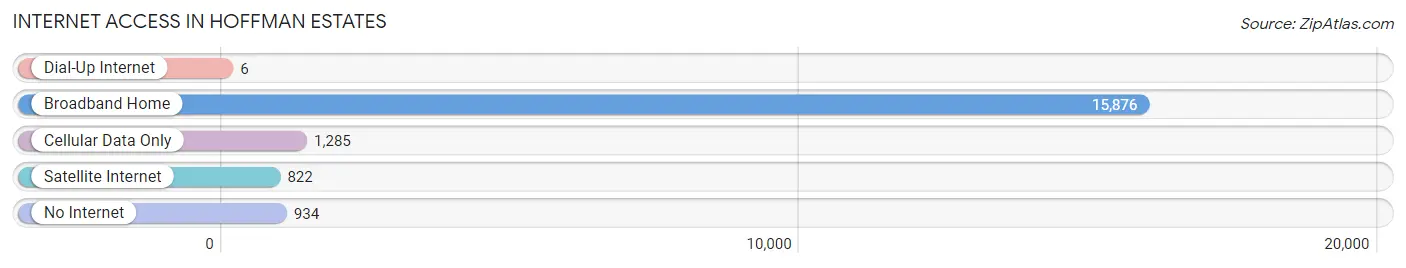
| Internet Type | # Households | % Households |
| Dial-Up Internet | 6 | 0.0% |
| Broadband Home | 15,876 | 86.4% |
| Cellular Data Only | 1,285 | 7.0% |
| Satellite Internet | 822 | 4.5% |
| No Internet | 934 | 5.1% |
| Total | 18,372 | 100.0% |
Hoffman Estates Summary
Hoffman Estates is a village located in Cook and Kane counties in the state of Illinois. It is a suburb of Chicago, located approximately 25 miles northwest of the city. The village was incorporated in 1959 and has a population of 51,895 as of the 2010 census.
History
Hoffman Estates was originally part of the Potawatomi Indian Reservation. The first settlers arrived in the area in the early 1800s, and the village was officially incorporated in 1959. The village was named after the Hoffman family, who were some of the first settlers in the area.
The village experienced rapid growth in the 1960s and 1970s, due to its proximity to Chicago and its access to major highways. The village was home to the first Sears, Roebuck and Company catalog store, which opened in 1972. The store was later converted into a shopping mall, now known as the Hoffman Estates Shopping Center.
Geography
Hoffman Estates is located in Cook and Kane counties in the state of Illinois. It is a suburb of Chicago, located approximately 25 miles northwest of the city. The village has a total area of 16.2 square miles, of which 15.9 square miles is land and 0.3 square miles is water.
The village is bordered by the villages of Schaumburg to the north, Hanover Park to the east, and South Barrington to the south. The village is also bordered by the cities of Elgin and Streamwood to the west.
Economy
Hoffman Estates is home to several major employers, including Sears, Roebuck and Company, which is headquartered in the village. Other major employers include the American Academy of Pediatrics, the American College of Healthcare Executives, and the American Medical Association.
The village is also home to several shopping centers, including the Hoffman Estates Shopping Center, the Prairie Stone Shopping Center, and the Poplar Creek Crossing Shopping Center.
Demographics
As of the 2010 census, the population of Hoffman Estates was 51,895. The racial makeup of the village was 73.3% White, 8.2% African American, 0.3% Native American, 11.7% Asian, and 4.5% from other races. Hispanic or Latino of any race were 13.2% of the population.
The median household income in the village was $76,837, and the median family income was $86,837. The per capita income was $32,945. About 4.3% of families and 5.7% of the population were below the poverty line.
The village is served by several school districts, including the Schaumburg Township Elementary School District 54, the Schaumburg Township High School District 211, and the Elgin Area School District U-46.
Common Questions
What is the Total Population of Hoffman Estates?
Total Population of Hoffman Estates is 51,744.
What is the Total Male Population of Hoffman Estates?
Total Male Population of Hoffman Estates is 25,898.
What is the Total Female Population of Hoffman Estates?
Total Female Population of Hoffman Estates is 25,846.
What is the Ratio of Males per 100 Females in Hoffman Estates?
There are 100.20 Males per 100 Females in Hoffman Estates.
What is the Ratio of Females per 100 Males in Hoffman Estates?
There are 99.80 Females per 100 Males in Hoffman Estates.
What is the Median Population Age in Hoffman Estates?
Median Population Age in Hoffman Estates is 38.1 Years.
What is the Average Family Size in Hoffman Estates
Average Family Size in Hoffman Estates is 3.2 People.
What is the Average Household Size in Hoffman Estates
Average Household Size in Hoffman Estates is 2.8 People.
What is Per Capita Income in Hoffman Estates?
Per Capita income in Hoffman Estates is $45,302.
What is the Median Family Income in Hoffman Estates?
Median Family Income in Hoffman Estates is $120,596.
What is the Median Household income in Hoffman Estates?
Median Household Income in Hoffman Estates is $107,428.
What is Income or Wage Gap in Hoffman Estates?
Income or Wage Gap in Hoffman Estates is 31.2%.
Women in Hoffman Estates earn 68.8 cents for every dollar earned by a man.
What is Inequality or Gini Index in Hoffman Estates?
Inequality or Gini Index in Hoffman Estates is 0.38.
How Large is the Labor Force in Hoffman Estates?
There are 29,515 People in the Labor Forcein in Hoffman Estates.
What is the Percentage of People in the Labor Force in Hoffman Estates?
71.7% of People are in the Labor Force in Hoffman Estates.
What is the Unemployment Rate in Hoffman Estates?
Unemployment Rate in Hoffman Estates is 3.7%.