Cities with the Highest Percentage of Immigrants from South Eastern Asia in Minnesota
RELATED REPORTS & OPTIONS
South Eastern Asia
Minnesota
Compare Cities
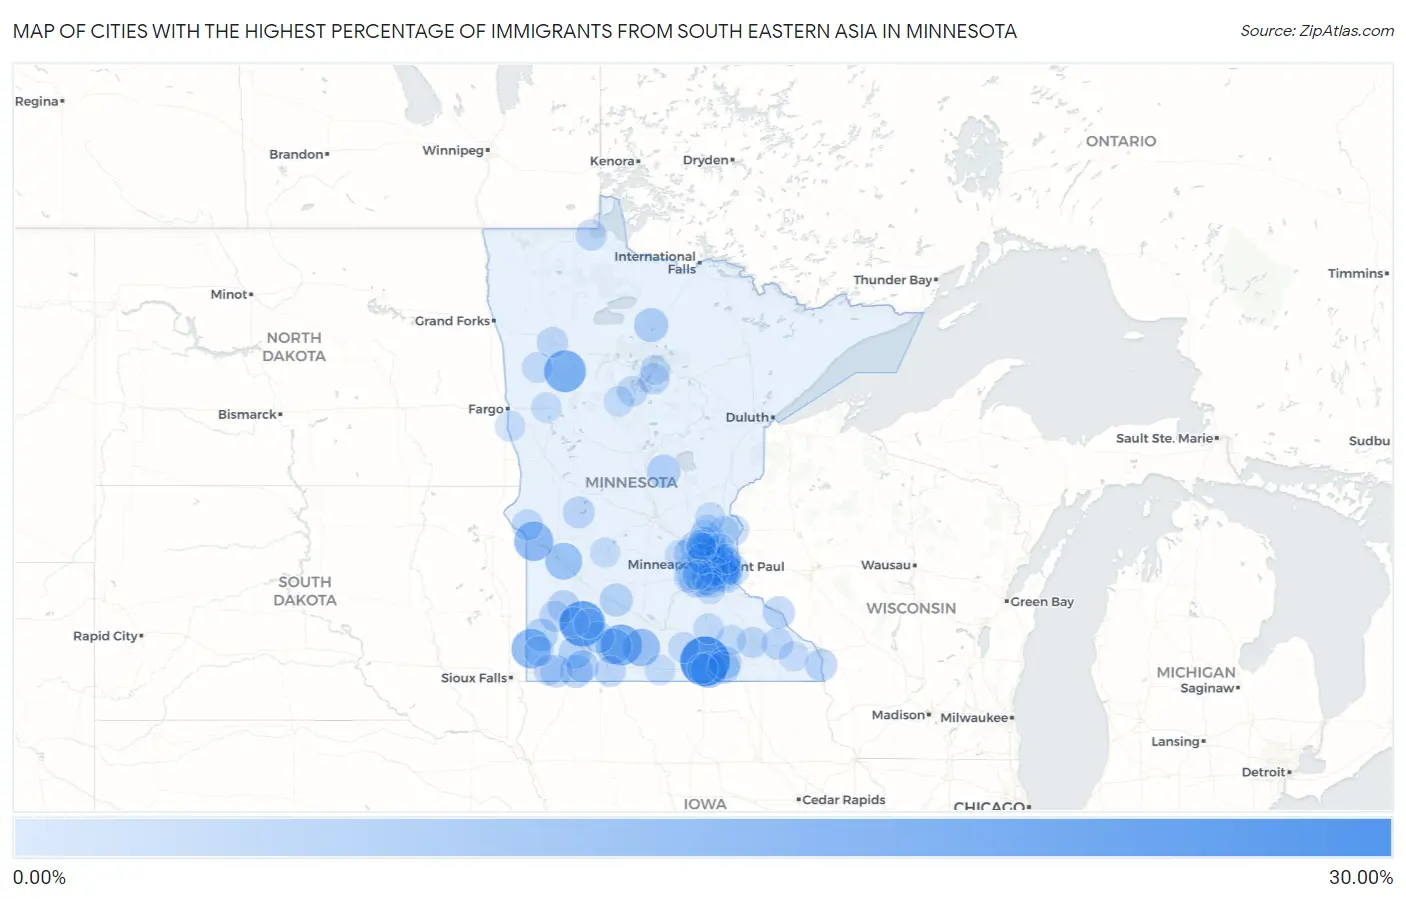
Map of Cities with the Highest Percentage of Immigrants from South Eastern Asia in Minnesota
0.00%
30.00%
Cities with the Highest Percentage of Immigrants from South Eastern Asia in Minnesota
| City | South Eastern Asia | vs State | vs National | |
| 1. | Clarks Grove | 25.47% | 1.52%(+24.0)#-1 | 1.30%(+24.2)#0 |
| 2. | Walnut Grove | 20.03% | 1.52%(+18.5)#0 | 1.30%(+18.7)#1 |
| 3. | Midway | 15.62% | 1.52%(+14.1)#1 | 1.30%(+14.3)#2 |
| 4. | Butterfield | 14.80% | 1.52%(+13.3)#2 | 1.30%(+13.5)#3 |
| 5. | Ihlen | 12.68% | 1.52%(+11.2)#3 | 1.30%(+11.4)#4 |
| 6. | Odessa | 12.37% | 1.52%(+10.9)#4 | 1.30%(+11.1)#5 |
| 7. | Lewisville | 10.26% | 1.52%(+8.74)#5 | 1.30%(+8.96)#6 |
| 8. | Watson | 9.42% | 1.52%(+7.90)#6 | 1.30%(+8.13)#7 |
| 9. | Hayward | 8.33% | 1.52%(+6.81)#7 | 1.30%(+7.04)#8 |
| 10. | Mountain Lake | 8.26% | 1.52%(+6.74)#8 | 1.30%(+6.97)#9 |
| 11. | St Paul | 8.05% | 1.52%(+6.53)#9 | 1.30%(+6.76)#10 |
| 12. | Brooklyn Park | 7.52% | 1.52%(+6.00)#10 | 1.30%(+6.22)#11 |
| 13. | Maplewood | 7.17% | 1.52%(+5.65)#11 | 1.30%(+5.87)#12 |
| 14. | Northome | 6.02% | 1.52%(+4.50)#12 | 1.30%(+4.72)#13 |
| 15. | North St Paul | 5.78% | 1.52%(+4.26)#13 | 1.30%(+4.49)#14 |
| 16. | Worthington | 5.13% | 1.52%(+3.61)#14 | 1.30%(+3.83)#15 |
| 17. | Harding | 5.04% | 1.52%(+3.52)#15 | 1.30%(+3.74)#16 |
| 18. | Franklin | 4.81% | 1.52%(+3.29)#16 | 1.30%(+3.52)#17 |
| 19. | Holland | 4.69% | 1.52%(+3.17)#17 | 1.30%(+3.40)#18 |
| 20. | Landfall | 4.68% | 1.52%(+3.16)#18 | 1.30%(+3.38)#19 |
| 21. | Brooklyn Center | 4.59% | 1.52%(+3.07)#19 | 1.30%(+3.29)#20 |
| 22. | Fulda | 4.58% | 1.52%(+3.06)#20 | 1.30%(+3.28)#21 |
| 23. | Lansing | 4.40% | 1.52%(+2.88)#21 | 1.30%(+3.11)#22 |
| 24. | Austin | 4.38% | 1.52%(+2.86)#22 | 1.30%(+3.09)#23 |
| 25. | Shakopee | 4.09% | 1.52%(+2.57)#23 | 1.30%(+2.79)#24 |
| 26. | Adrian | 3.97% | 1.52%(+2.45)#24 | 1.30%(+2.67)#25 |
| 27. | Dayton | 3.94% | 1.52%(+2.42)#25 | 1.30%(+2.64)#26 |
| 28. | Wabasha | 3.83% | 1.52%(+2.31)#26 | 1.30%(+2.53)#27 |
| 29. | Corcoran | 3.76% | 1.52%(+2.24)#27 | 1.30%(+2.46)#28 |
| 30. | Brewster | 3.73% | 1.52%(+2.21)#28 | 1.30%(+2.44)#29 |
| 31. | Marshall | 3.68% | 1.52%(+2.16)#29 | 1.30%(+2.38)#30 |
| 32. | Brownsville | 3.63% | 1.52%(+2.11)#30 | 1.30%(+2.33)#31 |
| 33. | Oakdale | 3.46% | 1.52%(+1.94)#31 | 1.30%(+2.16)#32 |
| 34. | Starbuck | 3.31% | 1.52%(+1.79)#32 | 1.30%(+2.01)#33 |
| 35. | Mounds View | 3.30% | 1.52%(+1.78)#33 | 1.30%(+2.00)#34 |
| 36. | Savage | 3.22% | 1.52%(+1.70)#34 | 1.30%(+1.92)#262 |
| 37. | Vadnais Heights | 3.19% | 1.52%(+1.67)#35 | 1.30%(+1.90)#263 |
| 38. | Marion | 3.18% | 1.52%(+1.66)#36 | 1.30%(+1.89)#264 |
| 39. | Spring Lake Park | 3.16% | 1.52%(+1.64)#37 | 1.30%(+1.86)#265 |
| 40. | Jeffers | 3.09% | 1.52%(+1.57)#38 | 1.30%(+1.79)#266 |
| 41. | St Charles | 3.04% | 1.52%(+1.52)#39 | 1.30%(+1.74)#267 |
| 42. | Hilltop | 2.99% | 1.52%(+1.47)#40 | 1.30%(+1.69)#268 |
| 43. | St Paul Park | 2.95% | 1.52%(+1.43)#41 | 1.30%(+1.65)#269 |
| 44. | Newport | 2.91% | 1.52%(+1.39)#42 | 1.30%(+1.61)#270 |
| 45. | Blaine | 2.82% | 1.52%(+1.30)#43 | 1.30%(+1.53)#271 |
| 46. | Russell | 2.63% | 1.52%(+1.11)#44 | 1.30%(+1.34)#272 |
| 47. | Federal Dam | 2.53% | 1.52%(+1.01)#45 | 1.30%(+1.24)#273 |
| 48. | Erskine | 2.50% | 1.52%(+0.980)#46 | 1.30%(+1.20)#274 |
| 49. | Jackson | 2.48% | 1.52%(+0.964)#47 | 1.30%(+1.19)#275 |
| 50. | Clinton | 2.46% | 1.52%(+0.945)#48 | 1.30%(+1.17)#276 |
| 51. | Cottage Grove | 2.46% | 1.52%(+0.945)#49 | 1.30%(+1.17)#277 |
| 52. | Little Canada | 2.41% | 1.52%(+0.890)#50 | 1.30%(+1.11)#278 |
| 53. | Warroad | 2.41% | 1.52%(+0.888)#51 | 1.30%(+1.11)#279 |
| 54. | Rochester | 2.34% | 1.52%(+0.818)#52 | 1.30%(+1.04)#280 |
| 55. | Eagan | 2.28% | 1.52%(+0.764)#53 | 1.30%(+0.988)#281 |
| 56. | Waldorf | 2.27% | 1.52%(+0.753)#54 | 1.30%(+0.976)#282 |
| 57. | Burnsville | 2.23% | 1.52%(+0.713)#55 | 1.30%(+0.937)#283 |
| 58. | Gary | 2.17% | 1.52%(+0.646)#56 | 1.30%(+0.870)#284 |
| 59. | New Hope | 2.10% | 1.52%(+0.585)#57 | 1.30%(+0.808)#285 |
| 60. | Center City | 2.08% | 1.52%(+0.563)#58 | 1.30%(+0.787)#286 |
| 61. | Roseville | 2.04% | 1.52%(+0.521)#59 | 1.30%(+0.744)#287 |
| 62. | Magnolia | 2.02% | 1.52%(+0.500)#60 | 1.30%(+0.724)#288 |
| 63. | Medford | 1.99% | 1.52%(+0.467)#61 | 1.30%(+0.691)#289 |
| 64. | Afton | 1.97% | 1.52%(+0.445)#62 | 1.30%(+0.669)#290 |
| 65. | Tracy | 1.94% | 1.52%(+0.424)#63 | 1.30%(+0.648)#291 |
| 66. | Walker | 1.92% | 1.52%(+0.401)#64 | 1.30%(+0.625)#292 |
| 67. | Stacy | 1.85% | 1.52%(+0.327)#65 | 1.30%(+0.551)#293 |
| 68. | Ham Lake | 1.75% | 1.52%(+0.233)#66 | 1.30%(+0.456)#294 |
| 69. | Coon Rapids | 1.75% | 1.52%(+0.226)#67 | 1.30%(+0.449)#295 |
| 70. | Woodbury | 1.74% | 1.52%(+0.219)#68 | 1.30%(+0.443)#296 |
| 71. | Bethel | 1.70% | 1.52%(+0.182)#69 | 1.30%(+0.406)#297 |
| 72. | Blue Earth | 1.70% | 1.52%(+0.178)#70 | 1.30%(+0.401)#298 |
| 73. | Dodge Center | 1.70% | 1.52%(+0.175)#71 | 1.30%(+0.399)#299 |
| 74. | Wayzata | 1.70% | 1.52%(+0.175)#72 | 1.30%(+0.399)#300 |
| 75. | Lexington | 1.67% | 1.52%(+0.155)#73 | 1.30%(+0.379)#301 |
| 76. | Chanhassen | 1.67% | 1.52%(+0.146)#74 | 1.30%(+0.370)#302 |
| 77. | Lake Park | 1.66% | 1.52%(+0.141)#75 | 1.30%(+0.365)#303 |
| 78. | Oak Grove | 1.64% | 1.52%(+0.121)#76 | 1.30%(+0.345)#304 |
| 79. | Albert Lea | 1.64% | 1.52%(+0.118)#77 | 1.30%(+0.342)#305 |
| 80. | Nevis | 1.63% | 1.52%(+0.112)#78 | 1.30%(+0.335)#306 |
| 81. | Bloomington | 1.59% | 1.52%(+0.069)#79 | 1.30%(+0.293)#307 |
| 82. | Revere | 1.56% | 1.52%(+0.042)#80 | 1.30%(+0.266)#308 |
| 83. | Rockford | 1.53% | 1.52%(+0.011)#81 | 1.30%(+0.235)#309 |
| 84. | Chaska | 1.49% | 1.52%(-0.029)#82 | 1.30%(+0.195)#310 |
| 85. | Trosky | 1.47% | 1.52%(-0.049)#83 | 1.30%(+0.174)#311 |
| 86. | Crystal | 1.43% | 1.52%(-0.087)#84 | 1.30%(+0.137)#312 |
| 87. | Rushford | 1.43% | 1.52%(-0.088)#85 | 1.30%(+0.135)#313 |
| 88. | Apple Valley | 1.43% | 1.52%(-0.094)#86 | 1.30%(+0.130)#314 |
| 89. | Mendota | 1.41% | 1.52%(-0.112)#87 | 1.30%(+0.112)#315 |
| 90. | Lakeville | 1.40% | 1.52%(-0.122)#88 | 1.30%(+0.101)#316 |
| 91. | Centerville | 1.38% | 1.52%(-0.141)#89 | 1.30%(+0.083)#317 |
| 92. | Bena | 1.37% | 1.52%(-0.150)#90 | 1.30%(+0.074)#318 |
| 93. | Andover | 1.36% | 1.52%(-0.160)#91 | 1.30%(+0.064)#319 |
| 94. | Pine Springs | 1.35% | 1.52%(-0.166)#92 | 1.30%(+0.058)#320 |
| 95. | Comstock | 1.33% | 1.52%(-0.187)#93 | 1.30%(+0.037)#321 |
| 96. | Anoka | 1.31% | 1.52%(-0.212)#94 | 1.30%(+0.012)#322 |
| 97. | Champlin | 1.31% | 1.52%(-0.214)#95 | 1.30%(+0.009)#323 |
| 98. | Willmar | 1.29% | 1.52%(-0.225)#96 | 1.30%(-0.001)#324 |
| 99. | Eden Prairie | 1.29% | 1.52%(-0.233)#97 | 1.30%(-0.009)#325 |
| 100. | Cambridge | 1.29% | 1.52%(-0.235)#98 | 1.30%(-0.011)#326 |
Common Questions
What are the Top 10 Cities with the Highest Percentage of Immigrants from South Eastern Asia in Minnesota?
Top 10 Cities with the Highest Percentage of Immigrants from South Eastern Asia in Minnesota are:
#1
25.47%
#2
20.03%
#3
15.62%
#4
14.80%
#5
12.68%
#6
12.37%
#7
10.26%
#8
9.42%
#9
8.33%
#10
8.26%
What city has the Highest Percentage of Immigrants from South Eastern Asia in Minnesota?
Clarks Grove has the Highest Percentage of Immigrants from South Eastern Asia in Minnesota with 25.47%.
What is the Percentage of Immigrants from South Eastern Asia in the State of Minnesota?
Percentage of Immigrants from South Eastern Asia in Minnesota is 1.52%.
What is the Percentage of Immigrants from South Eastern Asia in the United States?
Percentage of Immigrants from South Eastern Asia in the United States is 1.30%.