Cities with the Largest Burmese Community in Illinois
RELATED REPORTS & OPTIONS
Burmese
Illinois
Compare Cities
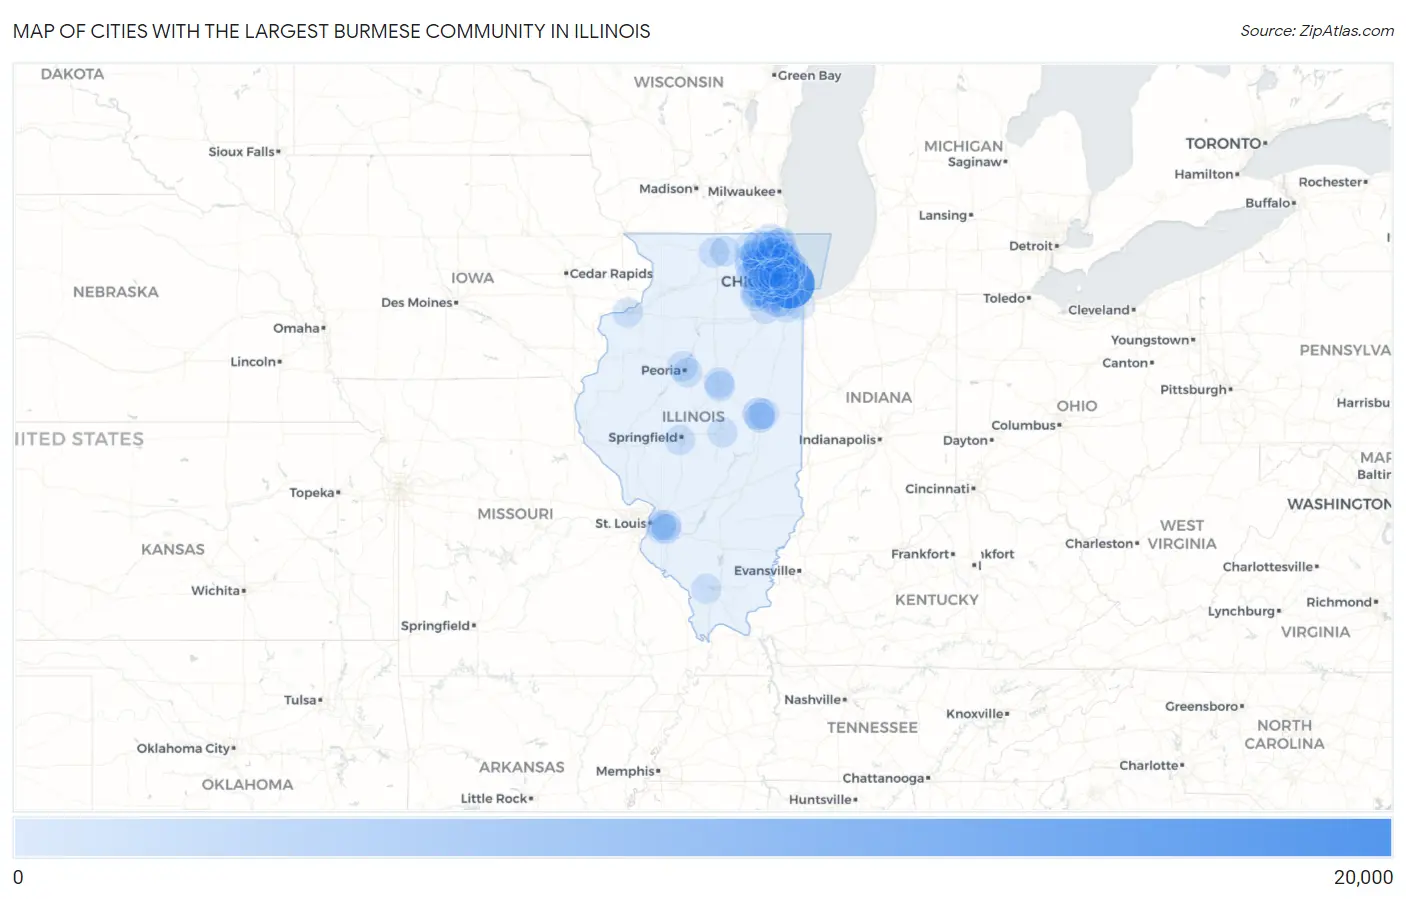
Map of Cities with the Largest Burmese Community in Illinois
0
20,000
Cities with the Largest Burmese Community in Illinois
| City | Burmese | vs State | vs National | |
| 1. | Chicago | 16,224 | 73,081(22.20%)#1 | 1,977,441(0.82%)#8 |
| 2. | Glenview | 2,534 | 73,081(3.47%)#2 | 1,977,441(0.13%)#95 |
| 3. | Naperville | 2,322 | 73,081(3.18%)#3 | 1,977,441(0.12%)#109 |
| 4. | Buffalo Grove | 1,964 | 73,081(2.69%)#4 | 1,977,441(0.10%)#137 |
| 5. | Northbrook | 1,960 | 73,081(2.68%)#5 | 1,977,441(0.10%)#138 |
| 6. | Schaumburg | 1,885 | 73,081(2.58%)#6 | 1,977,441(0.10%)#150 |
| 7. | Champaign | 1,823 | 73,081(2.49%)#7 | 1,977,441(0.09%)#161 |
| 8. | Wheeling | 1,469 | 73,081(2.01%)#8 | 1,977,441(0.07%)#198 |
| 9. | Evanston | 1,459 | 73,081(2.00%)#9 | 1,977,441(0.07%)#200 |
| 10. | Arlington Heights | 1,337 | 73,081(1.83%)#10 | 1,977,441(0.07%)#218 |
| 11. | Skokie | 1,282 | 73,081(1.75%)#11 | 1,977,441(0.06%)#236 |
| 12. | Hoffman Estates | 1,149 | 73,081(1.57%)#12 | 1,977,441(0.06%)#266 |
| 13. | Palatine | 1,140 | 73,081(1.56%)#13 | 1,977,441(0.06%)#271 |
| 14. | Mount Prospect | 1,139 | 73,081(1.56%)#14 | 1,977,441(0.06%)#272 |
| 15. | Vernon Hills | 1,000 | 73,081(1.37%)#15 | 1,977,441(0.05%)#308 |
| 16. | Inverness | 776 | 73,081(1.06%)#16 | 1,977,441(0.04%)#389 |
| 17. | Morton Grove | 712 | 73,081(0.97%)#17 | 1,977,441(0.04%)#423 |
| 18. | Wilmette | 703 | 73,081(0.96%)#18 | 1,977,441(0.04%)#428 |
| 19. | Niles | 702 | 73,081(0.96%)#19 | 1,977,441(0.04%)#429 |
| 20. | Aurora | 606 | 73,081(0.83%)#20 | 1,977,441(0.03%)#483 |
| 21. | Streamwood | 529 | 73,081(0.72%)#21 | 1,977,441(0.03%)#551 |
| 22. | Des Plaines | 514 | 73,081(0.70%)#22 | 1,977,441(0.03%)#566 |
| 23. | Urbana | 500 | 73,081(0.68%)#23 | 1,977,441(0.03%)#581 |
| 24. | Oak Park | 495 | 73,081(0.68%)#24 | 1,977,441(0.03%)#585 |
| 25. | Bolingbrook | 489 | 73,081(0.67%)#25 | 1,977,441(0.02%)#599 |
| 26. | Savoy | 423 | 73,081(0.58%)#26 | 1,977,441(0.02%)#687 |
| 27. | Lincolnshire | 409 | 73,081(0.56%)#27 | 1,977,441(0.02%)#711 |
| 28. | Joliet | 389 | 73,081(0.53%)#28 | 1,977,441(0.02%)#743 |
| 29. | Peoria | 383 | 73,081(0.52%)#29 | 1,977,441(0.02%)#759 |
| 30. | South Barrington | 376 | 73,081(0.51%)#30 | 1,977,441(0.02%)#778 |
| 31. | Orland Park | 374 | 73,081(0.51%)#31 | 1,977,441(0.02%)#780 |
| 32. | Gurnee | 368 | 73,081(0.50%)#32 | 1,977,441(0.02%)#794 |
| 33. | Lake Zurich | 352 | 73,081(0.48%)#33 | 1,977,441(0.02%)#827 |
| 34. | Normal | 350 | 73,081(0.48%)#34 | 1,977,441(0.02%)#831 |
| 35. | Wheaton | 338 | 73,081(0.46%)#35 | 1,977,441(0.02%)#859 |
| 36. | Elmhurst | 334 | 73,081(0.46%)#36 | 1,977,441(0.02%)#869 |
| 37. | Romeoville | 332 | 73,081(0.45%)#37 | 1,977,441(0.02%)#874 |
| 38. | Huntley | 330 | 73,081(0.45%)#38 | 1,977,441(0.02%)#878 |
| 39. | Rockford | 327 | 73,081(0.45%)#39 | 1,977,441(0.02%)#882 |
| 40. | Algonquin | 315 | 73,081(0.43%)#40 | 1,977,441(0.02%)#908 |
| 41. | Rolling Meadows | 315 | 73,081(0.43%)#41 | 1,977,441(0.02%)#909 |
| 42. | Bloomington | 310 | 73,081(0.42%)#42 | 1,977,441(0.02%)#927 |
| 43. | Pingree Grove | 308 | 73,081(0.42%)#43 | 1,977,441(0.02%)#937 |
| 44. | Elgin | 298 | 73,081(0.41%)#44 | 1,977,441(0.02%)#960 |
| 45. | Lake Forest | 288 | 73,081(0.39%)#45 | 1,977,441(0.01%)#990 |
| 46. | Long Grove | 286 | 73,081(0.39%)#46 | 1,977,441(0.01%)#996 |
| 47. | Elk Grove Village | 280 | 73,081(0.38%)#47 | 1,977,441(0.01%)#1,016 |
| 48. | Mundelein | 277 | 73,081(0.38%)#48 | 1,977,441(0.01%)#1,026 |
| 49. | Lake In The Hills | 270 | 73,081(0.37%)#49 | 1,977,441(0.01%)#1,045 |
| 50. | Lake Villa | 257 | 73,081(0.35%)#50 | 1,977,441(0.01%)#1,081 |
| 51. | Springfield | 256 | 73,081(0.35%)#51 | 1,977,441(0.01%)#1,083 |
| 52. | Lisle | 250 | 73,081(0.34%)#52 | 1,977,441(0.01%)#1,103 |
| 53. | Oswego | 249 | 73,081(0.34%)#53 | 1,977,441(0.01%)#1,107 |
| 54. | Lincolnwood | 235 | 73,081(0.32%)#54 | 1,977,441(0.01%)#1,158 |
| 55. | Park Ridge | 231 | 73,081(0.32%)#55 | 1,977,441(0.01%)#1,174 |
| 56. | South Elgin | 229 | 73,081(0.31%)#56 | 1,977,441(0.01%)#1,178 |
| 57. | Hanover Park | 228 | 73,081(0.31%)#57 | 1,977,441(0.01%)#1,184 |
| 58. | Frankfort Square | 223 | 73,081(0.31%)#58 | 1,977,441(0.01%)#1,207 |
| 59. | Carpentersville | 218 | 73,081(0.30%)#59 | 1,977,441(0.01%)#1,220 |
| 60. | Broadview | 214 | 73,081(0.29%)#60 | 1,977,441(0.01%)#1,237 |
| 61. | Crystal Lake | 208 | 73,081(0.28%)#61 | 1,977,441(0.01%)#1,264 |
| 62. | Swansea | 207 | 73,081(0.28%)#62 | 1,977,441(0.01%)#1,268 |
| 63. | Bartlett | 200 | 73,081(0.27%)#63 | 1,977,441(0.01%)#1,288 |
| 64. | Glen Ellyn | 198 | 73,081(0.27%)#64 | 1,977,441(0.01%)#1,299 |
| 65. | Deerfield | 198 | 73,081(0.27%)#65 | 1,977,441(0.01%)#1,300 |
| 66. | Montgomery | 193 | 73,081(0.26%)#66 | 1,977,441(0.01%)#1,322 |
| 67. | Downers Grove | 187 | 73,081(0.26%)#67 | 1,977,441(0.01%)#1,352 |
| 68. | O Fallon | 187 | 73,081(0.26%)#68 | 1,977,441(0.01%)#1,353 |
| 69. | Barrington | 187 | 73,081(0.26%)#69 | 1,977,441(0.01%)#1,355 |
| 70. | West Dundee | 184 | 73,081(0.25%)#70 | 1,977,441(0.01%)#1,373 |
| 71. | Waukegan | 183 | 73,081(0.25%)#71 | 1,977,441(0.01%)#1,375 |
| 72. | Prospect Heights | 182 | 73,081(0.25%)#72 | 1,977,441(0.01%)#1,381 |
| 73. | Addison | 181 | 73,081(0.25%)#73 | 1,977,441(0.01%)#1,385 |
| 74. | Volo | 179 | 73,081(0.24%)#74 | 1,977,441(0.01%)#1,409 |
| 75. | West Chicago | 175 | 73,081(0.24%)#75 | 1,977,441(0.01%)#1,423 |
| 76. | Glendale Heights | 172 | 73,081(0.24%)#76 | 1,977,441(0.01%)#1,443 |
| 77. | Bloomingdale | 172 | 73,081(0.24%)#77 | 1,977,441(0.01%)#1,445 |
| 78. | Highland Park | 169 | 73,081(0.23%)#78 | 1,977,441(0.01%)#1,457 |
| 79. | Rock Island | 164 | 73,081(0.22%)#79 | 1,977,441(0.01%)#1,485 |
| 80. | Oak Lawn | 161 | 73,081(0.22%)#80 | 1,977,441(0.01%)#1,502 |
| 81. | Woodstock | 155 | 73,081(0.21%)#81 | 1,977,441(0.01%)#1,544 |
| 82. | Belvidere | 154 | 73,081(0.21%)#82 | 1,977,441(0.01%)#1,555 |
| 83. | Lombard | 150 | 73,081(0.21%)#83 | 1,977,441(0.01%)#1,581 |
| 84. | Decatur | 145 | 73,081(0.20%)#84 | 1,977,441(0.01%)#1,609 |
| 85. | Batavia | 145 | 73,081(0.20%)#85 | 1,977,441(0.01%)#1,613 |
| 86. | Campton Hills | 138 | 73,081(0.19%)#86 | 1,977,441(0.01%)#1,673 |
| 87. | Lansing | 131 | 73,081(0.18%)#87 | 1,977,441(0.01%)#1,727 |
| 88. | Hawthorn Woods | 126 | 73,081(0.17%)#88 | 1,977,441(0.01%)#1,776 |
| 89. | Carbondale | 123 | 73,081(0.17%)#89 | 1,977,441(0.01%)#1,794 |
| 90. | Mchenry | 116 | 73,081(0.16%)#90 | 1,977,441(0.01%)#1,862 |
| 91. | Fairview Heights | 116 | 73,081(0.16%)#91 | 1,977,441(0.01%)#1,864 |
| 92. | North Riverside | 116 | 73,081(0.16%)#92 | 1,977,441(0.01%)#1,871 |
| 93. | Carol Stream | 112 | 73,081(0.15%)#93 | 1,977,441(0.01%)#1,906 |
| 94. | Shiloh | 110 | 73,081(0.15%)#94 | 1,977,441(0.01%)#1,926 |
| 95. | Itasca | 107 | 73,081(0.15%)#95 | 1,977,441(0.01%)#1,968 |
| 96. | East Peoria | 106 | 73,081(0.15%)#96 | 1,977,441(0.01%)#1,974 |
| 97. | Homer Glen | 103 | 73,081(0.14%)#97 | 1,977,441(0.01%)#2,010 |
| 98. | Bensenville | 103 | 73,081(0.14%)#98 | 1,977,441(0.01%)#2,012 |
| 99. | Grayslake | 99 | 73,081(0.14%)#99 | 1,977,441(0.01%)#2,069 |
| 100. | River Forest | 99 | 73,081(0.14%)#100 | 1,977,441(0.01%)#2,073 |
Common Questions
What are the Top 10 Cities with the Largest Burmese Community in Illinois?
Top 10 Cities with the Largest Burmese Community in Illinois are:
#1
16,224
#2
2,534
#3
2,322
#4
1,964
#5
1,960
#6
1,885
#7
1,823
#8
1,469
#9
1,459
#10
1,337
What city has the Largest Burmese Community in Illinois?
Chicago has the Largest Burmese Community in Illinois with 16,224.
What is the Total Burmese Population in the State of Illinois?
Total Burmese Population in Illinois is 73,081.
What is the Total Burmese Population in the United States?
Total Burmese Population in the United States is 1,977,441.